

1. Introduction
1.1. Project background
1.1. Project background
- Berwick Bank Wind Farm Limited (BBWFL) is a wholly owned subsidiary of SSE Renewables Limited and will hereafter be referred to as ‘the Applicant’. The Applicant is developing the Berwick Bank Wind Farm (hereafter referred to as ‘the Project’) located in the outer Forth and Tay region ( Figure 1.1 Open ▸ ).
- The Project is located adjacent to the consented Forth and Tay offshore wind farms (OWFs) consisting of Seagreen to the north, Inch Cape to the northwest and Neart na Gaoithe to the west ( Figure 1.1 Open ▸ ).
- The Project will, if consented, provide an estimated 4.1 GW of renewable energy, making it one of the largest OWFs in the world. Given the anticipated operational life span of 35 years, the development will make a critical contribution to Scotland’s renewable energy target of 11 GW of new offshore wind by 2030. Initially, pre-July 2021, the area was named as two separate sites, Marr Bank and Berwick Bank, but these have now been merged to a single site, Berwick Bank Wind Farm.
- Turbine capacity is yet to be confirmed but will be between 14 – 24 MW, with a maximum number of turbines on site to be 179 - 307. Importantly, the minimum lower blade tip height is 37 m (above LAT) for all turbine options as an engineering design measure to reduce collision risk to seabirds.
- The site boundary of the Project balances maximising the potential for renewable energy generation whilst reducing environmental impacts.
Figure 1.1: Site boundaries for all consented and proposed wind farms currently within the Outer Firth of Forth
1.2. Study area
1.2. Study area
- Three study areas are defined in the Berwick Bank Wind Farm Offshore Scoping Report (October 2021):
- Offshore Ornithology Regional Study Area
- Offshore Ornithology Study Area; and
- Intertidal Ornithology Study Area (reported separately in Appendix 11.2, Intertidal Survey report).
- The Offshore Ornithology Study Area is the focus of this technical report and is located within the survey area of the commissioned digital video aerial surveys, used to provide robust data to define baseline characteristics. The Offshore Ornithology Study Area encompasses the proposed Berwick Bank Development Array and a 16km buffer.
- Since digital aerial video surveys were commissioned, the Berwick Bank Development Array boundary has reduced (see Chapter 4), and the Offshore Ornithology Study Area was adjusted to reflect this. Differences between the two study areas are indicated in Figure 1.2 Open ▸ . For the purposes of this report and all other reports for this submission which pertain to offshore ornithology, the original Development Array boundary and 16km buffer flown during digital aerial surveys will be referred to as ‘the survey area’ and the updated Development Array plus 16 km buffer will be referred to as the ‘Offshore Ornithology Study Area’. Since the entirety of the Offshore Ornithology Study Area falls within the survey area, no additional data collection was necessary; the survey design for digital aerial surveys within the Offshore Ornithology Study Area is indicated in Figure 1.3 Open ▸ . Total areas for the survey area, Offshore Ornithology Study Area and Development Array area were calculated at 4.981 km2, 3,975 km2 and 1010 km2 respectively. Information from digital aerial surveys will also contribute to the characterisation for the proposed export cable corridor, as outlined in Chapter 11.
- The Offshore Regional Study Area is considered in the Offshore Environmental Impact Assessment Report (EIAR). Its area is defined by the mean-maximum breeding season foraging range (plus one standard deviation (SD)) of gannet, which has the largest foraging range of the key species considered in the ornithology assessment (315.2 km ± 194.2 km (Woodward et al., 2019)). Consequently, the maximum extent of the Offshore Ornithology Regional Study Area was calculated as 509.4 km from the Project.
- Within the Offshore Ornithology Regional Study Area, there are many designated protected sites for seabirds in both breeding and non-breeding seasons. Those closest to the Project include the Forth Islands SPA; Fowlsheugh SPA; St Abb’s Head to Fast Castle SPA; and Outer Firth of Forth and St Andrew’s Bay Complex SPA.
Figure 1.2: Original Berwick Bank Development Array plus 16km buffer (‘the survey area’) flown during digital aerial surveys and updated Berwick Bank Development Array and 16 km buffer (the ‘Offshore Ornithology Study Area’)
Figure 1.3: The ‘Offshore Ornithology Study Area’ comprising the updated Berwick Bank Development Array and 16km buffer. The area was surveyed using digital video aerial surveys of 2 km spaced transects
1.3. Purpose of the report
1.3. Purpose of the report
- This technical report provides the baseline ornithological characterisation for the Offshore Ornithology Study Area ( Figure 1.2 Open ▸ ).
- The report provides baseline information on the seasonal distribution, density, and abundance of seabirds based on:
- available reports and literature (“Desktop study” Section 2), and
- analysis of data from a series of digital aerial surveys undertaken in the period 2019 - 2021 (“Berwick Bank digital aerial surveys” Section 3).
- Additional Annexes (A – K) provided separately to this report, detail analytical outputs on species monthly density and abundance estimates.
- The species density and abundance estimates presented in this report (Section 4) underpin further technical reports regarding the collision risk, displacement, and population-level effects of the Project on the seabird community present within the Offshore Ornithology Regional Study Area. All technical reports provide information to support the production of the Berwick Bank Wind Farm Offshore EIAR and Habitats Regulation Appraisal (HRA).
2. Desktop Study
2. Desktop Study
2.1. Key data Sources
2.1. Key data Sources
- A desk-based review was undertaken of existing literature and data sources that were site-specific or relevant to the Offshore Ornithology Study Area. These are summarised in Table 2.1 Open ▸ below.
Table 2.1: Summary of key desktop reports
2.2. Review of additional bird data relevant to the baseline
2.2. Review of additional bird data relevant to the baseline
2.2.1. Berwick Bank boat-based Seabird Surveys (2020 – 2021)
- Site-specific boat-based surveys were undertaken across the Berwick Bank Development array during July-August 2020 and April-June 2021. The surveys were designed to collect flight height data to potentially inform collision risk monitoring for the Project, and to trial measurement techniques. The use of the generic flight height data of Johnston et al. (2014) is currently the advised source for collision risk modelling, but the flight height data on kittiwake collected visually and with the use of a laser rangefinder were analysed and presented to provide additional context in Appendix 11.3: Ornithology Collision Risk Modelling Technical Report.
- Sampling blocks were repeatedly sampled along a continuous transect route broadly following methods as described by Embling et al. (2012; Figure 2.1 Open ▸ ). Where possible the surveys recorded detailed information on the species’ age and plumage of each bird encountered, along with flight height, flight direction, behaviour, interaction with other birds, incidental marine mammal sightings, vessels, and association with other features of interest such as tidal fronts, upwellings, current, detritus or flotsam etc.
- Flight height recording followed the previous boat-based survey method used for Seagreen in 2017 (Harwood et al., 2018), with flight heights visually estimated in 5m bands. Surveyors also used laser rangefinders when not surveying the line transect or when very few birds were present. Rangefinder data formed the basis of the flight height distribution dataset with visual flight heights used for comparison. To increase data collected using rangefinders additional rangefinders were used opportunistically by other observers. The survey methods for the boat-based surveys undertaken in 2020 and 2021 were agreed with ornithological advisors at Marine Scotland, NatureScot and RSPB.
- A total of 47,777 birds were recorded of 37 identified species. Five key species accounted for ~89% of the observations: guillemot (32.09%), kittiwake (23.67%), gannet (16.12%), razorbill (9.68%) and puffin (7.26%). Flight height data were not able to be recorded for every bird. For example, at periods where birds ‘swamped’ the sampling platform, species which could be easily targeted with rangefinders (e.g. gannet) were preferentially selected. For gannet and kittiwake, flight height data were collected for 88% and 70% of total observations (visual estimation plus laser rangefinder data), respectively. Gannet and kittiwake rangefinder data recorded flight heights between 0-78.8 m and 0.6-68.6 m respectively, collected from 1,229 observations. Further details are given in Appendix 11.7, Boat-based Survey Report.
2.2.2. Seagreen Boat-Based Transect Surveys (2009 to 2011)
- Boat-based surveys were carried out for the first phase of baseline data collection for the former Firth of Forth Round 3 Zone across the Seagreen (Alpha – northwest, and Bravo – southeast) site between December 2009 and November 2011. The surveys were designed to characterise baseline ornithology to inform EIA.
- As this dataset is now over ten years old and the abundance of seabirds has likely changed since the data were collected, it provides contextual information to support the primary baseline data source, which are the digital aerial surveys of the survey area undertaken between March 2019 and April 2021.
- A total of 23 monthly boat-based transect surveys were undertaken between December 2009 and November 2011, covering the former Firth of Forth Round 3 Zone, which includes the Project and the Seagreen site. Transects were spaced 3km apart and oriented northwest to southeast to intercept the likely predominant flight lines from major breeding colonies in the Firth of Forth.
- A total of 24,206 birds of 39 species and 20,436 birds of 37 species were recorded at the Alpha and Bravo sites respectively. Within the Alpha site, guillemot (28.10%), kittiwake (24.80%), and gannet (16.10%) were the predominant species recorded. For the Bravo site, guillemot (29.30%), kittiwake (21.60%), and gannet (16.60%) were the most frequently recorded species.
Figure 2.1: Boat based surveys undertaken by ECON and RPS during July-August 2020 and April-June 2021
2.2.3. Seagreen Pre-Construction Monitoring surveys
- Dedicated digital aerial surveys of the Seagreen site were commissioned between March 2019 and September 2020 to provide data for pre-construction monitoring.
- Twenty-six strip transects were flown on a roughly monthly basis over the site plus a 12 km buffer. Two kilometre transect spacing was used, with transects orientated roughly perpendicular to the main environmental gradients, such as depth. The proximity of the Seagreen site to the Offshore Ornithology Study Area resulted in approximately 25% overlap of the Seagreen pre-construction monitoring area with the Offshore Ornithology Study Area, equating to nearly 2,000 km2. Preliminary evaluation of the data suggested the presence of several seabird species of importance, including:
- Qualifying species for nearby SPAs:
- Guillemot, Arctic tern, Sandwich tern, gannet, kittiwake, herring gull, lesser black-backed gull, puffin, little gull, red-throated diver, Manx shearwater, and razorbill.
- European Union (EU) Bird Directive Annex 1 species:
- Guillemot, red-throated diver, Manx shearwater, Sandwich tern, and Arctic tern.
- Species present in regionally important abundance:
- Guillemot, gannet, kittiwake, razorbill, and puffin.
- Baseline data collected during the surveys suggest that kittiwakes, gannets, guillemots and puffins use the area during the breeding season, occurring in relatively high abundance. Relatively high numbers of Arctic terns were also observed in the breeding season. These data suggest that the Seagreen site is used frequently during post-breeding migration by lesser black-backed gulls, guillemots and razorbills. During return migration in the spring, kittiwakes were regularly observed. It is likely that a small population of puffins also utilises the area during the non-breeding season.
2.2.4. JNCC Seabirds at Sea data: Effort related seabird observation data collected from boats using European Seabirds at Sea (ESAS) methodology
- The European Seabirds at Sea (ESAS) database holds the most comprehensive data on the abundance and distribution of northwest European seabirds, spanning over 30 years. Camphuysen et al. (2004) developed methods to assess bird distribution and abundance at sea to evaluate impacts of OWFs on bird populations. Line transect distance sampling methodology was the recommended census technique for boat-based surveys, using distance bands and detection functions to correct for the uncertain detection at increasing distances from the survey vessel.
- The summed counts from the 84 boat-based ESAS surveys (1980 and 1996) trimmed to the Offshore Ornithology Study Area are presented in Table 2.2 Open ▸ . Data were downloaded from https://hub.jncc.gov.uk/assets/5c7d5eca-9b5f-4781-809f-f27c94d94661. These data provide contextual information regarding the species and relative abundance of species likely to be present within the Offshore Ornithology Study Area.
Table 2.2: Total birds identified within the Offshore Ornithology Study Area from ESAS boat-based survey data between 1980 and 1996
2.2.5. Analysis of European Seabirds at Sea (ESAS) data to identify suitable locations for marine SPA’s within the British Fishery Limit
- The ESAS database was used to determine the location of seabird assemblages and identify areas of high seabird densities to ultimately inform the designation of marine SPAs within national waters. Analyses conducted by Kober et al. (2010; 2012) used data from boat-based platforms of opportunity, with those relating to the North Sea region of relevance to the Offshore Ornithology Study Area. Data concerning sitting and flying birds between 1980 and 2004 were collected using line transects and the snapshot method respectively, as described by Camphuysen et al. (2004) and Tasker et al. (1984) and analysed using distance sampling.
- The Outer Firth of Forth/Wee Bankie/Marr Bank region and the Inner Firth of Forth region were highlighted as important areas for multiple seabird species, such as breeding gannets, puffins and guillemots as well as wintering kittiwakes and puffins. Hotspot analyses identifying the presence of high densities of seabird species within the area supported the classification of the Outer Firth of Forth and St Andrews Bay Complex SPA which is in close proximity to the Offshore Ornithology Study Area.
2.2.6. IMPRESS final report: Interactions between the marine environment, predators and prey, implications for sustainable sandeel fisheries – Camphuysen et al., 2004
- The IMPRESS project aimed to quantify the relationships between sandeel populations, hydrography and foraging success and breeding performance of gannets, shags Gulosus aristotelis, kittiwakes and guillemots across the Wee Bankie/Marr Bank complex in the Outer Firth of Forth.
- The IMPRESS study reported high abundance of kittiwakes, guillemots and gannets within the Berwick Bank development zone during the breeding season. These data will not be used during this assessment but are included to indicate which species are likely to be present in important numbers within the Berwick Bank Offshore Ornithology Study Area.
- Colony-based studies of seabird breeding populations were conducted, one on the Isle of May considering shags, guillemots and kittiwakes annually between 1997 and 2003, and for gannets on Bass Rock in 1994 and 2004. Colony counts suggested breeding success for gannets and shags in contrast to that for guillemots where declines in breeding success were observed. Kittiwake breeding success was more variable.
- Boat-based line transect surveys studying seabird distribution, abundance and behaviour were conducted throughout the Outer Firth of Forth region between 2001 and 2004. Data were collected using standard ESAS methods (Tasker et al., 1984). Surveys identified 37 seabird species, the most abundant of which were guillemot (49%), puffin (21%), kittiwake (12%), razorbill (11%) and gannet (6%). Distribution patterns indicated gannets ranged far from colonies, with guillemots and kittiwakes concentrated in the west of the region and shags distributed in coastal regions.
2.2.7. ISLE of May long-term study (IMLOTS)
- The Isle of May long-term study (IMLOTS) aims to assess the impacts of environmental change on seabirds and their surrounding ecosystems on the Isle of May, in the outer Firth of Forth. As part of the Seabird Monitoring Programme (SMP), hosted by BTO and managed by JNCC, data concerning seabird breeding success has been continuously collected since 1982 for puffin, guillemot and razorbill, and since 1987 for shag, kittiwake and fulmar. Seabird breeding success is monitored by collecting data on the number of active nests and the number of chicks fledged per active nest.
- Data collected through IMLOTS will not be directly applied to this report but are instead provided for context regarding which species are likely to be encountered.
2.2.8. Seabird tagging Data
- GPS loggers are used to track fine scale movements of many seabird species within the marine environment, the results of which are used in a variety of micro, meso and macro scale applications.
- Wakefield et al. (2017) tracked 1,313 seabirds from 29 UK colonies using GPS loggers to determine coarse-scale breeding seabird distributions. Foraging ranges were variable between species with shags staying close to nest sites (median 3.4 km, interquartile range (IQR) 1.6–7.5) and kittiwakes (11.9 km, IQR 4.2–30.9), razorbills (13.2 km, IQR 5.1–26.2) and guillemots (10.5 km, IQR 3.2–19.1) travelling further afield. The study also predicted that breeding shags, kittiwakes, guillemots and razorbills primarily foraged within 100km of the coast in Scotland. Tagging data from the Isle of May was included in the analyses, however site-specific data were not presented.
- Cleasby et al. (2018) built on Wakefield et al. (2017) using seabird telemetry data collected between 2010 and 2015 to create species distribution models and identify seabird hotspots at the UK- and SPA-level. Four species were considered: shag, kittiwake, guillemot and razorbill. SPA-level hotspots for kittiwake identified the east of Scotland as being of importance to the species, in particular those associated with Fowlsheugh SPA to the northeast of the Offshore Ornithology Study Area. Hotspots at the SPA-level of relevance to the Project were also identified for shags at the Forth Islands SPA.
- Lane et al. (2020) collected telemetry data from 154 Bass Rock gannets during the breeding season between 2015 and 2019 to assess the risk of consented and proposed offshore wind farms within foraging range. Gannets generally flew northeast and southeast from the colony with males and females spending more time within proposed offshore wind farm sites during chick rearing than during pre-hatching. The potential collision risk was estimated to be eight times higher during this period, and also to be three times higher for females than males due to their higher flight heights, longer trip duration and increased time spent within proposed wind farm sites. The highest recorded densities of gannets from telemetry data overlapped with proposed wind farm sites within the outer Firth of Forth, with 99% of predicted collisions during the breeding season occurring in this region, compared to other wind farm sites which are within the foraging range of Bass Rock gannets but which are considerably more distant. Additional telemetry data have since been gathered from the breeding gannet colony on the Bass Rock since this study was published, which demonstrate a high degree of inter-annual variation in these patterns (Lane and Hamer, 2021).
- Indeed, Lane and Hamer (2021) undertook additional tracking work from the Bass Rock, funded by developers from proposed and consented wind farms within the Forth of Tay (Neart na Gaoithe, Seagreen, and the Project), to determine the impacts of offshore wind farms on adult gannet foraging, survival and population dynamics. Tracks from both sexes overlapped with planned OWF sites in the outer Firth of Forth, although the proportion of tracks falling within these areas was higher in males (rather than females as found by Lane et al. 2020). Distance travelled and foraging trip duration were shorter compared to Lane et al. (2020). Trip duration, distance travelled and distance of displacement from the colony was consistent between sexes. Sex-specific survival was likely to be variable, although no trends could be determined.
- Bogdanova et al. (in prep.) presents the results of GPS tracking of adult guillemots, razorbills and puffins breeding on the Isle of May, and of kittiwakes breeding on the Isle of May, St Abb’s Head and Fowlsheugh in June and July 2021. An assessment of connectivity with three OWF sites in the outer Firth of Forth (Neart na Gaoithe, Seagreen and the Project) was conducted. Locational data were obtained from 23 guillemots, 11 razorbills, 24 puffins and 50 kittiwakes on the Isle of May, 40 kittiwakes at Fowlsheugh and 37 kittiwakes at St Abb’s Head.
2.2.9. WWT waterbird surveys
- Waterbirds and seabirds in inshore waters were monitored regularly by WWT Consulting between 2004 and 2009, to provide a comprehensive and robust assessment of UK inshore environments (e.g., Calbrade et al. 2009; Austin et al. 2007). Visual aerial surveys were conducted, using transects spaced at 2 km intervals orientated north to south. Survey methodology and distance sampling protocol from Buckland et al. (2001) and Camphuysen et al. (2004) was adopted.
- Although the study did not cover the region considered for the Project, it gave reliable population estimates for waterbird species in the wider vicinity of the Project and indicates which species are likely to be present.
- The “NE1” sampling block is closest to the Offshore Ornithology Study Area, located approximately 20 km from the southwest boundary of the buffer. Auks and gannets were identified as the most abundant species, with 6,199 birds recorded in the survey block overall. However, only non-breeding season surveys were targeted, and it is likely other species of interest may be present at other times.
3. Berwick bank digital aerial surveys
3. Berwick bank digital aerial surveys
3.1. Overview of survey flights
3.1. Overview of survey flights
- Dedicated digital video aerial surveys conducted by HiDef Aerial Surveying Limited (hereafter “HiDef”) were deployed for ornithological monitoring over the Offshore Ornithology Study Area using methods described in Buckland et al. (2012), Weiss et al. (2016) and Webb and Nehls (2019).
- The aircraft flight altitude, >500 m, and other technical parameters of the adopted method conform with the guidance of Thaxter and Burton (2009) and updated in Thaxter et al. (2016). To complete the survey coverage in a single day and obtain a suitable snapshot, HiDef deployed two to four aircraft on each occasion to survey the area simultaneously with each aircraft surveying unique subsets of survey transects ( Figure 3.1 Open ▸ ).
- The survey programme ran from March 2019 to April 2021 and aimed to survey the Offshore Ornithology Study Area at monthly intervals or as close to this as possible. A total of 25 surveys were successfully flown, with a summary of survey flights presented in Table 3.1 Open ▸ .


The COVID-19 pandemic halted all non-essential survey activity during April 2020, however surveys resumed in May 2020 based on updated risk assessments and stringent COVID-19 mitigation measures. Due to this and further complications (e.g., industrial action of airport personnel), complete coverage was not achieved in all months.- The April 2019 survey was missed due to bad weather, the January 2020 survey was flown at the beginning of February 2020, and two surveys were undertaken in May 2020 due to the April 2020 survey being cancelled. For the analysis of the data, some flights were assigned to different months where there was no survey to ensure coverage of all months in both seasons for a two-year period (see section 3.2.8). The Applicant discussed this allocation during the Ornithology Road Map process (RM4) and followed subsequent joint advice from Marine Scotland and NatureScot received through email on 14 January 2022.

For all surveys between July 2019 and January 2020, varying proportions of the intended transects were not flown. However, the target coverage for the site (~12.5%) was achieved by increasing the number of cameras from which the imagery was processed. Whilst this increased overall coverage, there remained limited “gaps” spatially where transects could not be surveyed (e.g., December 2019; Figure 3.2 Open ▸ ). Despite differences in survey coverage in some months, the survey results are of sufficient quality to provide robust baseline characterisation of the Offshore Ornithology Study Area.- Flight times for each survey are presented in
- Table 3.2 Open ▸ . HiDef’s survey times are targeted at times of day that exclude 1.5 hours of sunrise and sunset in summer and winter. The dawn and dusk periods are excluded because the sun angle and light levels are too low for digital imagery at these times of the day. Dawn and dusk periods are also often out with airport opening hours.
- Additional environmental information, such as time of sunset and high tide times, is also presented in
- Table 3.2 Open ▸ . The extent of the survey programme ensured that sampling occurred over a range of tidal states. Tidal state can influence the activity and habitat use of many bird species (Gilbert et al., 1998) but given the offshore location of the Project, the influence of tidal state on seabird densities is also likely lower than in coastal areas.
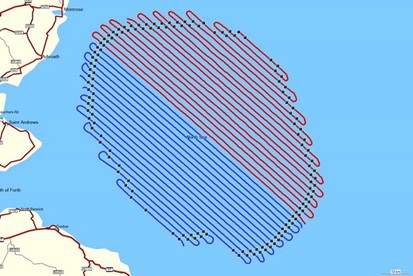
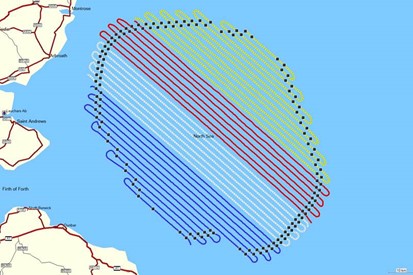
- Aircraft flight patterns are displayed in Figure 3.2 Open ▸ , Figure 3.3 Open ▸ and Figure 3.4 Open ▸ . Variation in presentation of track data is due to differing GPS equipment used in some surveys. The same transect lines were intended to be flown in each survey, however, effort differed between surveys due to slight differences in start and stop times and minor deviations of the aircraft from the transect line. It is important to note that aircraft flight patterns follow the original survey design covering the survey area (contractually agreed with the Applicant in September 2019) and extend beyond the Offshore Ornithology Study Area. The survey design was presented to Consultees through at the first meeting of the offshore Ornithology Road Map process (Technical Appendix 11.8).
Figure 3.1: Transect splits between aircraft during summer months (April – September) A) 2 aircraft B) 3 aircraft and C) 4 aircraft, during autumn and early spring months (October – March) over the survey area. Note: flight paths follow original survey design (agreed in September 2019)
Table 3.1: Survey effort and flight information for the 25 surveys of the survey area (original Berwick Bank Development Array plus 16 km buffer)
1April 2019 missed due to bad weather
2January 2020 survey undertaken on 05/02/2020.
3April 2020 survey suspended due to Coronavirus. Two surveys undertaken in May 2020 instead.
4Two surveys flown in April 2021 to ensure representative samples of “April” were available.
For all surveys between July 2019 and January 2020, extra cameras were reviewed to achieve required coverage and to compensate for missed transects.
Figure 3.2: Aerial survey transect coverage for each survey over the survey area (original Berwick Bank Development Array plus 16 km buffer) between March 2019 and March 2020
Figure 3.3: Aerial survey transect coverage for each survey over the survey area (original Berwick Bank Development Array plus 16 km buffer) between May 2020 and April (S01) 2021
Figure 3.4: Aerial survey transect coverage over the survey area (original Berwick Bank Development Array plus 16 km buffer) during April (S02) 2021
3.2. Methodology
3.2. Methodology
- A series of strip transects were flown across the survey area, extending beyond the Offshore Ornithology Study Area, between March 2019 and April 2021.
- The survey design consisted of 37 strip transects extending roughly north-west to south-east, perpendicular to the depth contours along the coast. Such a placement helped to ensure that each transect sampled a range of habitats (primarily relating to water depth), to reduce variation in bird and marine mammal abundance estimates between transects.
- Transects were placed at 2 km apart across the survey area, resulting in an overall survey area of approximately 4,981 km2. The Offshore Ornithology Study Area covers 3,975 km2 and is entirely within the survey area.
- Surveys were undertaken using an aircraft equipped with four HiDef Gen II cameras with sensors set to a resolution of 2 cm Ground Sample Distance (GSD). Each camera sampled a strip of 125 m width, separated from the next camera by ~20 m, providing a combined sampled width of 500 m within a 575 m overall strip ( Figure 3.5 Open ▸ ).
- Surveys were flown along the transect pattern shown in Figure 3.2 Open ▸ for example, and at a height of approximately 550 m above sea level (ASL) (~1800’). Flying at this height ensures that there is no risk of flushing those species easily disturbed by aircraft noise. Thaxter et al. (2016) recommends a minimum flight altitude of 460-500 m ASL.
- Position data for the aircraft was captured from a Garmin GPSMap 296 receiver with differential GPS enabled to give 1m accuracy for the positions and recording updates in location at one second intervals for later matching to bird and marine mammal observations.
![]()
Figure 3.5: Schematic depicting the digital video aerial survey methodology
- For most surveys, data from two out of the four cameras were processed to achieve a minimum target of 12.5% site coverage. This ensured sufficient coverage and number of transects, whilst allowing the remaining unprocessed data to be archived.
- Where survey transects had been compromised, additional cameras were processed to achieve the 12.5% target. This was necessary for surveys from July 2019 to January 2020 inclusive.
3.2.2. Image processing
- Data were viewed by trained reviewers who marked any objects in the footage as requiring further analysis by the Identification (ID) Team, separating them into broad categories of birds, marine megafauna or anthropogenic objects.
- An object was only recorded where it reached a reference line (‘the red line’) which defined the true transect width of 125m for each camera. By excluding objects that do not cross the red line, biases to abundance estimates caused by flux (movement of objects in the video footage relative to the aircraft, such as ’wing wobble’) are eliminated.
- As part of HiDef’s quality assurance (QA) process, an additional ‘blind’ review of 20% of the raw data was carried out and the results compared with those of the original review. If 90% agreement was not attained during the QA process, then corrective action was initiated: the remaining data set was reviewed and where appropriate, the failed reviewer’s data discarded and all the data re-reviewed. Additional training was then given to the reviewer to improve performance.
3.2.3. Species identification
- Images marked as requiring further analysis were reviewed by specialist ornithologists for identification to the lowest taxonomic level possible and for assessment of the approximate age and the sex of each animal, as well as any behaviour traits visible from the imagery.
- At least 20% of all birds were selected at random and subjected to a separate ‘blind’ QA process. If less than 90% agreement was attained for any individual camera then corrective action was initiated: if appropriate, the failed identifier’s data were discarded, and the data re-identified. Any disputed identifications were passed to a third-party expert ornithologist for a final decision.
- All birds were assigned to a species group and where possible, each of these were then further identified to species level. Identifications were given a confidence rating of ‘possible’, ‘probable’ or ‘definite’.
- Any birds that could not be identified to species level were assigned as ‘No ID’. If, on occasion, the unidentified bird is suspected of belonging to two possible genera, then a broader group category may be used. For example, a bird would usually be assigned to the group category ‘Shearwater species’ if identified as a Manx shearwater, or to ‘Auk species’ if identified as a guillemot. However, if the bird has the potential to be either, then it would be assigned to the group category ‘Shearwater / Auk species’ and the species level recorded as ‘No ID’.
- A list of scientific names and taxonomic groupings used in the study are presented in Annex A.
3.2.4. Age, Sex and Behaviour
- Where possible, birds were assessed for approximate age and sex. Aging of birds was based on moults and was therefore conducted only on flying individuals and species which show seasonal variation in plumage.
- The behaviour of each bird was recorded. The direction of travel was also noted in the case of flying birds.
3.2.5. Geo-referencing
- All data were geo-referenced, taking into account the offset from the transect line of the cameras, and compiled into a single output; Geographical Information System (GIS) files for the Observation and Track data are issued in ArcGIS shapefile format, using UTM30N projection, WGS84 datum.
3.2.6. Bird abundance and density estimation
- The abundance of each species observed was estimated separately using a design-based strip transect analysis. During analysis, survey area data were trimmed to the Offshore Ornithology Study Area. All subsequent data within this report refer only to the updated Berwick Bank Development Array and corresponding 16km buffer (the Offshore Ornithology Study Area), although the various annexes also provide estimates for the Development Array, see Table 5.1 Open ▸ for description of Annexes.
- Each transect is treated as an independent analysis unit, and the assumption is made that transects can be treated as statistically independent random samples from the site. The length of each transect and its breadth (i.e. the width of the field of view of the camera) multiplied together give the transect area; dividing the number of observations on that transect by the transect area gives a point estimate of the density of that species for the transect. The density of animals at the site (and hence the population size), the standard deviation, the 95% Confidence Intervals (CIs) and coefficient of variance (CV) are then estimated using a non-parametric bootstrap method with replacement (Buckland et al., 2001).
- The upper and lower 95% confidence intervals were performed by way of a blocked bootstrapping technique to ensure equal transect effort was sampled across each iteration. This was done by using transect ID as the sampling unit with replacement, and then randomly sampling until the total length of the sampled transects equalled approximately the same length as the total survey length. A total of 500 bootstrap iterations were performed from which mean and standard deviation of the sampled means were calculated, as well as the relative standard error as defined by the standard deviation divided by the mean (or the “Coefficient of Variation”, CV). Data were processed in the R programming language (version 4.0.4).
- The density estimate is expressed as the average number of animals per square km surveyed over the whole site, and the population estimate is then calculated as the average density multiplied by the area of the whole site. The standard deviation is a measure of the variance of the population estimate, standardised by the number of samples (transects). The upper and lower CI define the range that the population estimate falls within with 95% certainty. The CV is a measure of the precision of the population and density estimates.
- For most species these abundance estimates relate to absolute abundance, but for diving species (such as auks) the abundance relates to relative abundance due to a proportion of animals being submerged at the time of survey.
- Density and abundance can also be derived using model-based methods. These methods tend to result in similar estimates as from design-based methods, and this was verified by completing model-based density and abundance estimates for five focal species to compare with the design-based estimates: kittiwake, guillemot, razorbill, puffin and gannet. HiDef undertook density surface modelling using the Marine Renewables Strategic Environmental Assessment (MRSea Windows Package package) in R (Scott-Hayward et al., 2013). HiDef adapted and customised some of the MRSea code so that the modelling approach could cope with the specific nuances of the Berwick Bank data (code can be made available on request). This work was undertaken through consultation with the package author (Scott-Hayward) and was reported to consultees during the Road Map consultation process. The methodology and in depth-results are reported in Annex L to this report. The outputs that allow comparison to the design-based estimates are presented in Section 4.1.
Apportioning of unidentified birds
- Apportioning of ‘unidentified’ birds to species level was also undertaken for the purposes of calculating population estimates. The number of unidentified birds in each species group were assigned to species where appropriate, based on their respective abundance ratios. For example, if identified guillemots and razorbills occurred in a 4:1 ratio, then 80% of unidentified birds would be assigned to guillemot and 20% assigned to razorbill. Apportioned estimates are presented in text, with apportioned and unapportioned estimates presented in the Annexes for reference.
Centcount maps
- Cent-count maps were created to show the distribution of species. To account for varying survey effort for visualization, design-based population estimates, and statistical modelling, observations were run through a HiDef data aggregation tool which organized those data into regularly spaced bins along transect lines. This tool works by interpolating GPS tracks from the aircraft and locating points along those tracks which are approximately 500 m apart (i.e., centroids of 500 m bins). These 500 m bins then use a nearest neighbour technique to aggregate observations into those centroid locations (i.e., observations are aggregated into the nearest centroid point along the line). To calculate the area surveyed for each bin, the length of the bin is multiplied by the strip width of the cameras (125 m x n cameras, where n is the number of cameras used in that transect). The circles represent the number of birds in each 500 m bin. The larger the circle, the greater the number of birds present.
- Where more than 40% of the surveys had observations, all surveys have been displayed in centcount maps, including those with no observations. This is with the exception of Survey April (S02) 2021 which was only mapped where observations were present. Where less than 40% of surveys had observations, only surveys with observations have been displayed in maps.
Correction for availability bias
- In wildlife surveys, a proportion of seabirds that spend time underwater, especially while feeding, will not be detectable at the surface. This “availability bias” leads to an under-estimate of their abundance.
- Barlow et al. (1988) produced a method to estimate true abundance by using correction factors based on species-specific data on time spent underwater.
- Following Barlow et al. (1988) the probability that an animal is available at the surface is calculated as:
![]()
Where s is the average time spent at the surface, t is the window of time that the animal is within view and d is the average time below the surface. In the case of digital video surveys, the value of t is negligibly small and is treated as 0.
- Using Barlow’s method, we calculated the proportion of time that an animal was available at the surface (Pr (visible)) for guillemot and razorbill. Absolute density, corrected for availability, was then obtained by dividing the density of birds observed by the Pr(visible).
- For guillemots and razorbills, data obtained during the breeding season using data loggers was used to estimate availability bias. Thaxter et al. (2010) give mean times for these species engaged in flying, feeding and underwater per trip during the chick-rearing period.
- Thus, the proportion of time that guillemots and razorbills were available at the surface (Pr(visible)) was estimated at 0.7595 and 0.8182, respectively.
- For puffins the results from a study using data loggers reported in Spencer (2012) were used. The results show that puffins spend 14.16% of daylight time underwater. This infers that the proportion of time that puffins were available at the surface (Pr(visible)) was 0.8584.
- The estimates of Pr(visible) for guillemots, razorbills and puffins were used to correct relative abundance estimates of birds sitting on the sea. These corrected abundance estimates for sitting birds were then added to the abundance estimate of flying birds to give an overall absolute abundance for each species.
- Correction for availability bias was not undertaken for any other species due to a lack of information about diving patterns.
3.2.7. Consideration of biological seasons
- Bird abundance and distribution varies greatly throughout the year, dictated largely by season and bird biology. This report recognises two main biologically distinct ‘bio-seasons’, which aid in understanding the importance of the site for each species during a yearly cycle. We have used the seasonal definitions outlined in NatureScot guidance (2020a), as agreed during the Ornithology Road Map process. Seasonality is complex and periods differ between species based on life history traits, with timings an approximation. Figures collated for each species are summarised in Figure 3.6 Open ▸ . Bio-seasons used within this technical baseline report are:
- Breeding season: birds are strongly associated with a nest site, including nesting, egg-laying and provisioning young.
- Non-breeding season: period where no breeding takes place, which may encompass birds over-wintering in an area and migration periods between breeding and wintering sites dependent on the species.
3.2.8. Calculation of Mean Seasonal Peaks
- Mean seasonal peak (MSP) population estimates were calculated for each species in each bio-season, taken as an average over the two years of surveying (March 2019 – April 2021). For example, the MSP population estimate for the breeding season was calculated as the average of the peak count in the breeding season in year one and the peak count in the breeding season in year two.
- Surveys were generally assigned to a season based on the day of the month that the survey was flown. For seasons starting or ending halfway through the month, the 15/16 was used as a mid-month cut off. This was necessary to avoid the same monthly estimate potentially being used in both the breeding and non-breeding season.
- To account for months where there was no survey, some flights were assigned to different months or years to ensure coverage of all months in both seasons for a two-year period ( Table 3.2 Open ▸ ). The Applicant discussed this allocation during the Ornithology Road Map process (RM4) and followed subsequent joint advice from Marine Scotland and NatureScot received through email on 14 January 2022.
- This treatment of surveys was only conducted for calculation of mean-seasonal peaks and age class proportions, with all other data presented in this technical report by the date that the surveys were flown.
Table 3.2 Open ▸ : Treatment of rescheduled surveys for calculation of mean seasonal peaks (MSPs) and age proportions per season
Survey name | Date flown | Used to represent | Date used in analysis |
|---|---|---|---|
Jan-20 | 05/02/20 | January 2020 | 30/01/20 |
Feb-20 | 19/02/20 | February 2020 | 19/02/20 |
May S01 20 | 05/05/20 | April 2020 | 30/04/20 |
May S02 20 | 16/05/20 | May 2020 | 16/05/20 |
Apr S02 21 | 24/04/21 | April 2019 | 24/04/19 |
- MSP population estimates are presented for the offshore Ornithology Study area for context. MSPs for the for the Development array plus a 2km buffer, which are required for relevant species for displacement modelling and assessment are also reported. MSPs for the array area only are reported separately in the Appendix 11:4: Ornithology Displacement Technical Report.
3.2.9. Calculation of Age Class Proportions
- To assess the proportion of birds in each age class (adult, immature, juvenile), the average or mean number of birds recorded in each class was calculated across all surveys that occurred in each season. For example, if there were four surveys in the breeding season in year one and four surveys in the breeding season in year two, then the average number of adult birds was calculated across eight surveys in total. This was conducted using all data within the 16 km boundary. Surveys were assigned to a season based on the day that the survey was flown, with the exceptions listed in Table 3.2 Open ▸ . For seasons starting or ending halfway through the month, the 15/16 was used as a mid-month cut off.
- The resulting proportion in each class was calculated as a proportion of the sum of the average number in each age class. This is presented for species where aging was possible, namely gulls, gannets and terns.
4. Results
4. Results
- The total number of birds observed during the 25 surveys in the Offshore Ornithology Study Area and subsequently identified to species level are presented in Table 4.1 Open ▸ and Table 4.2 Open ▸ . Species addressed in greater detail within this report are highlighted in grey. Birds which could not be identified to species level but were assigned to a broader species group are presented in Table 4.3 Open ▸ and Table 4.4 Open ▸ . For comparative purposes between survey years, all species recorded are presented in Table 4.1 Open ▸ and Table 4.2 Open ▸ , even if only recorded in one year.
- Scientific names of species and taxonomic groupings are presented in Annex A.
Table 4.1: Raw counts of birds detected and assigned to species level in Year 1 of surveying at Offshore Ornithology Study Area: March 2019 to February 2020
Table 4.2: Raw counts of birds detected and assigned to species level in Year 2 of surveying at Offshore Ornithology Study Area: March 2020 to April 2021
Table 4.3: Raw counts of birds with no species ID, assigned to species groups, in Year 1 of surveying at Offshore Ornithology Study Area: March 2019 to February 2020
Table 4.4: Raw counts of birds with no species ID, assigned to species groups, in Year 2 of surveying at Offshore Ornithology Study Area: March 2020 to April 2021
4.1. Abundance estimates: comparison of design- and model- based
4.1. Abundance estimates: comparison of design- and model- based
- Plots of density and associated 95% confidence intervals for each survey for kittiwake, guillemot, razorbill, puffin and gannet enable comparison between estimates generated from design and model-based methods.
- Kittiwake estimates were relatively similar from the two methods throughout the study period ( Figure 4.1 Open ▸ ). Likewise, for razorbill and puffin, the estimates from the two methods were effectively the same, as demonstrated by the overlapping confidence intervals ( Figure 4.3 Open ▸ and Figure 4.4 Open ▸ respectively).
- Estimates produced by both methods for gannets were similar apart from December 2019 and February 2020, where MRSea produced much larger population estimates. This was due to the model being unable to resolve the spatio-temporal relationship in the survey gaps, leading to unrealistic estimates.
- The estimates using design-based and MRSea methods for guillemots were relatively similar. However, in October 2019 MRSea produced a significantly higher estimate than those produced by the design-based method. There was also less variation in the two methods outputs in Year 2 (2020/21) ( Figure 4.2 Open ▸ ).
- MRSea results cannot be replicated despite reruns with the same code and input parameters as the stochasticity in the bootstrapping used to produce estimates will lead to different values on every run and due to the selection of spatial knots.
- The use of density-based estimates was more appropriate for downstream processes due to the instability of MRSea across several metrics. First, confidence limits of model-based population estimates were wider than design-based in most cases, particularly in October 2019 surveys. An often-cited desirable trait of model-based estimates is the ability to generate tighter confidence limits around population estimates. However, design-based estimates provided tighter confidence limits compared to model-based estimates in this case. Another reason for the selection of design-based over model-based population estimates was related to stochasticity in the MRSea process which generated vastly different results when running the same set of code with no changes in data or parameters ( Table 4.5 Open ▸ and Table 4.6 Open ▸ ). This seemed to be related to the random selection of spatial knots combined with large gaps in the survey areas. This stochasticity meant that the MRSea results were unreliable (in April S02 of the 2021 surveys, there was a difference of 2,438 individuals between both model runs, while in October 2019, due to large gaps in survey effort, in one model, the mean estimate was unrealistically high, while in the next run, estimates were in line with other months). Although the estimates fall within respective confidence limits between runs, the differences would invariably impact MSPs used for displacement and, for other species, density estimates for collision risk modelling.
- On a technical point, another reason for using design-based estimates rather than the MRSea outputs was because of the inability to save output files from MRSea to allow for re-examination of model outputs. File sizes of the outputs were on the order of 20 GB (due to the size of the dataset) and were unable to be re-read into the R interface, meaning re-visiting models was not possible. This issue was raised at the Marine Scotland Ornithology Impact Assessment Workshop on the 22 February 2022, and it was confirmed that there are currently no plans to change output file format. The possibility of modelling at a monthly scale (as opposed to a seasonal scale; suggested by Scott-Hayward during the Marine Scotland Ornithology Impact Assessment Workshop) to help overcome issues with data gaps was not considered because downstream processes required population estimates at the survey-level scale to aggregate data.
- Annex L provides monthly population estimates by species from the MRSea analyses and spatial maps of the mean densities and uncertainty (95% CIs and CVs) around those estimates.
Table 4.5: Exemplar abundance outputs from two runs of MRSea for guillemot from March 2019 to February 2020. Input data and model parameters were identical with the only difference being between location of the spatial knots
Table 4.6: Exemplar abundance outputs from two runs of MRSea for guillemot from March 2020 to April 2021. Input data and model parameters were identical with the only difference being between location of the spatial knots
Figure 4.1: Comparison of the density estimates produced using design-based and MRSea methods for kittiwakes
Figure 4.2: Comparison of the density estimates produced using design-based and MRSea methods for guillemots
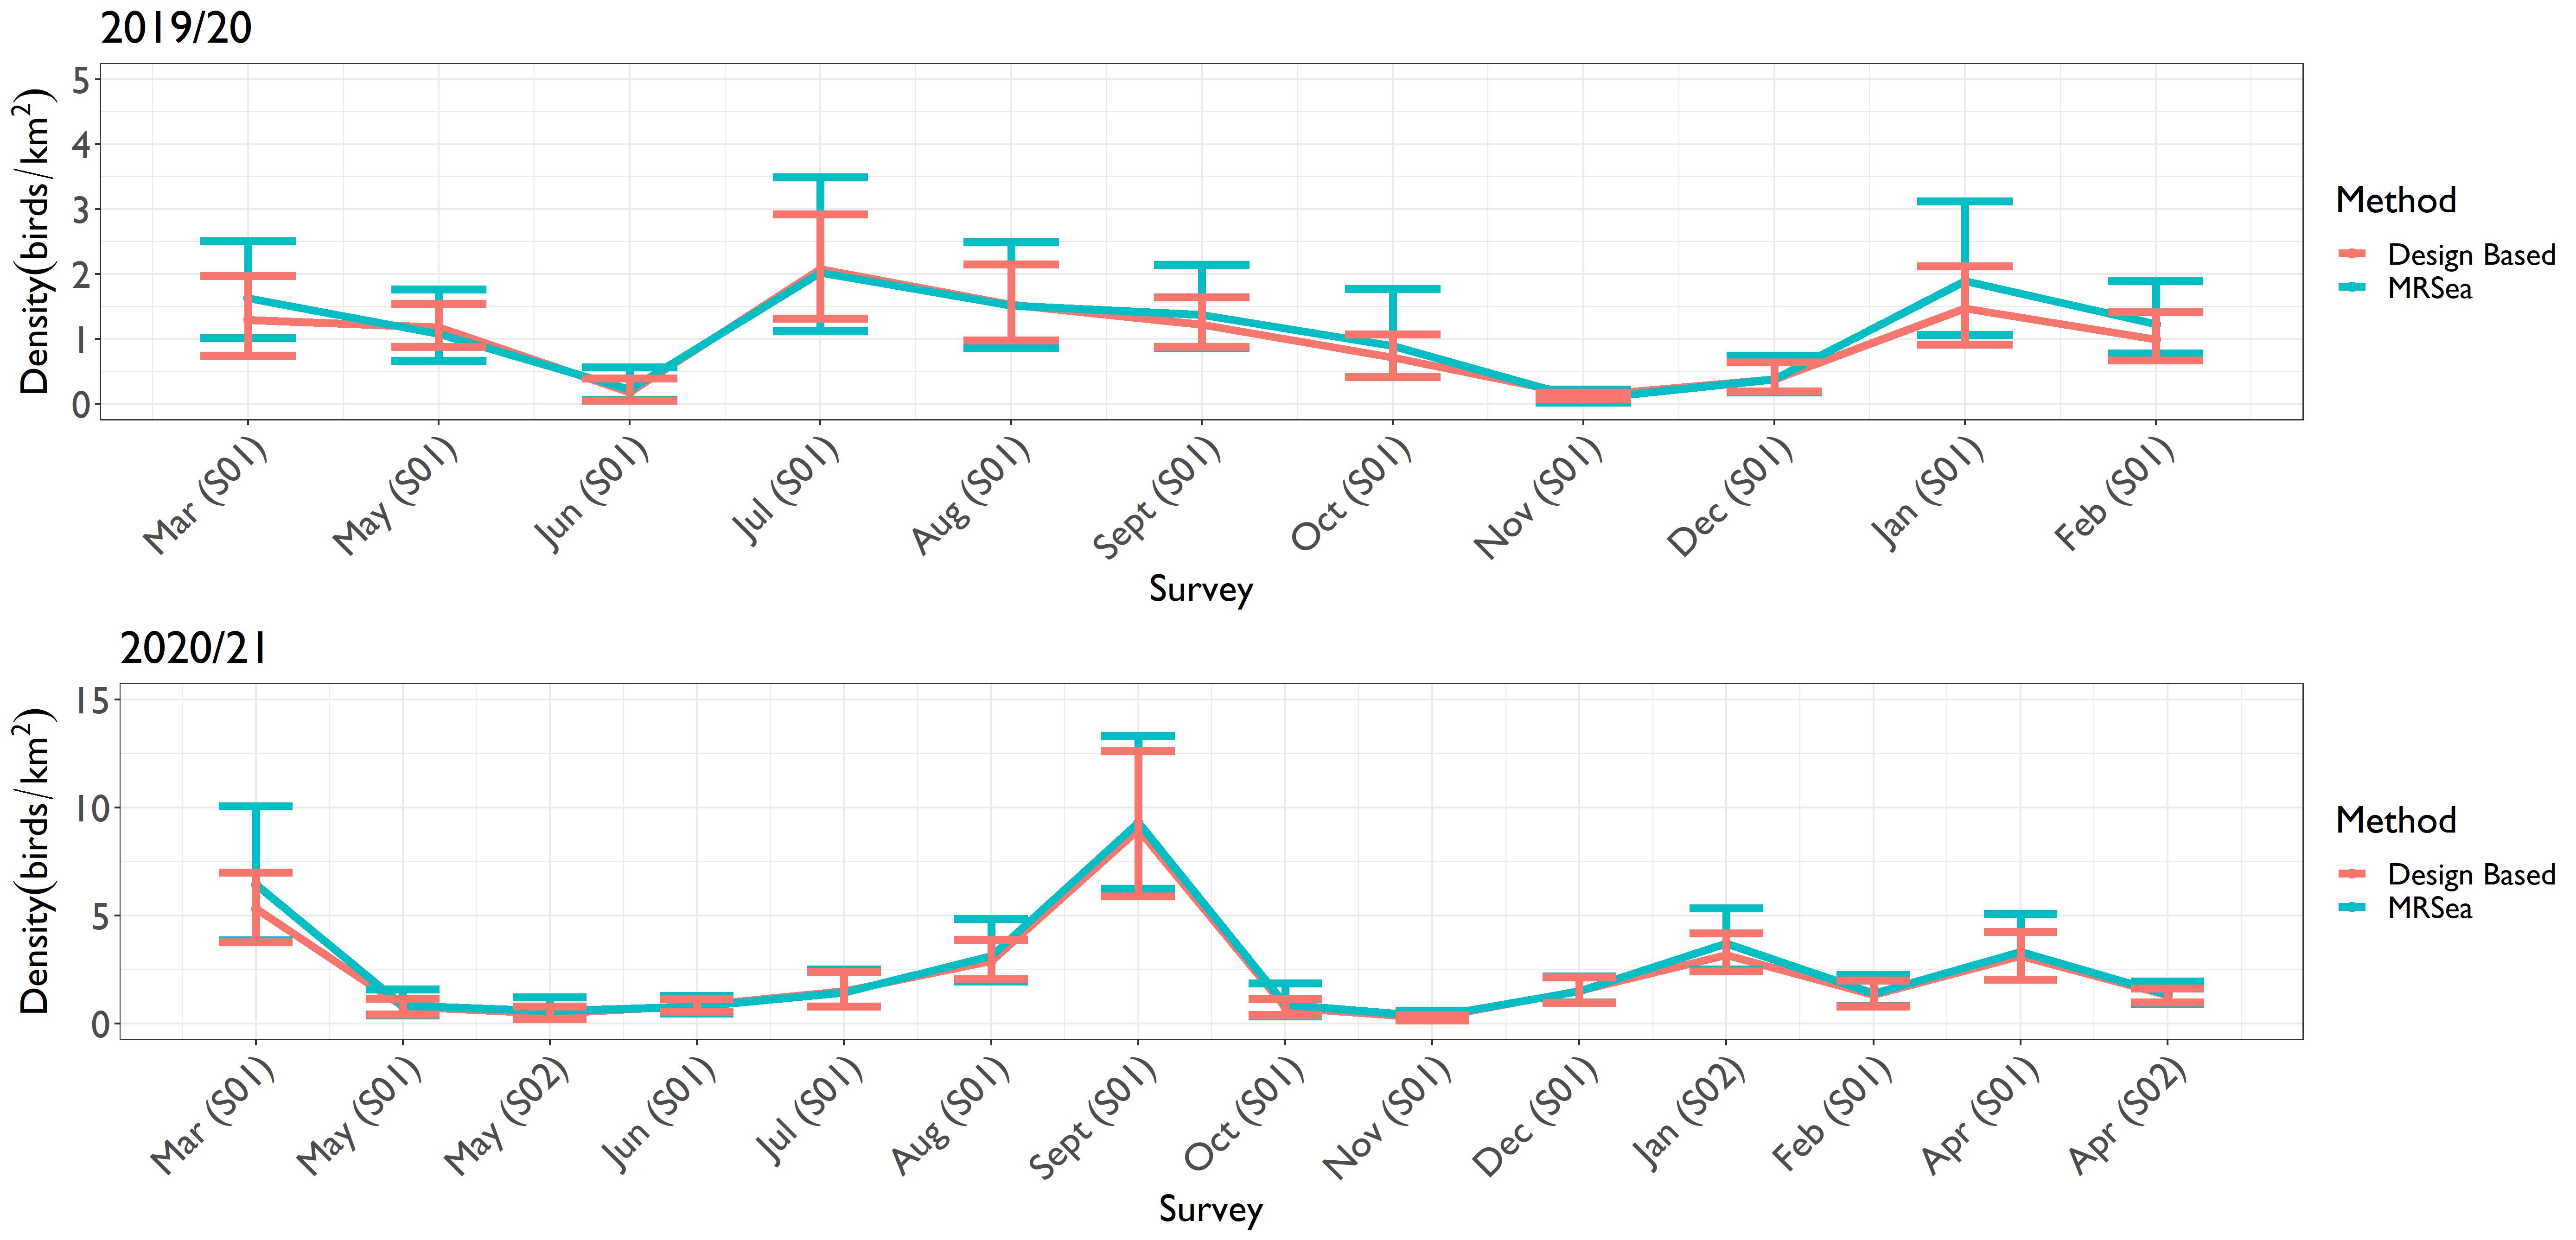
Figure 4.3: Comparison of the density estimates produced using design-based and MRSea methods for razorbills
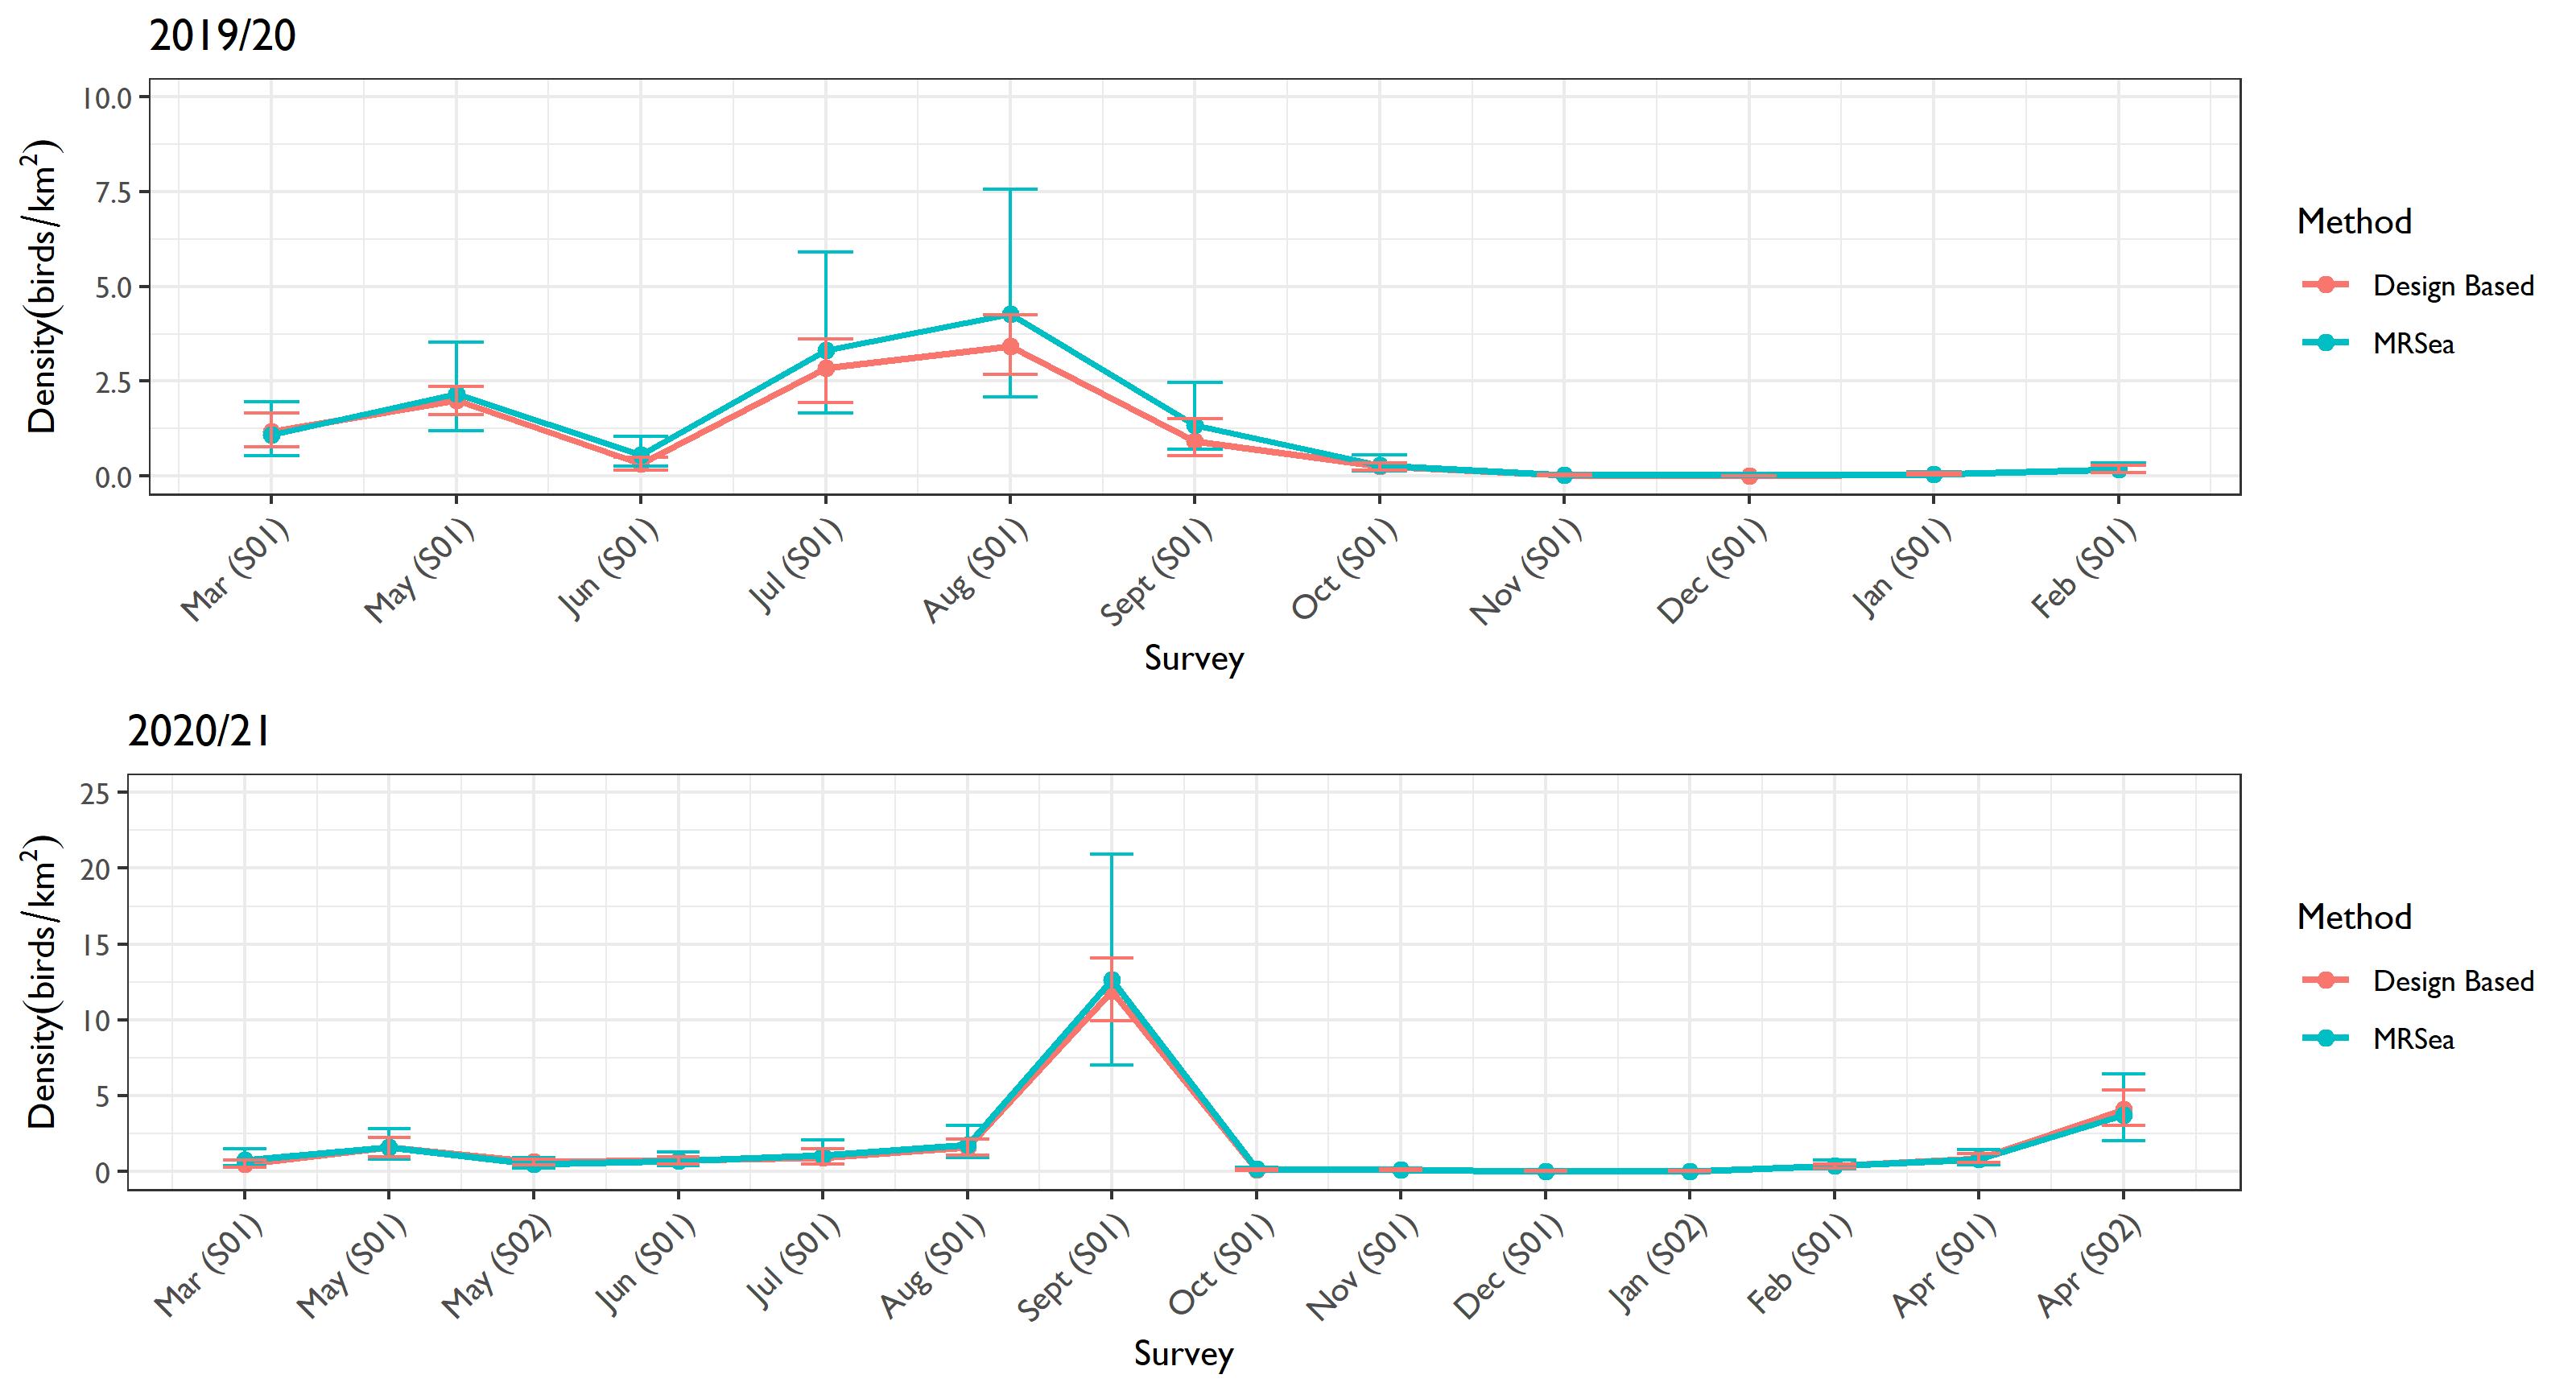
Figure 4.4: Comparison of the density estimates produced using design-based and MRSea methods for puffins
5. Species accounts
5. Species accounts
- Eighteen species are the focus of the species accounts and discussed in greater detail below:
- common scoter;
- kittiwake;
- black-headed gull;
- little gull;
- common gull;
- herring gull;
- lesser black-backed gull;
- common tern;
- arctic tern;
- great skua;
- guillemot;
- razorbill;
- puffin;
- gannet;
- red-throated diver;
- fulmar;
- manx shearwater; and
- shag.
- These species were identified taking account of the Berwick Bank Scoping and HRA Screening Reports, and ensure relevant information is provided for Environmental Impact Assessment.
- For each species account, estimates are provided for the Offshore Ornithology Study Area, apportioned for unidentified birds and adjusted for availability bias where appropriate. Unapportioned estimates, and those for the Project only, are provided in the attached annexes (see Table 5.1 Open ▸ ). Population estimates for a 2 km buffer around the Project are presented separately in Appendix 11.4: Ornithology Displacement Technical Report.
- Low densities may appear as 0.00 birds/km2 yet still have low population estimates presented. This is simply a result of rounding very low densities to 2 decimal places. Similarly, some upper confidence limits presented in graphs may appear to sit at the mean; this is also an issue of rounding.
Table 5.1: Summary of content of Annexes A to L. Dev array= Development array. ‘Apportioned?’ Refers to whether the estimates are for all birds, including those detections assigned to a species group but latterly assigned to a species
*Estimates presented on a survey-by-survey basis, rather than grouped by species
5.1. Kittiwake
5.1. Kittiwake
- The most abundant gull species globally, kittiwakes are small coastal seabirds which form large colonies during the breeding season, before dispersing offshore for the non-breeding season (Mitchell et al., 2004; Coulson, 2011). Many large colonies are located along the east coast of Scotland, although some are also present on man-made structures such as buildings and oil rigs (Mitchell et al., 2004). The species is currently Red-listed on the UK Birds of Conservation Concern List (Stanbury et al., 2021).
- Kittiwake productivity (defined by mean fledged chicks per nest) increased along the east coast of Scotland between 2009 and 2019. Although sea surface temperature (SST) increased in the Firth of Forth 1980-2010, the following decade saw a decrease in sea surface temperature (SST) in the region and this is thought to have had a positive effect on productivity (Wanless et al., 2018; JNCC, 2021). Consequently, abundance and breeding success have shown a degree of stability over the period 2011 – 2018 for many of the key species, including kittiwake (Scotland’s Marine Assessment, 2020).
- It is likely that decreases in SST positively influence sandeel abundances, increasing the availability of this food source to kittiwakes within the region (Arnott and Ruxton, 2002). Kittiwakes are particularly vulnerable to changes in sandeel availability (Frederiksen et al., 2005), as birds can only feed at or near the sea surface, thus having less access to a greater range of species in the water column. Kittiwake productivity and survival was previously affected by a sandeel fishery in south-east Scotland, which ceased operation in 2000 (Frederiksen et al., 2004).
- Estimated apportioned densities from design-based analysis ranged between 0.48 (November 2019) and 13.86 (September 2020) birds/km2, equating to population estimates for the Offshore Ornithology Study Area ranging between 1,903 birds (95%CI 1,031 – 3,128; November 2019) and 55,139 birds (95%CI 41,872 – 71,811; September 2020) ( Table 5.3 Open ▸ ).
- High abundances of kittiwakes within the Offshore Ornithology Study Area in summer months, such as August 2019 and 2020 ( Table 5.3 Open ▸ ), are consistent with Berwick Bank and Seagreen boat-based seabird surveys, where kittiwakes accounted for a high proportion of the total birds present, calculated at 23.67%, 24.80% and 21.60% of all detections respectively. Analysis of ESAS data by Kober et al. (2010, 2012) indicated the outer Firth of Forth is likely to be most important for kittiwakes during the breeding season. The total count of kittiwakes within the foraging range (mean max distance +1 sd from Woodward et al. 2019) of the Project approximates the regional population and is estimated at 319,126 breeding adults.
- Egg-laying typically occurs between May and early June (Coulson, 2011); and this is reflected in decreased kittiwake abundance in the Offshore Ornithology Study Area as adult birds are in attendance at colonies. Chicks hatch through June and July and rearing continues until juveniles fledge six weeks later. Use of the Offshore Ornithology Study Area whilst foraging may occur during chick-rearing, but generally the highest abundances were recorded in late summer, such as in August 2019 and August/September 2020, coupled with high proportions of juvenile birds at this time ( Table 5.3 Open ▸ ; Table 5.8 Open ▸ ). These results indicate that the Offshore Ornithology Study Area is primarily used by post-fledging kittiwakes before dispersal to wintering areas. High incidence of kittiwakes within the breeding season is also consistent with data collected during the IMPRESS project (Camphuysen, 2005). Relatively high abundance recorded in March 2019 may be attributed to the movement of birds to breeding colonies prior to egg laying.
- Mean seasonal peak population estimates indicate the Offshore Ornithology Study Area is important for the species during the non-breeding season, with design-based analysis estimating approximately 50,958 birds (95%CI 35,530 – 69,349) ( Table 5.6 Open ▸ ). Mean-peak estimates for the breeding season remain high, calculated at 36,189 birds (95%CI 24,774 – 49,254). Relatively high abundances right after the breeding season (e.g. September 2020) are likely to have led to the non-breeding mean seasonal peak, with abundance being generally low throughout this period until the start of the breeding season.
- Behaviour differed between seasons ( Figure 5.6 Open ▸ ), with the largest proportions of flying birds generally occurring between April and June, and October and December dependent on year. These peaks in flying activity generally coincided with the start and end of the breeding season, with a peak of 86% (197 birds) recorded flying in November 2019. Large proportions of birds were recorded as sitting on the water in most surveys, indicative of recent feeding activity, suggesting the Offshore Ornithology Study Area is used for foraging year-round. The highest proportions of sitting birds generally occurred in spring and mid to late summer, coinciding with the breeding season. This reaffirms the possibility that birds are congregating in the area prior to the breeding season and may be feeding in the area during or after chick-rearing. High proportions of sitting birds (75%) were also recorded in February 2021.
- The largest average proportion of juveniles (11% of aged birds) coincided with the non-breeding period; the same was true for immature birds (7% of aged birds; Table 5.8 Open ▸ ).
- Flight direction varied considerably between months and bio-seasons ( Figure 5.5 Open ▸ ). In September 2020, when the highest densities of kittiwakes were estimated, birds primarily flew southwest, however, in March 2019 when high densities were also present, many kittiwakes also flew southwards. In April S01 2021, many birds flew north and south, with few birds flying east or west.
Table 5.2: Kittiwake bio-seasons taken from NatureScot (2020a)
Table 5.3: Monthly density and population estimates of all kittiwakes across the Offshore Ornithology Study Area using design-based analysis. Data include “no-identification” birds apportioned to species
Table 5.6: Mean seasonal peak (MSP) population and density (birds/km2) of all kittiwakes in the Offshore Ornithology Study Area across the two years of surveying (March 2019 to April 2021) estimated using design-based analysis. Data include “no-identification” birds apportioned to species
Table 5.7: Mean seasonal peak (MSP) population and density (birds/km2) of all kittiwakes in the Berwick Bank Development Array plus 2km buffer across the two years of surveying (March 2019 to April 2021) estimated using design-based analysis. Data include “no-identification” birds apportioned to species
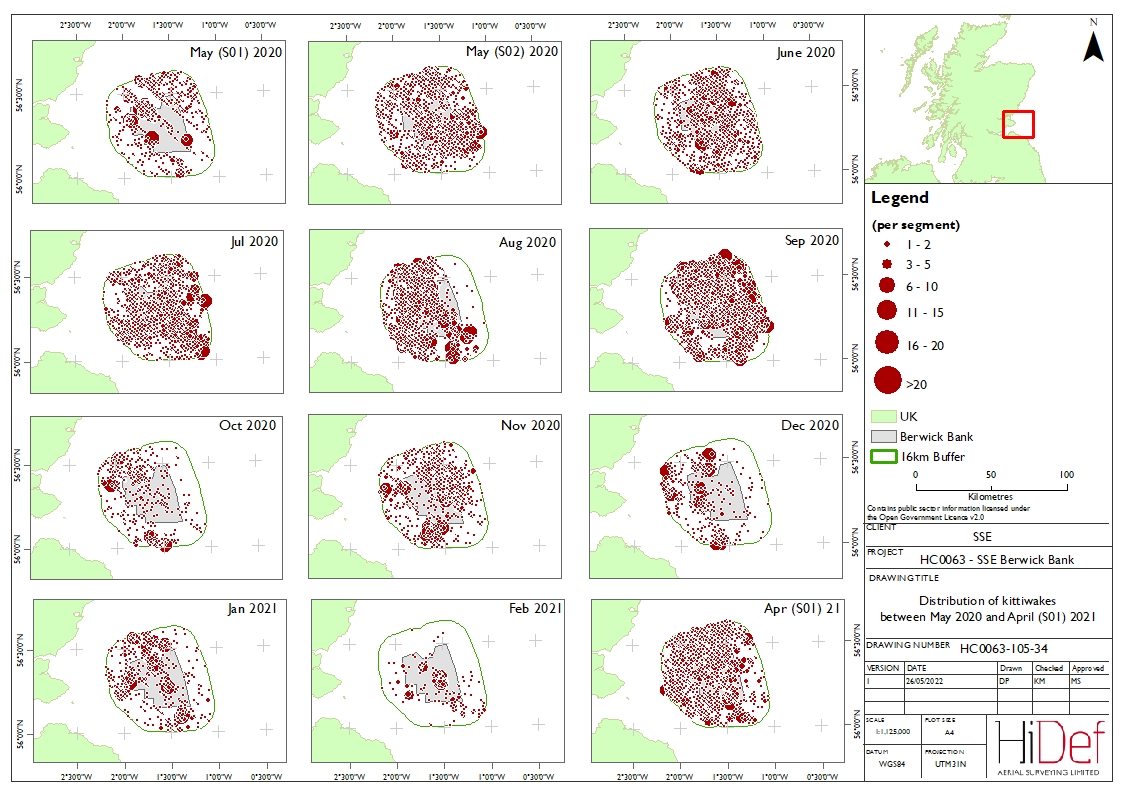
Figure 5.4: Distribution of kittiwakes across the Offshore Ornithology Study Area in April S02 2021
Table 5.8: Mean count, SD and proportion of kittiwakes in each age class averaged across bio-season
Figure 5.5: Summarised flight direction of kittiwakes across the Offshore Ornithology Study Area
![]()

![]()

Figure 5.6: Percentage of flying kittiwakes per survey across the Offshore Ornithology Study Area
5.2. Guillemot
5.2. Guillemot
- One of the most abundant seabird species in the northern hemisphere, in the breeding season, guillemots are generally found in coastal colonies consisting of up to tens of thousands of individual birds (Mitchell et al., 2004). Typically, only coming to coastal areas to breed, most birds move offshore during the non-breeding season (Wernham et al., 2002). As pursuit divers, guillemots generally feed on schooling fish such as cod and sprat (Gaston and Jones 1998), however this is likely to differ depending on local feeding conditions (Merkel, 2019). Large breeding colonies in proximity to the Offshore Ornithology Study Area are present on the Isle of May and St Abb’s Head with approximately 18,705 and 42,905 individuals recorded in 2018 respectively (SMP, 2021). The species is currently Amber-listed on the UK Birds of Conservation Concern List (Stanbury et al., 2021).
- Guillemots were the most abundant species recorded in the Offshore Ornithology Study Area during the survey programme, with birds recorded most frequently between April and May and August and/or September in both years, coinciding with the start of the breeding season and the post-breeding flightless moult stage ( Table 5.10 Open ▸ ). Evidence suggests guillemots may be present in large aggregations post-breeding along the east coasts of Scotland and England, coinciding with high local prey abundance (Furness, 2015). Aggregations are likely to be highly dependent on prey availability, lasting only two to three weeks. Movement down the east coast of Scotland from the northern North Sea during post-breeding migration and dispersal has also been indicated (Figure 21.3; Furness, 2015), with spring migration expected to occur in the opposite direction (movement of breeding birds northwards along the Scottish east coast). Density estimates produced using design-based methods ranged between 2.12 birds/km2 (95%CI 1.35 – 3.22; November 2019) and 60.88 birds/km2 (95%CI 47.69 – 76.93; April S02 2021) over the entire survey period, when adjusted for availability bias.
- Peak population estimates in April S02 2021 equated to 242,168 birds (95%CI 190,509 – 305,941). The total count of guillemots at SPAs within foraging range (mean max distance +1 sd from Woodward et al. 2019) of the Project approximates the regional population and is estimated at 353,971 breeding adults. There are other large colonies, such as the 148,805 breeding adults at North Caithness Cliffs SPA, which may also frequent the Firth of Forth region based on modelled tagging data (Wakefield et al. 2017, 2019). The relatively high abundance estimated for the site in April S02 2021 is likely to be explained by a good breeding season in 2020 (supported by our data for September 2020 and NatureScot, 2021), which as a consequence will lead to a high number of birds returning to the area ahead of the following 2021 breeding season. As the most recent SPA counts used were from 2014 to 2019, except for Forth Islands SPA which includes counts up to 2021, the successful breeding season observed in 2020 will not be reflected in the SPA estimated totals for guillemot. A pattern emerges where the number of birds seen in March/April is predicated (to a large extent) by the success of the breeding season in the previous year; this pattern is seen in the Year 1 data, where the breeding/post breeding peak abundance estimates are lower (August 19) than the pre/breeding season return of guillemot to the area to access the colonies the following year (May SO1 20 as “April”).
- Data collected from boat-based surveys of the Berwick Bank and Seagreen in 2020 and 2021 also recorded an abundance of guillemots, with the species making up the largest proportion of all recorded birds (32.09%, 28.10% and 29.30% respectively). Camphuysen et al. (2004) reported a decline in breeding success within the outer Firth of Forth between 1997 and 2003. However, since 2007, this trend has reversed and breeding success recovered to a high level in the 2010s (Harris et al., 2017).
- Overall, guillemots were recorded in higher densities in Year 2 compared to Year 1, with design-based density estimates ranging between 2.12 birds/km2 (95%CI 1.35 – 3.22) and 40.26 birds/km2 (95%CI 27.91 – 54.40) in 2019/20 compared to 4.82 birds/km2 (95%CI 3.74 – 5.92) and 60.88 birds/km2 (95%CI 47.89 – 76.93) in 2020/21. After the post-breeding peak, abundance declines substantially, likely due to dispersal offshore to the North Sea after chick-rearing (Wernham et al., 2002; Forrester et al., 2007). When accounting for availability bias, estimates of density were higher during the breeding season, with mean peak densities for the region estimated at 46.91 birds/km2 (95%CI 37.98 – 57.83), compared to 34.88 birds/km2 (95%CI 27.41 – 43.02) during the non-breeding season ( Table 5.13 Open ▸ ).
- High guillemot abundance in the breeding season coincides with the onset of egg-laying and incubation (Harris and Wanless, 2004). During this time, most birds were recorded as sitting on the water, which is to be expected considering their feeding strategy of diving from the water surface. A high proportion of sitting birds were also observed during the secondary peaks between August and September, likely due to the presence of many flightless adult birds which moult after the chick-rearing period (Brown and Grice, 2005). As expected, extremely low percentages of flying birds were present within the population at this time ( Figure 5.12 Open ▸ ) and consequently a lack of flight direction data for guillemots in August and September in both 2019 and 2020 ( Figure 5.11 Open ▸ ).
- Overall, flight direction data indicated guillemots generally flew in easterly and westerly directions such as in March 2019 and between March and May 2020, with May 2019 being the only month in which a large proportion of birds flew south ( Figure 5.12 Open ▸ ). Movement east and west may be attributed to adult birds moving between nest sites to the west of the Offshore Ornithology Study Area such as the Isle of May and Craigleith and foraging grounds further offshore in the outer Firth of Forth and North Sea (Furness, 2015).
- Ages of birds are not presented for this species since adults can only be aged when in the presence of a juvenile for size comparison, and they almost exclusively occur as single adult-chick pairs.
Table 5.9: Guillemot bio-seasons taken from NatureScot (2020a)
Table 5.10: Monthly absolute density and population estimates of all guillemots across the Offshore Ornithology Study Area using design-based analysis, adjusted for availability bias. Data include “no-identification” birds apportioned to species
Table 5.13: Mean seasonal peak (MSP) population and density (birds/km2) of all guillemots in the Offshore Ornithology Study Area across the two years of surveying (March 2019 to April 2021) estimated using design-based analysis, with figures adjusted for availability bias. Data include “no-identification” birds apportioned to species
Figure 5.10: Distribution of guillemots across the Offshore Ornithology Study Area in April S02 2021
Figure 5.11: Summarised flight direction of guillemots across the Offshore Ornithology Study Area

![]()

Figure 5.12: Percentage of flying guillemots per survey across the Offshore Ornithology Study Area
5.3. Razorbill
5.3. Razorbill
- Common around the UK, razorbills are distributed at coastal colonies between April and August during the breeding season, usually found in mixed species assemblages with other seabirds such as guillemots and kittiwakes (Mitchell et al., 2004). The northwest North Sea provides important habitat for razorbills year-round, especially between July and September during the flightless moult period (Stone et al., 1995). Several large breeding colonies are present along the east coast of Scotland, such as the Isle of May, St Abb’s Head and Fowlsheugh which respectively supported an estimated 4,867, 2,683 and 11,750 birds in 2018 (SMP, 2021). The total count of razorbills within the foraging range (mean max distance +1 sd from Woodward et al.2019) of the Project approximates the regional population and is estimated at 84,501 breeding adults. The species is currently Amber-listed on the UK Birds of Conservation Concern List (Stanbury et al., 2021).
- Razorbills were present in relatively high abundances in the Offshore Ornithology Study Area, with birds recorded most frequently in October and September in Year 1 and Year 2 respectively, during the non-breeding season ( Table 5.16 Open ▸ ). When accounting for availability bias. Design-based estimates gave densities ranging from 0.37 birds/km2 (95%CI 0.22 – 0.56) to 3.21 birds/km2 (95%CI 1.51 – 5.39) in 2019/20 and 0.50 birds/km2 (95%CI 0.34 – 0.66) to 13.77 birds/km2 (95%CI 9.66 – 17.91) in 2020/21 ( Table 5.16 Open ▸ ).
- Boat-based surveys of Berwick Bank in 2020-2021 identified razorbill as one of the key five species, which collectively accounted for 87% of all observations, of which razorbill accounted for 9.68% of all records. Data from the IMPRESS project (Camphuysen et al., 2004) reported that razorbills accounted for 11% of all observations. However, razorbills were not identified as a predominant species in Seagreen boat-based surveys.
- Mean seasonal peaks were higher during the non-breeding period with an estimated population of 35,589 birds (95%CI 25,185 – 46,150; Figure 5.13 Open ▸ ). Estimates during the breeding season were much lower, calculated at 11,280 birds (95%CI 8,395 – 14,646). During the non-breeding season when abundance of razorbills peaked, their distribution was towards the west of the Offshore Ornithology Study Area ( Figure 5.14 Open ▸ - Figure 5.16 Open ▸ ).
- Low abundances during the summer suggests most birds at nearby colonies do not venture into the Offshore Ornithology Study Area to forage during chick-rearing but do disperse through the Offshore Ornithology Study Area in the post-breeding period, as indicated by increases in abundance towards the end of the breeding season, such as in August and September 2020 ( Figure 5.13 Open ▸ ). Adults usually undergo a post-breeding moult around July and August, prior to movement offshore into the North Sea, which is estimated to support around 100,000 wintering razorbills (Furness, 2015). Younger age classes generally disperse further than older birds, with adults returning to colonies sooner than immature birds prior to the start of the breeding period (Furness, 2015).
- Across all seasons, most razorbills were recorded as sitting on the water, with few birds recorded as flying during the 25 months of surveys. This is to be expected considering their feeding strategy which involves diving from the surface of the water (Shoji et al., 2015). In Year 1, the highest percentage of flying birds was recorded in March during the return migration period, with a similar peak occurring in Year 2 (although to a lesser extent; Figure 5.18 Open ▸ ). In Year 2, the percentage of flying birds peaked in October and April S01, in the non-breeding and breeding seasons respectively.
- The paucity of flying birds during the programme presented difficulties when assessing trends in flight direction, although many birds were recorded flying west in March 2019 and a large proportion also flew south in April S01 2021 ( Figure 5.17 Open ▸ ). It is possible that this may be the migration of birds back to breeding colonies to the west and south of the survey area, such as the Isle of May and St. Abb’s Head.
- Ages of razorbills are not presented since adults can only be aged when in the presence of a juvenile for size comparison and they almost exclusively occur as single adult-chick pairs.
Table 5.15: Razorbill bio-seasons taken from NatureScot (2020a)
Table 5.16: Monthly absolute density and population estimates of all razorbills across the Offshore Ornithology Study Area using design-based analysis, adjusted for availability bias. Data include “no-identification” birds apportioned to species
Figure 5.13: Estimated absolute densities (birds/km2) of all razorbills across the Offshore Ornithology Study Area using design-based analysis, accounting for availability bias. Data include “no-identification” birds apportioned to species
Figure 5.14: Distribution of razorbills across the Offshore Ornithology Study Area between March 2019 and March 2020
Figure 5.16: Distribution of razorbills across the Offshore Ornithology Study Area in April S02 2021
Figure 5.17: Summarised flight direction of razorbills across the Offshore Ornithology Study Area
![]()
![]()


Figure 5.18: Percentage of flying razorbills per survey across the Offshore Ornithology Study Area
5.4. Puffin
5.4. Puffin
- A small auk species, puffins are most abundant in UK waters during the spring and summer, dispersing mainly westwards from early autumn into the winter. In the UK they nest in a few major colonies and are Red-listed on the UK Birds of Conservation Concern list (Stanbury et al., 2021), following a listing as a vulnerable species on the ICUN Red List. A large breeding colony is present on the Isle of May, with the most recent count of 39,200 Apparently Occupied Burrows in 2017 (AOB’s; SMP, 2021). Usually only present in coastal areas during the breeding season, puffins generally return to colonies between March and April, with egg laying occurring in April and May (Harris et al., 2010). Typically, adult birds return to the same burrow year-on-year, raising one chick which generally fledges between July and August (Anker-Nilssen and Røstad, 1993; Finney et al., 2003).
- After adjusting for availability bias, density and population estimates suggest the species utilise the Offshore Ornithology Study Area predominantly between March and September which is largely coincident with the breeding season ( Figure 5.19 Open ▸ ). When accounting for availability bias, design-based density estimates ranged from 0.00 birds/km2 to 3.84 birds/km2 (95%CI 2.93 – 4.92) in 2019/20 and 0.03 birds/km2 (95%CI 0.02 – 0.05) to 8.81 birds/km2 (95%CI 7.43 – 10.17) in 2020/21. Mean seasonal peak abundance was higher in the non-breeding season, with an estimated population 20,667 birds (95%CI 17,298 – 24,031) compared to 12,290 birds (95%CI 9,857 – 14,997) in the breeding season.
- Data collected during boat-based surveys of Berwick Bank reported that puffins accounted for 7.26% of all observations. The IMPRESS project (Camphuysen et al., 2004) suggested puffins were likely to be numerous within the outer Firth of Forth, with the species accounting for 21% of all observations. The total count of puffins at SPAs within the foraging range (mean max distance +1 sd from Woodward et al. 2019) of the Project approximates the regional population and is estimated at 233,550 breeding adults.
- High abundance during summer months suggests birds at nearby colonies use the Offshore Ornithology Study Area to forage during chick-rearing. Mapped observations indicate varied use of the Offshore Ornithology Study Area, but with a more westerly distribution in the Offshore Ornithology Study Area during the breeding season ( Figure 5.20 Open ▸ - Figure 5.22 Open ▸ ). High densities in the west of the Offshore Ornithology Study Area in months such as June and July 2019, July 2020 and April 2021, suggest many birds use areas closer to colonies and chicks during this time. More widespread dispersal towards the end of the chick-rearing period, such as in September 2020, suggests movement of birds offshore, with elevated densities also observed to the east of the Offshore Ornithology Study Area in September 2019. Offshore movement of birds following the breeding season is expected, since the species usually overwinters at sea; the North Sea hosts significant concentrations of the species during winter months (Harris, 1984; Jessop et al., 2013).
- Across all seasons, most birds were recorded as sitting on the water, with few birds recorded as flying during the 25 months of surveys ( Table 5.23 Open ▸ ). In Year 1, peaks in flying birds were observed in June, with about 6% of birds recorded as flying, however in Year 2 peaks occurred in March and June, with approximately 29% and 17% of birds recorded as flying respectively (Figure 5.25). High proportions of sitting birds are to be expected considering the feeding strategy adopted by the species as pursuit-divers diving from the water surface (Cramp and Simmons, 1983). Typical prey species are small to mid-sized schooling pelagic fish, including sandeels and sprats, supplemented by crustaceans, molluscs and polychaetes during the breeding season (del Hoyo et al., 1996). Considerable differences in diet between colonies and years has been identified, with sub-optimal prey species negatively affecting fledgling growth in some cases (Harris and Hislop, 1978).
- The paucity of flying birds during the programme presented difficulties when assessing trends in flight direction, although many birds were recorded flying west in June 2019 and June and July 2020. Some birds were also recorded flying north and southeast in July 2019 and July 2020 respectively ( Figure 5.23 Open ▸ ).
- Ages of birds are not presented for the species since adults can only be aged when in the presence of a juvenile for size comparison and they occur almost always as single adult-chick pairs.
Table 5.21: Puffin bio-seasons taken from NatureScot (2020a)
Table 5.23: Monthly density and population estimates of flying puffins only across the Offshore Ornithology Study Area using design-based analysis. Data include “no-identification” birds apportioned to species
Figure 5.19: Estimated absolute densities (birds/km2) of all puffins across the Offshore Ornithology Study Area using design-based analysis, accounting for availability bias. Data include “no-identification” birds apportioned to species
Figure 5.20: Distribution of puffins across the Offshore Ornithology Study Area between March 2019 and March 2020
Figure 5.22: Distribution of puffins across the Offshore Ornithology Study Area in April S02 2021
Figure 5.23: Summarised flight direction of puffins across the Offshore Ornithology Study Area
![]()
![]()

![]()

Figure 5.24: Percentage of flying puffins per survey across the Offshore Ornithology Study Area
5.5. Gannet
5.5. Gannet
- As the largest pelagic seabird in the North Atlantic, gannets have considerable influence on marine food chains, preying on various fish species and competing with other seabird species for discards from commercial fisheries (Hamer et al., 2000). It is likely that fisheries discards currently make up a much smaller percentage of the diet than previously, following the discard ban in 2015 which was fully implemented in 2019 (Ulhmann et al., 2019). Typical prey includes pelagic fish such as mackerel and sandeel, the latter species being abundant within the Firth of Forth and North Sea (Greenstreet et al., 2010). Gannet distribution and abundance is likely to be influenced by prey availability (Furness and Tasker, 1999) although its sensitivity to sandeel abundance is less than for other species such as kittiwake because of the greater variety of prey species it exploits (Daunt et al., 2008; B. Furness, pers. comms., 2021). The nearest gannetry is the Bass Rock in the Firth of Forth, which is the world’s largest colony with 75,259 Apparently Occupied Sites (AOS) recorded in 2014 (Murray et al., 2014; SMP, 2021). The species is currently Amber-listed on the UK Birds of Conservation Concern List (Stanbury et al., 2021).
- Gannets were most abundant in the Offshore Ornithology Study Area in the breeding season. Design-based analysis estimated gannet density to range between 0.00 birds/km2 (95%CI 0.00 – 0.01; February 2020) and 4.06 birds/km2 (95%CI 3.42 – 4.79; August 2019) in 2019/20 and 0.05 birds/km2 (95%CI 0.02 – 0.09; February 2021) and 3.27 birds/km2 (95%CI 2.88 – 3.68; July 2020) in 2020/21. Densities peaked in August and July in Year 1 and Year 2 respectively, coinciding with the breeding season ( Table 5.28 Open ▸ ).
- Gannets were frequently encountered within the Offshore Ornithology Study Area and wider area during other studies of the outer Firth of Forth (Camphuysen et al., 2004; Kober et al. 2010, 2012; Lane et al. 2020). WWT Waterbird surveys also indicated high gannet abundance, although the survey block was located approximately 20km from the Offshore Ornithology Study Area. Gannets were identified as a key species during boat-based surveys of Seagreen between 2009-2011 (accounting for 16.10% and 16.60% of all observations respectively) and Berwick Bank between 2019-2020 (accounting for 16.12% of all observations). The total count of gannets within the foraging range (mean max distance +1 sd from woodward et al. 2019) of the Project is estimated at 323,836 breeding adults.
- Mean seasonal peak density calculated for the breeding season was 3.66 birds/km2 (95%CI 3.15 – 4.24), equating to a population of 14,581 birds (95%CI 12,528 – 16,840) ( Table 5.31 Open ▸ ). High densities are to be expected within the Offshore Ornithology Study Area, due to the proximity to Bass Rock where breeding success of gannets has been consistently high, despite fluctuations in breeding success for other seabird species in the vicinity (Nelson, 2006; Hamer et al., 2007).
- Following peaks in abundance in the breeding season, gannet abundance in the Offshore Ornithology Study Area declined steadily until December 2019 in Year 1 and until October and November 2020 in Year 2 ( Table 5.28 Open ▸ ) Fluctuations in abundance later in the year may be attributed to fledgling birds leaving nests and spending time at sea (Nelson, 1966).
- Distribution of gannets varied between months, with a tendency for a north-westerly distribution within the Offshore Ornithology Study Area during the breeding season (e.g., between August and September in both years). Generally, in both Year 1 and Year 2, it appeared that higher densities of gannets were more widespread throughout the Offshore Ornithology Study Area during the breeding season compared to the non-breeding season, such as in December 2019 and November 2020 specifically.
- Of the birds that could be aged, most were recorded as adults ( Table 5.33 Open ▸ ). Few young birds were observed in the Offshore Ornithology Study Area with the highest proportions of immature birds (2% of aged birds) and juvenile birds (2% of aged birds) occurring in the non-breeding period.
- Within the breeding season, particularly between June and August, proportions of gannets recorded as flying and sitting on the water were broadly similar, suggesting the Offshore Ornithology Study Area is used during foraging and during passage to foraging grounds further afield. Peaks in the percentage of flying birds were observed in September in both survey years (). Flexibility in diet and foraging behaviour and duration is likely linked to the species success in the North Sea (Hamer et al., 2007). During the return migration period, proportions of sitting and flying birds were more variable.
- Flight direction was variable, with many birds flying in easterly and westerly directions, such as in August 2019 and July 2020 ( Figure 5.29 Open ▸ ). The presence of the Bass Rock to the southwest of the Offshore Ornithology Study Area may explain the abundance of eastwards and westwards flight, since many birds travel from this colony to foraging grounds further offshore in the North Sea.
Table 5.27: Gannet bio-seasons taken from NatureScot (2020a)
Table 5.28: Monthly density and population estimates of all gannets across the Offshore Ornithology Study Area using design-based analysis. Data include “no-identification” birds apportioned to species
Table 5.31: Mean seasonal peak (MSP) population and density (birds/km2) of all gannets in the Offshore Ornithology Study Area across the two years of surveying (March 2019 to April 2021) estimated using design-based analysis. Data include “no-identification” birds apportioned to species
Figure 5.28: Distribution of gannets across the Offshore Ornithology Study Area in April S02 2021
Table 5.33: Mean count, SD and proportion of gannets in each age class averaged across bio-season
Figure 5.29: Summarised flight direction of gannets across the Offshore Ornithology Study Area
![]()

![]()

Figure 5.30: Percentage of flying gannets per survey across the Offshore Ornithology Study Area
5.6. Common scoter
5.6. Common scoter
- Typically present in coastal environments, common scoters spend much of their time at sea in large flocks, migrating inland to freshwater environments to breed, such as those located in Caithness and Sutherland between May and July (del Hoyo et al., 1992). Outwith the breeding season, scoters typically utilise shallow marine environments, feeding on various invertebrate, mollusc and gastropod species (Fox, 2003). The species is currently Red-listed on the UK Birds of Conservation Concern List (Stanbury et al., 2021).
- Common scoters were present in June 2019 (technically in the breeding period) and presumably non-breeding birds were encountered in January 2020 ( Table 5.35 Open ▸ ; Figure 5.31 Open ▸ ). There are no breeding locations for common scoter within mean max foraging range of Berwick Bank. Estimated densities from design-based analysis were low, with population estimates for the Offshore Ornithology Study Area ranging between 9 birds (95%CI 0 – 28) in January 2020 and 16 birds (95%CI 0 – 48) in June 2019.
- Within the two surveys in which common scoter were observed in the Offshore Ornithology Study Area, all birds were recorded as flying. In June 2019, all birds flew in a southeast direction while in January 2020 all birds flew north ( Figure 5.33 Open ▸ ). It is likely that the species primarily pass through the Offshore Ornithology Study Area during passage to other areas.
- Common scoters were detected in similar parts of the Offshore Ornithology Study Area, in the western buffer ( Figure 5.32 Open ▸ ). Since the west of the Offshore Ornithology Study Area is closer to the coast, this distribution is not unexpected.
- The apparent higher estimates for flying birds compared to all birds (see Table 5.35 Open ▸ and Table 5.36 Open ▸ ) are simply due to different iterations of the bootstrapping analysis process and rounding.
Table 5.34: Common scoter bio-seasons taken from NatureScot (2020a)
Table 5.35: Monthly density and population estimates of all common scoter across the Offshore Ornithology Study Area using design-based analysis. Data include “no-identification” birds apportioned to species
Table 5.36: Monthly density and population estimates of flying common scoter only across the Offshore Ornithology Study Area using design-based analysis. Data include “no-identification” birds apportioned to species
Figure 5.31: Estimated densities (birds/km2) of all common scoter across the Offshore Ornithology Study Area using design-based analysis. Data include “no-identification” birds apportioned to species
Figure 5.32: Distribution of common scoter across the Offshore Ornithology Study Area in June 2019 and January 2020
Figure 5.33: Summarised flight direction of common scoter across the Offshore Ornithology Study Area
5.7. Black-headed gull
5.7. Black-headed gull
- Black-headed gulls are distributed throughout Scotland, primarily on the east and south-west coasts (Forrester et al., 2007). As well as birds arriving from elsewhere in the UK, many black-headed gulls migrate from northern and eastern Europe (Horton et al., 1983). Relatively large flocks of wintering birds have been observed within the Firth of Forth, such as at Skinflats and the Isle of May, located to the west of the survey area (Forrester et al., 2007). The species is currently Amber-listed on the UK Birds of Conservation Concern.
- Black-headed gulls were uncommon in Offshore Ornithology Study Area, and were only recorded during the non-breeding season ( Table 5.40 Open ▸ ) with a mean seasonal peak population estimated at 9 birds (95%CI 1 – 24) and a density of 0.00 birds/km2 ( Table 5.43 Open ▸ ).
- Digital aerial survey data presented here is consistent with existing data from the outer Firth of Forth region which suggests the species is typically present in low numbers in the non-breeding season. Data summed from ESAS surveys conducted between 1980 and 1996 clipped to the Offshore Ornithology Study Area recorded only two black-headed gulls in the 16-year period. In addition, boat-based surveys of Seagreen only recorded one individual.
- Most black-headed gulls identified within the Offshore Ornithology Study Area were recorded as flying, with mean peak population estimates for the non-breeding season estimated at 8 birds (95%CI 0 – 20) and 2 birds (95%CI 0 – 4) for flying and sitting birds respectively ( Table 5.41 Open ▸ and Table 5.42 Open ▸ ).
- Black-headed gulls were distributed to the west of the Offshore Ornithology Study Area, in the south and west buffer in September and December 2020 respectively ( Figure 5.35 Open ▸ ).
- As so few birds were present in the Offshore Ornithology Study Area, it was difficult to draw reliable conclusions regarding flight direction ( Figure 5.36 Open ▸ )
Table 5.39: Black-headed gull bio-seasons taken from NatureScot (2020a)
Table 5.40: Monthly density and population estimates of all black-headed gulls across the Offshore Ornithology Study Area using design-based analysis. Data include “no-identification” birds apportioned to species
Table 5.41: Monthly density and population estimates of flying black-headed gulls only across the Offshore Ornithology Study Area using design-based analysis. Data include “no-identification” birds apportioned to species
Table 5.42: Monthly density and population estimates of sitting black-headed gulls only across Offshore Ornithology Study Area using design-based analysis. Data include “no-identification” birds apportioned to species
Table 5.43: Mean seasonal peak (MSP) population and density (birds/km2) of all black-headed gulls in the Offshore Ornithology Study Area across the two years of surveying (March 2019 to April 2021) estimated using design-based analysis. Data include “no-identification” birds apportioned to species
Figure 5.35: Distribution of black-headed gulls across the Offshore Ornithology Study Area in September and December 2020
Figure 5.36: Summarised flight direction of black-headed gulls across the Offshore Ornithology Study Area
5.8. Little gull
5.8. Little gull
- As passage migrants, little gulls spend part of the year in UK waters as they move between summer and wintering grounds (Stone et al., 1995). The smallest gull species in the UK (Dunning, 1992), they generally migrate to UK coastal environments for the non-breeding period (Forrester et al., 2007). Post-breeding adult birds usually arrive in Scotland from Europe between late July and August, followed by juvenile birds, observed in the highest concentrations along the Angus and Dundee coast (Forrester et al., 2007), which is to the north of the Offshore Ornithology Study Area. A secondary influx generally occurs between October and November, mainly consisting of adult and first-winter birds (Forrester et al., 2007). The Outer Firth of Forth and St Andrews Bay Complex SPA, which overlaps the southwest corner of the Offshore Ornithology Study Area, was designated to support non-breeding populations of little gulls among other seabird species, suggesting the presence of suitable habitat within the SPA area.
- Little gulls were observed in the Offshore Ornithology Study Area during the breeding and non-breeding seasons, with no records between March and June in either Year 1 or Year 2 ( Table 5.46 Open ▸ ). Peak abundances were recorded in August 2019 and 2020 with a lesser peak occurring in both years, in February 2020 and December 2020 respectively. Design-based density estimates ranged between 0.00 birds/km2 and 0.03 birds/km2 (95%CI 0.01 – 0.06) in 2019/20 compared to 0.00 birds/km2 and 0.11 birds/km2 (95%CI 0.06 – 0.16) in 2020/21.
- Boat-based surveys of Berwick Bank in 2019-2020 recorded one little gull, present in the June 2021 survey.
- During the non-breeding season, most birds were recorded as flying, with only 15% of birds recorded as sitting on the water. Feeding strategy adopted by little gulls is variable, with individuals either feeding while inflight, or picking food items from the water’s surface (Vittery, 2001). The presence of sitting birds within the Offshore Ornithology Study Area suggests the area may be utilised during foraging.
- Little gulls were distributed throughout the Offshore Ornithology Study Area. In some months, birds were distributed only in the buffer, such as in July 2019 and September 2020 ( Figure 5.38 Open ▸ to Figure 5.40 Open ▸ ). Many little gulls were recorded within the Proposed Development Array area in August 2020 and April S02 2021. Birds were recorded in the south of the Offshore Ornithology Study Area in September 2020 and January 2021 compared to the northwest in December 2020.
- No flight direction data were available for this species.
Table 5.45: Little gull bio-seasons taken from NatureScot (2020a)
Table 5.46: Monthly density and population estimates of all little gulls across the Offshore Ornithology Study Area using design-based analysis. Data include “no-identification” birds apportioned to species
Figure 5.38: Distribution of little gulls across the Offshore Ornithology Study Area between March 2019 and March 2020
Figure 5.40: Distribution of little gulls across the Offshore Ornithology Study Area in April S02 2021
Table 5.50: Mean count, SD and proportion of little gulls in each age class averaged across bio-season
![]()

![]()

Figure 5.42: Percentage of flying little gulls per survey across the Offshore Ornithology Study Area
5.9. Common gull
5.9. Common gull
- Common gulls are relatively abundant throughout Europe, with over 50% of the global breeding population concentrated in the northern regions of Europe (Tasker, 1994). Over winter, the UK hosts almost half the European population of common gulls (European Commission, 2009), with many of these birds occurring in Scottish coastal areas (Burton et al., 2013). Generally, lower numbers of common gulls are present during the breeding period, distributed in inland areas (Bukaciński and Bukacińska, 2003). The species is generally long-lived, with recruits starting to breed after 2-5 years (Rattiste, 2006). The species is currently Amber-listed on the UK Birds of Conservation Concern List (Stanbury et al., 2021).
- Common gulls were primarily recorded in the Offshore Ornithology Study Area during the non-breeding season in both years, with abundance peaking in December 2020 at 982 birds (95CI 232-1934) ( Table 5.52 Open ▸ ). During the breeding season, abundance peaked in July 2019 and August 2020, equating to design-based population estimates for the Offshore Ornithology Study Area of 33 birds (95%CI 1 – 70) and 180 birds (95%CI 112 – 261) respectively (Table 5.60). Design-based density estimates ranged between 0.00 birds/km2 and 0.13 birds/km2 (95%CI 0.05 – 0.22) in 2019/20 compared to 0.00 birds/km2 and 0.25 birds/km2 (95%CI 0.06 – 0.49) in 2020/21.
- Boat-based surveys of Berwick Bank recorded low numbers of common gulls between July and August 2019 and April and June 2020. The species was not highlighted as a key species in any of the other data sources included in the desktop study, with the species expected to be present in low numbers during the non-breeding season.
- Although some birds were recorded in the Offshore Ornithology Study Area during the breeding season, this only comprised around 16% of the total common gulls recorded during the two-year period. This is to be expected, since the species is known to breed in inland areas such as moorland and heaths, utilising coastal areas during the winter (Tasker et al., 1991). Across the entire survey programme, most birds were recorded as flying, with only 23% of birds recorded as sitting on the water. In October 2019 and December 2020 when abundance peaked, 94% and 70% of birds were recorded as flying respectively. The relatively low proportion of birds recorded as sitting on the water suggests that the area is not utilised much during foraging, but instead used during passage to and from wintering areas.
- Flight direction was variable, with birds recorded flying in easterly and westerly directions in November 2019 and December 2020 ( Figure 5.47 Open ▸ ).
- Generally, common gulls were distributed to the northwest of the Offshore Ornithology Study Area, with many birds in the western buffer, such as between October and December 2019. Very low abundances were also recorded within the Proposed Development array area. In December 2020, when abundances peaked, many birds were recorded in the northwest and west of the buffer, with a few also present in the south.
Table 5.51: Common gull bio-seasons taken from NatureScot (2020a)
Table 5.52: Monthly density and population estimates of all common gulls across the Offshore Ornithology Study Area using design-based analysis. Data include “no-identification” birds apportioned to species
Figure 5.46: Distribution of common gulls across the Offshore Ornithology Study Area April S02 2021
![]() Figure 5.47: Summarised flight direction of common gulls across the Offshore Ornithology Study Area
Figure 5.47: Summarised flight direction of common gulls across the Offshore Ornithology Study Area
![]()

![]()

Figure 5.48: Percentage of flying common gulls per survey across the Offshore Ornithology Study Area
5.10. Herring gull
5.10. Herring gull
- The Firth of Forth is known to support one of the largest coastal roosting populations of herring gulls in Scotland (NatureScot, 2020b). Many wintering herring gulls present along the east coast of Scotland are migrants from further afield, such as Norway and north Russia, boosting local populations between September and February (Wernham et al., 2002; Furness, 2015). Generally, the species uses inshore areas primarily for roosting, although foraging in intertidal areas is also likely to occur (Rome and Ellis, 2004). The species is currently Red-listed on the UK Birds of Conservation Concern List (Stanbury et al., 2021).
- Herring gulls were the most abundant large gull species in the Offshore Ornithology Study Area during the survey period, present in relatively moderate densities from mid to late summer and again in winter. Few birds were present throughout the rest of the year. This pattern occurred in both years of surveys, with an overall greater abundance of birds in the second year. Design-based density estimates ranged between 0.00 birds/km2 (95%CI 0.00 – 0.01) and 0.51 birds/km2 (95%CI 0.34 – 0.73) in 2019/20 compared to 0.00 birds/km2 (95%CI 0.00 – 0.01) and 1.28 birds/km2 (95%CI 0.39 – 2.29) in 2020/21 (
- Table 5.58 Open ▸ ). Mean-peak population estimates were similar in the non-breeding season, calculated at 3,382 birds (95%CI 957 – 6,294), compared to 3,356 (95%CI 2,246 – 4,733) birds in the breeding season ( Table 5.61 Open ▸ ).
- Boat-based surveys of Seagreen Alpha and Bravo recorded herring gulls within both sites in regionally important numbers in the breeding season, likely to be linked to nearby SPAs. Taking into account urban nesting birds[1]as well as those within SPAs, the total count of herring gulls within the foraging range (mean max distance +1 sd from Woodward et al. 2019) of the Project approximates the regional population and is estimated at 29,600 breeding adults. Generally, herring gulls were distributed to the west of the Offshore Ornithology Study Area with many birds distributed in the western buffer (e.g., November 2019 and December 2020), and in the northwest buffer, such as in July and August 2019. Generally, fewer birds were observed within the Project, except for June and July 2019 and July 2020.
- Habitat use varied between seasons, with most birds recorded as sitting on the water during the breeding season, while during the non-breeding season the proportion of sitting and flying birds was relatively similar. Peaks in proportions of flying birds fluctuated within bio-seasons, such as the marked increase of flying birds between September and November 2020 ( Figure 5.54 Open ▸ ). Herring gulls generally feed by making shallow dives from the surface of the water, and the high proportion of sitting birds during the breeding season suggests the use of the Offshore Ornithology Study Area during foraging. The increased proportion of flying birds during the non-breeding period may be explained by the passage of migrant birds from further afield or the movement of successful breeders away from the colony to other areas (Furness, 2015).
- Of the birds that could be aged, most were recorded as adults. The highest average proportions of immature and juvenile birds occurred in the non-breeding season, at 32% and 2% respectively. The presence of more immature birds may be explained by increased movement of this life history stage compared to other demographics, since younger birds are known to disperse across larger distances compared to adults which generally remain closer to colonies (Wernham et al., 2002).
- Flight direction varied between surveys, with many birds flying northwest and southeast in July 2020. In December 2020, when abundance of herring gulls peaked, birds flew in all directions, but a large proportion were recorded flying southwards. This may be attributed to movement to colonies to the south of the Offshore Ornithology Study Area such as those located at St. Abb’s Head, which currently supports approximately 172 AON’s (SMP, 2021).
Table 5.57: Herring gull bio-seasons taken from NatureScot (2020a)
Table 5.61: Mean seasonal peak (MSP) population and density (birds/km2) of all herring gulls in the Offshore Ornithology Study Area across the two years of surveying (March 2019 to April 2021) estimated using design-based analysis. Data include “no-identification” birds apportioned to species
Figure 5.53: Summarised flight direction of herring gulls across the Offshore Ornithology Study Area
![]()

![]()

Figure 5.54: Percentage of flying herring gulls per survey across the Offshore Ornithology Study Area
5.11. Lesser black-backed gull
5.11. Lesser black-backed gull
- Lesser black-backed gulls are distributed throughout the UK, with breeding populations being a qualifying feature of ten UK SPAs (Stroud et al., 2001). National populations have fluctuated, with increases observed between the 1960s and early 2000s and decreases over the following decade (JNCC, 2014) which may be associated with redistribution of birds or changes to fishery discards policies (Ross-Smith et al., 2014; Furness et al., 1992). Specific to the Offshore Ornithology Study Area, lesser black-backed gulls are a qualifying species for the Forth Islands SPA, with 1,684 AON, 131 AOT and 97 AOT in 2018 on the Isle of May, Fidra and Craigleith respectively (NatureScot, 2018; SMP, 2021). The species is currently Amber-listed on the UK Birds of Conservation Concern List (Stanbury et al., 2021).
- Relatively high abundances observed throughout the aerial surveys may be due to the presence of several colonies in the vicinity of the survey area. Taking into urban nesting pairs[2], as well as those within SPA’s, the total count of herring gulls within the foraging range (mean max distance +1 sd from Woodward et al. 2019) of the Project approximates the regional population and is estimated at 13,994 breeding adults.
- Lesser black-backed gulls were recorded intermittently throughout the survey programme, mainly occurring during the breeding season, peaking in July 2019 and 2020 ( Figure 5.55 Open ▸ ). Design-based density estimates ranged between 0.00 birds/km2 and 0.06 birds/km2 (95%CI 0.04 – 0.09) in 2019/20 compared to 0.00 birds/km2 and 0.23 birds/km2 (95%CI 0.17 – 0.29) in 2020/21 ( Table 5.64 Open ▸ ). Between years, peaks in abundance varied substantially, with nearly three times as many birds recorded in July 2020 compared to July 2019. Much lower numbers of lesser black-backed gulls were recorded during the non-breeding season, with no birds between January and February in 2019 or 2020, as most birds move south for the winter months.
- The mean seasonal peak estimated population in the Offshore Ornithology Study Area for the breeding season was 580 birds (95%CI 427 – 741; Table 5.67 Open ▸ ).
- Boat-based surveys of Berwick Bank recorded 179 lesser black-backed gulls during the breeding season, similar to raw data collected during digital aerial surveys of the Offshore Ornithology Study Area. Lesser black-backed gulls were also recorded on Seagreen boat-based surveys and highlighted as a species likely to be present in regionally important numbers in the region, likely linked to breeding birds from the nearby Forth Islands SPA.
- Birds were distributed throughout the Offshore Ornithology Study Area in June and July 2019 and July 2020 ( Figure 5.56 Open ▸ ; Table 5.50 Open ▸ ). In 2019 and 2020, lesser black-backed gulls were widespread across the Offshore Ornithology Study Area, such as in July 2019, with a more concentrated distribution towards the northwest of the study area in August 2019. The species typically exhibits long foraging flights offshore, feeding on fish and discards from commercial fisheries (Camphuysen, 2013). It is likely that fisheries discards currently make up a much smaller percentage of diet than previously, following the discards ban at sea which was fully implemented in 2019 (Ulhmann et al., 2019). The species has, like many gulls, increased in urban areas feeding on human discards and litter.
- Of the birds that could be aged, most were recorded as adults. The highest average proportion of immature birds was recorded in the breeding season, at 9% of all recorded birds (Table 5.83). No juvenile lesser black-backed gulls were recorded.
- Flight direction was variable, with many birds flying east between June and August 2019 and July 2020 ( Figure 5.58 Open ▸ ). Birds also flew west in July and August 2020.
Table 5.63: Lesser black-backed gull bio-seasons taken from NatureScot (2020a)
Table 5.64: Monthly density and population estimates of all lesser black-backed gulls across the Offshore Ornithology Study Area using design-based analysis. Data include “no-identification” birds apportioned to species
Figure 5.55: Estimated densities (birds/km2) of all lesser black-backed gulls across the Offshore Ornithology Study Area using design-based analysis. Data include “no-identification” birds apportioned to species
Table 5.67: Mean seasonal peak (MSP) population and density (birds/km2) of all lesser black-backed gulls in the Offshore Ornithology Study Area across the two years of surveying (March 2019 to April 2021) estimated using design-based analysis. Data include “no-identification” birds apportioned to species
Figure 5.56: Distribution of lesser black-backed gulls across the Offshore Ornithology Study Area between March 2019 and March 2020
Table 5.68: Mean count, SD and proportion of lesser black-backed gulls in each age class averaged across bio-season
Figure 5.58: Summarised flight direction of lesser black-backed gulls across the Offshore Ornithology Study Area
![]()


![]()
5.12. Common tern
5.12. Common tern
- Located in both temperate and subtropical areas in the northern hemisphere, common terns are migratory seabirds found in coastal and inland areas (Mitchell et al., 2004). Within the UK, population trends have been relatively stable although regional fluctuations do occur, following changes in prey availability, nesting sites or predation (Mitchell et al., 2004). Common terns are a qualifying species for the nearby Forth Islands SPA, which is estimated to hold around 3% of the GB population, corresponding to 334 pairs (mean 1997 – 2001; NatureScot, 2018). Leith docks, located in Edinburgh also supports a large breeding population, estimated to be at around 514 and 246 AON in 2018 and 2019 respectively (SMP, 2021), although the Offshore Ornithology Study Area is out with the mean maximum foraging range (+1SD) for birds from this colony. The species is currently Amber-listed on the UK Birds of Conservation Concern List (Stanbury et al., 2021).
- Common terns return to UK waters between April and September to breed ( Table 5.69 Open ▸ ), spending their winters across the southern hemisphere. Birds were observed in both the 2019/20 and 2020/21 survey periods, with over 10 times more observations occurring in Year 2 compared to Year 1. Across all surveys, design-based density estimates ranged between 0.00 birds/km2 and 0.13 birds/km2 (95%CI 0.10 – 0.16) in 2019/20 compared to 0.00 birds/km2 and 1.49 birds/km2 (95%CI 1.02 – 2.02) in 2020/21 ( Table 5.70 Open ▸ ).
- Birds were primarily observed during the late breeding season, with peaks occurring in August 2019 and 2020 ( Table 5.70 Open ▸ ). Peaks at this time can likely be attributed to post-breeding movements of adults and juveniles away from coastal breeding colonies. Mean seasonal peak abundance was highest in the breeding season, with a population estimate of 3,225 birds (95%CI 2,224 – 4,332) ( Table 5.73 Open ▸ ). Lower abundance towards the start of the breeding season, such as between May and June can be attributed to birds beginning egg-laying and nest attendance, in which they are more closely associated with their nest sites until chicks have fledged.
- Berwick Bank boat-based surveys recorded one common tern, present in the July 2020 survey, with boat-based surveys for Seagreen Alpha and Bravo recording the species in regionally important numbers in the Alpha site only. No individuals were recorded within the Bravo site. Data summed from ESAS surveys conducted between 1980 and 1996 clipped to the Offshore Ornithology Study Area recorded four common terns throughout the 16-year period.
- Birds were widespread throughout the Offshore Ornithology Study Area, such as in August 2019 and 2020, located both within the Proposed Development Array area and the buffer. In August 2019 and 2020, there appeared to be no clear patterns in distribution, however in September 2020, common terns were concentrated to the south of the Offshore Ornithology Study Area.
- Bar one individual, all birds were recorded as flying. Common terns feed almost exclusively while on the wing, predominantly by either plunge diving or contact dipping, hawking or even intraspecific kleptoparasitism (Garcia et al., 2011 and references therein), therefore flight behaviour cannot be used to distinguish between foraging and passage. Generally, common terns flew eastwards and westwards, with most birds flying west in August 2020 and east in September 2020. In many months, so few birds were recorded flying that no conclusions regarding flight direction could be determined.
Table 5.69: Common tern bio-seasons taken from NatureScot (2020a)
Table 5.70: Monthly density and population estimates of all common terns across the Offshore Ornithology Study Area using design-based analysis. Data include “no-identification” birds apportioned to species
Table 5.73: Mean seasonal peak (MSP) population and density (birds/km2) of all common terns in the Offshore Ornithology Study Area across the two years of surveying (March 2019 to April 2021) estimated using design-based analysis. Data include “no-identification” birds apportioned to species
Figure 5.62: Summarised flight direction of common terns across Offshore Ornithology Study Area
5.13. Arctic tern
5.13. Arctic tern
- The most common breeding tern species in the UK, Arctic terns are present over the summer breeding season, forming coastal breeding colonies on vegetated rock and sand (Mitchell et al., 2004; Forrester et al., 2007). A significant proportion of Arctic terns breed in Scotland, which supports 84% of the British Isles breeding population and 10% of the world population (Forrester et al., 2007). Large variation in colony size between years is common, with some colonies only present for a few years at a time (Devlin et al., 2008). Arctic terns are a qualifying species for the nearby Forth Islands SPA, which supports 1.2% of the population of Great Britain, equating to approximately 540 pairs at time of designation (mean 1992 – 1996; NatureScot, 2018), compared to 832 pairs in 2017 (SMP, 2021). Post breeding, Arctic terns migrate south through the North Sea and down the eastern seaboard of the Atlantic, with many juvenile birds wintering in western and southern Africa (Hatch, 2002). The species is currently Amber-listed on the UK Birds of Conservation Concern List (Stanbury et al., 2021).
- Arctic terns spend a shorter period in UK waters than common terns, returning to UK shores to breed between late April and early September. Individuals were present during this period in both years of surveying. During the breeding season, the mean seasonal peak density was calculated at 1.03 birds/km2, equating to a mean seasonal peak population estimate for the Offshore Ornithology Study Area of 4,074 birds (95%CI 3,188 – 5,088; Table 5.79 Open ▸ ).
- Across all surveys, design-based density estimates ranged between 0.00 birds/km2 to 1.61 birds/km2 (95%CI 1.32 – 1.93) in 2019/20 compared to 0.00 birds/km2 to 0.44 birds/km2 (95%CI 0.29 – 0.63) in 2020/21 ( Table 5.76 Open ▸ ). Arctic terns were distributed throughout the Offshore Ornithology Study Area ( Figure 5.64 Open ▸ to Figure 5.66 Open ▸ ). In July 2019 and August 2020, birds were found congregated in the southeast of the Offshore Ornithology Study Area, while in August 2019, birds were spread between west and northeast.
- Peak abundances were recorded in late summer, such as in August 2019 and 2020, which can likely be attributed to adults and juveniles moving through the Offshore Ornithology Study Area away from breeding colonies. The origins of these birds are unknown but are likely to be from nearby colonies as well as elsewhere in the country, such as Shetland.
- Berwick Bank boat-based surveys in 2020-2021 recorded relatively high numbers of Arctic terns, recorded in all surveys apart from in April 2021. Boat-based surveys of Seagreen Alpha and Bravo estimated that regionally important numbers of the species were likely to be present within both sites with the species also recorded during pre-construction digital aerial surveys.
- Flight direction varied between surveys, with a large proportion of birds flying east and west in July and August 2019, while in August 2020 a substantial number of birds flew north ( Figure 5.67 Open ▸ ).
- Very few birds were recorded as sitting on the water on surveys, with 90% of total birds recorded as flying. As with common terns, birds feed almost entirely whilst on the wing; surface feeding, plunge-diving or hawking in the air. Due to this, flight behaviour cannot be used to distinguish between those foraging and passing through the survey area.
Table 5.75: Arctic tern bio-seasons taken from NatureScot (2020a)
Table 5.76: Monthly density and population estimates of all Arctic terns across Offshore Ornithology Study Area using design-based analysis. Data include “no-identification” birds apportioned to species
Table 5.79: Mean seasonal peak (MSP) population and density (birds/km2) of all Arctic terns in the Offshore Ornithology Study Area across the two years of surveying (March 2019 to April 2021) estimated using design-based analysis. Data include “no-identification” birds apportioned to species
Figure 5.64: Distribution of Arctic terns across Offshore Ornithology Study Area between March 2019 and March 2020
Figure 5.66: Distribution of Arctic terns across Offshore Ornithology Study Area April S02 2021
Figure 5.67: Summarised flight direction of Arctic terns across Offshore Ornithology Study Area
5.14. Great Skua
5.14. Great Skua
- Present only in the northeast Atlantic, there are approximately 16,000 breeding pairs of great skua worldwide, 60% of which are located in Scotland (Mitchell et al., 2004). Between 1900 and 1990, the Scottish population of great skuas doubled approximately every 12 years, with 80% of breeding birds located within SPAs (Mitchell et al., 2004). They feed on small fish species such as sandeels as well as klepto-parasitising other seabirds although previously they were also known to strongly associate with fishing vessels, preying on discards (Votier et al., 2004; Votier et al., 2008). It is likely that fisheries discards currently make up a much smaller percentage of diet than previously, following the banning of dumping discards at sea which was fully implemented in 2019 (Ulhmann et al., 2019). The species is currently Amber-listed on the UK Birds of Conservation Concern List (Stanbury et al., 2021).
- Great skuas were recorded in low densities in the Offshore Ornithology Study Area, primarily between August and December. The peak estimated population was 72 birds (95%CI 32 – 119) in November 2020, attributed to the passage of birds through the Offshore Ornithology Study Area during southwards post-breeding migration ( Table 5.82 Open ▸ ).
- Berwick Bank Boat-based surveys in 2020-2021 recorded low numbers of great skuas. Most individuals were recorded in August 2020, and these birds were presumed to be birds passing through on their southwards post-breeding migration.
- Great skua distribution was variable, with birds distributed in the east and west of the Offshore Ornithology Study Area, such as in July 2019 and October 2020 respectively ( Figure 5.69 Open ▸ – Figure 5.70 Open ▸ ). Overall, most birds were recorded flying, with only 27% of birds recorded as sitting on the water.
- Flight direction varied between surveys ( Figure 5.71 Open ▸ ).
Table 5.81: Great skua bio-seasons taken from NatureScot (2020a)
Table 5.82: Monthly density and population estimates of all great skuas across Offshore Ornithology Study Area using design-based analysis. Data include “no-identification” birds apportioned to species.
Figure 5.69: Distribution of great skuas across Offshore Ornithology Study Area between March 2019 and March 2020
Figure 5.70: Distribution of great skuas across Offshore Ornithology Study Area between May S01 2020 and April S01 2021
Figure 5.71: Summarised flight direction of great skuas across Offshore Ornithology Study Area
![]()


![]()
Figure 5.72: Percentage of flying great skuas per survey across Offshore Ornithology Study Area
5.15. Red-throated diver
5.15. Red-throated diver
- Typically wintering in UK coastal waters, including estuaries and sandy bays, red-throated divers migrate to higher latitudes during the breeding season, breeding on lochs in Scotland (Campbell, 1993). Listed as an Annex 1 species in the EU Birds Directive, red-throated divers are a qualifying species for many UK SPAs in the non-breeding season, with the Outer Firth of Forth and St Andrews Bay Complex SPA being the closest to the Offshore Ornithology Study Area, supporting about 2% of the GB wintering population, estimated at 90 individuals (Scottish Natural Heritage, 2018). The species is currently Green-listed on the UK Birds of Conservation Concern List (Stanbury et al., 2021).
- Red-throated divers were observed across the Offshore Ornithology Study Area in late spring and early winter, with peak density of 0.05 birds/km2 (95%CI 0.02 – 0.09) occurring in November 2020 and equating to an estimated 200 birds (95%CI 72 – 375; Table 5.87 Open ▸ ). Spring peaks in abundance, such as those recorded in May 2019 and May S02 2020 (57 birds (95%CI 22 – 98) and 34 birds (95%CI 0 – 80) respectively), can be attributed to the presence of pre-breeding congregations of the species, which have previously been observed off the east coast of Scotland in late May. Data summed from ESAS surveys conducted between 1980 and 1996 clipped to the Offshore Ornithology Study Area recorded two birds over the 16-year period, with no birds recorded on either the Project or Seagreen boat-based surveys. No red-throated divers were recorded during the WWT waterbird surveys.
- Generally, most observations occurred within the 16 km buffer, with birds recorded within the Project intermittently ( Figure 5.74 Open ▸ to Figure 5.76 Open ▸ ). In November 2020, when abundance of red-throated divers peaked, most birds were recorded in the south and west buffer, with some birds distributed in the south of the Proposed Development Array area.
- Most birds were recorded sitting on the water, but not in large groups; larger counts of birds within 500m transect segments were of 3-5 individuals only ( Figure 5.74 Open ▸ - Figure 5.76 Open ▸ ). No birds were recorded flying.
Table 5.86: Red-throated diver bio-seasons taken from NatureScot (2020a)
Table 5.87: Monthly apportioned density and population estimates of all red-throated divers across Offshore Ornithology Study Area using design-based analysis. Data include “no-identification” birds apportioned to species
Figure 5.74: Distribution of red-throated divers across Offshore Ornithology Study Area between March 2019 and March 2020
Figure 5.76: Distribution of red-throated divers across Offshore Ornithology Study Area April S02 2021
5.16. Fulmar
5.16. Fulmar
- One of the most common seabird species found in the UK, fulmars typically breed on cliffs before moving offshore during the non-breeding period (Mitchell et al., 2004). Over the 20th Century fulmar populations dramatically increased (Fisher, 1952), however this has since stabilised, with declines experienced in some areas (Mitchell et al., 2004). Fulmars are generally long-lived with a low reproductive rate, making them particularly susceptible to environmental variations and anthropogenic impacts (Hatch 1987; Thompson, 2006). Fulmars are a qualifying species for the nearby Fowlsheugh SPA, which supports approximately 157 AOS (NatureScot, 2018; SMP, 2021). The species is currently Amber-listed on the UK Birds of Conservation Concern List (Stanbury et al., 2021).
- Fulmar densities were relatively consistent throughout the first year of aerial survey is with slight increases in March 2019 and between November 2019 and January 2020 during the non-breeding season ( Figure 5.77 Open ▸ ). In Year 2, two large peaks in densities were estimated, occurring in September and December 2020 at 0.77 birds/km2 (95%CI 0.65 – 0.88) and 0.38 birds/km2 (95%CI 0.28 – 0.48), during the breeding and non-breeding seasons ( Table 5.92 Open ▸ ).
- Fulmars were recorded during boat-based surveys of the Project and Seagreen Alpha and Bravo, occurring in regionally important numbers in the latter survey areas. Boat-based surveys conducted throughout the outer Firth of Forth as part of the IMPRESS project (Camphuysen et al., 2004), reported the species as present in low abundances, accounting for 0.6% of total observations. This was also true for WWT waterbird surveys, in which only 25 individuals were recorded.
- The breeding season begins in April, with females exhibiting a pre-laying exodus from coastal colonies a month prior to laying, which may be visible in the slight increase in fulmar abundance in April S02 2021. Egg-laying begins in earnest in May, with birds closely associated to nest sites from May to mid-July. During these months, densities of fulmars were at their lowest in the Offshore Ornithology Study Area, as most birds would be in attendance at colonies. The highest mean seasonal peaks in density were observed during the breeding season ( Table 5.95 Open ▸ ), with a large proportion of birds recorded as sitting on the water, suggesting use of the area for foraging. These results are largely influenced by the relatively high abundance calculated for September 2020, at the end of the breeding season, when birds are dispersing from colonies along the coast.
- Outside of the breeding season, fulmars are highly pelagic, moving further offshore to spend the winter at sea. Few birds were recorded during the non-breeding season, such as in February 2019, suggesting birds are utilising the Offshore Ornithology Study Area most during dispersal periods between colonies and wintering areas ( Table 5.95 Open ▸ ).
- Distribution maps indicate widespread use of the Offshore Ornithology Study Area, with many birds recorded in the south and west during the breeding season, such as in June 2019 and May S01 2020 ( Figure 5.78 Open ▸ to Figure 5.80 Open ▸ ).
- Flight direction of fulmars varied between surveys ( Figure 5.81 Open ▸ ).
Table 5.91: Fulmar bio-seasons taken from NatureScot (2020a)
Table 5.92: Monthly density and population estimates of all fulmars across Offshore Ornithology Study Area using design-based analysis. Data include “no-identification” birds apportioned to species
Figure 5.77: Estimated densities (birds/km2) of all fulmars across Offshore Ornithology Study Area using design-based analysis. Data include “no-identification” birds apportioned to species
Table 5.95: Mean seasonal peak (MSP) population and density (birds/km2) of all fulmars in the Offshore Ornithology Study Area in the Offshore Ornithology Study Area across the two years of surveying (March 2019 to April 2021) estimated using design-based analysis. Data include “no-identification” birds apportioned to species
Figure 5.78: Distribution of fulmars across Offshore Ornithology Study Area between March 2019 and March 2020
Figure 5.80: Distribution of fulmars across Offshore Ornithology Study Area April S02 2021
Figure 5.81: Summarised flight direction of fulmars across Offshore Ornithology Study Area
![]()

![]()

Figure 5.82: Percentage of flying fulmars per survey across Offshore Ornithology Study Area
5.17. Manx shearwater
5.17. Manx shearwater
- Manx shearwaters are highly pelagic and migratory, coming to coastal colonies to breed between April and October, before migrating south away from the UK during the non-breeding season (Guilford et al., 2009; NatureScot, 2020a). Approximately 89% of the world population breeds in Great Britain and Ireland (Mitchell et al., 2004), with around 40% of these birds breeding on Rum, off the west coast of Scotland (Newton et al., 2004). The species is vulnerable to predation by other seabird species such as great black-backed gulls and great skuas (Newton et al., 2004). As pursuit divers, they mainly target small shoaling fish, molluscs and crustaceans (JNCC, 2016). The species is currently Amber-listed on the UK Birds of Conservation Concern List (Stanbury et al., 2021).
- Manx shearwater densities were generally low with birds primarily observed during the breeding season, peaking in June in both Year 1 and Year 2 ( Figure 5.84 Open ▸ ). In these months, peak densities were calculated at 0.02 birds/km2 (95%CI 0.00 0.04) and 0.04 birds/km2 (95%CI 0.02 – 0.07) respectively, equating to population estimates of 72 birds (95%CI 16 – 150) and 153 birds (95%CI 63 – 268; Table 5.97 Open ▸ ). Mean peak population estimates for both years of surveys were calculated at 113 birds (95%CI 40 – 209) during the breeding season ( Table 5.100 Open ▸ ).
- Berwick Bank boat-based surveys of in 2020-2021 recorded low numbers of Manx shearwaters across the survey period, with the species also not listed as a key species in the Seagreen Alpha or Bravo boat-based surveys. Site-specific digital aerial video pre-construction monitoring surveys of the same area suggested the species may be present in low numbers.
- Distribution of Manx shearwaters was variable, with birds distributed to the south and west, such as in June 2019, and July and September 2020 ( Figure 5.84 Open ▸ and Figure 5.85 Open ▸ ). In June 2020, many birds were also distributed in the northwest buffer.
- Generally, Manx shearwater were mostly recorded in flight on surveys (67%). Higher proportions of sitting birds recorded during the breeding season may be due to the presence of rafting or foraging birds (Richards et al., 2019). The species is a qualifying species for the Outer Firth of Forth and St Andrews Bay Complex SPA since the area hosts one of only five known at-sea aggregations in Great Britain and the only east coast aggregation (JNCC, 2016).
- Flight direction was variable ( Figure 5.86 Open ▸ ).
Table 5.96: Manx shearwater bio-seasons taken from NatureScot (2020a)
Table 5.97: Monthly density and population estimates of all Manx shearwaters across Offshore Ornithology Study Area using design-based analysis. Data include “no-identification” birds apportioned to species

Table 5.100: Mean seasonal peak (MSP) population and density (birds/km2) of all Manx shearwaters in the Offshore Ornithology Study Area across the two years of surveying (March 2019 to April 2021) estimated using design-based analysis
Figure 5.84: Distribution of Manx shearwaters across Offshore Ornithology Study Area in June, August and September 2019 and June to August in 2020
Figure 5.85: Distribution of Manx shearwaters across Offshore Ornithology Study Area September 2020
Figure 5.86: Summarised flight direction of Manx shearwaters across Offshore Ornithology Study Area
![]()

![]()

Figure 5.87: Percentage of flying Manx shearwaters per survey across Offshore Ornithology Study Area
5.18. Shag
5.18. Shag
- Distributed throughout the northeast Atlantic and Mediterranean, the UK supports approximately 34% of the global shag population (Wanless and Harris, 1997; JNCC 2016). Pursuit divers, they primarily feed on small fish species, such as saithe and sandeel (Harris and Wanless, 1991; Lorentsen et al., 2018). Shags are a qualifying species for the nearby Forth Islands, Outer Firth of Forth and St. Andrews Bay Complex and St. Abb’s Head to Fast Castle SPA’s. Colonies at the Isle of May and St. Abb’s National Nature Reserve were estimated to support approximately 404 and 133 AON respectively in 2018 and 2015 (SMP, 2021). The species is currently Red-listed on the UK Birds of Conservation Concern List (Stanbury et al., 2021).
- Shags were only recorded twice in the Offshore Ornithology Study Area, on the June 2019 and December 2020 surveys ( Figure 5.88 Open ▸ ). Design-based density estimates for June 2019 were 0.01 birds/km2 (95%CI 0.00 – 0.02), equating to a population estimate of 25 birds (95% CI 0 –72). The mean seasonal peak population estimate for the breeding season was 12 birds (95% CI 0 – 36; Table 5.105 Open ▸ ) compared to the non-breeding season, where 5 birds (95%CI 0 – 12) were estimated to be present.
- Shags were not an abundant species during the Berwick Bank boat-based surveys in 2020 and 2021 or on the Seagreen boat-based surveys.
- Birds were distributed in the south of the Offshore Ornithology Study in both June 2019 and December 2020, present in the buffer. All shags were recorded flying northwest ( Figure 5.91 Open ▸ ).
Table 5.101: Manx shearwater bio-seasons taken from NatureScot (2020a)
Figure 5.88: Estimated densities (birds/km2) of all shags across Offshore Ornithology Study Area using design-based analysis. Data include “no-identification” birds apportioned to species
Table 5.105: Mean seasonal peak (MSP) population and density (birds/km2) of all shags in the Offshore Ornithology Study Area across the two years of surveying (March 2019 to April 2021) estimated using design-based analysis
Figure 5.89: Distribution of shags across Offshore Ornithology Study Area in June 2019
Figure 5.90: Distribution of shags across Offshore Ornithology Study Area in December 2020
Figure 5.91: Summarised flight direction of shags across Offshore Ornithology Study Area
6 Summary
6 Summary
- The proposed Berwick Bank Wind Farm is located in the outer Firth of Forth, adjacent to the consented Firth of Forth offshore wind farms (OWFs) Seagreen, Inch Cape and Neart na Gaoithe. Berwick Bank is proposed for development by SSE Renewables.
- The proposed Berwick Bank development will, if consented, provide an estimated 4.1 GW of renewable energy and turbine capacity may range from 14 – 24 MW with a maximum number of turbines on site ranging between 179 – 307. Importantly, the minimum lower blade tip height is 37 m (LAT) as an embedded design measure to reduce collision risk to seabirds.
- This technical report, and its Annexes (A-L) provide the baseline ornithological characterisation for the Project. The report provides baseline information on the seasonal distribution, density, and abundance of seabirds in the Proposed Development Array area and a 16 km buffer (the Offshore Ornithology Study Area) based on:
- available reports and literature (“Desktop study” Section 22), and
- analysis of data from a series of digital aerial surveys 2019 – 2021 (“Berwick Bank digital aerial surveys” Section 33).
- There are several at-sea seabird survey datasets relevant to the baseline of Berwick Bank, including boat-based surveys undertaken at the site, boat and aerial surveys at adjacent sites (e.g., Seagreen) and the studies on gannet and auk foraging, survival and population dynamics, based on telemetry data (Lane and Harmer, 2021; Bogdanova et al., in prep.). Other data related to research projects (e.g., Camphuysen, 2005) and broader scale monitoring programmes (e.g., WWT aerial surveys and ESAS boat-based surveys) are also available.
- There are numerous breeding seabird colonies within the region, many of which are designated seabird Special Protection Areas (SPAs) that include the Forth Islands SPA, Fowlsheugh SPA, and St Abb’s Head to Fast Castle SPA. The Seabird Monitoring Project provides the most up-to-date estimates of the abundance of breeding seabirds at UK colonies.
- The Offshore Ornithology Study Area constituting an area of 3,975km2 was surveyed between March 2019 and April 2021 to collect seabird and marine mammal data suitable for site characterisation. The survey design consisted of 35 strip transects, spaced 2km apart, extending roughly north-west to south-east, across the survey area.
- The surveys were conducted by HiDef Digital Aerial Surveying Ltd. using aerial digital video methods. Survey aircraft were equipped with four HiDef Gen II cameras with sensors set to a resolution of 2 cm Ground Sample Distance (GSD). Each camera sampled a strip of 125m width, separated from the next camera by ~20m, providing a combined sampled width of 500m within a 575m overall strip.
- Surveys were flown at a height of approximately 550 m above sea level to ensure the altitude of the aircraft is always above that recommended to avoid disturbance to seabirds. Thaxter et al. (2016) recommends a minimum flight altitude of 460-500 m Above Sea Level (ASL).
- Position data for the aircraft was captured from a Garmin GPSMap 296 receiver with differential GPS enabled to give 1 m accuracy for the positions and recording updates in location at one second intervals for later matching to observations.
- Data from the cameras were processed to achieve a minimum target coverage of 12.5%. All camera data were viewed by HiDef’s trained reviewers and further analysis by the identification team. At least 20% of all birds were selected at random and subjected to a separate ‘blind’ QA process. If less than 90% agreement was attained for any individual camera then corrective action was initiated: if appropriate, the failed identifier’s data were discarded, and the data re-identified. Any disputed identifications were passed to a third-party expert ornithologist for a final decision. Birds were assessed for behaviour (flying, sitting) and, where possible, approximate age and sex.
- Survey data were primarily analysed using design to generate estimates of density and abundance per species /species group within the Offshore Ornithology Study Area and the Proposed Development array area. This report provides estimates and accounts for 18 of the most abundant species.
- The design-based analysis approach used a non-parametric bootstrap method with replacement (Buckland et al., 2001) on strip transect data to estimate the density of animals at the site, the standard deviation, the 95% Confidence Intervals (CIs) and coefficient of variance (CV). Estimates for guillemot, razorbill and puffin were corrected for availability bias following Barlow et al. (1988) to provide absolute abundance estimates. This could only be calculated for three auk species due to limited information currently available on diving rates of other seabird species. Monthly density and abundance estimate for flying birds, sitting birds and “all birds” were estimated. These estimates were used to generate mean-peak population estimates for all appropriate bio-seasons based on NatureScot guidance (2020a).
- Distribution maps for all species from design-based analysis were created as cent-count maps. Observations were aggregated within 500 m bins of transect using a nearest neighbour technique. The aggregated observations were presented per unit area of each bin (500 m x surveyed strip width).
- MRSea was used to generate model-based estimates of abundance. However, whilst the estimates were largely comparable to those from design-based estimates for many surveys, use of MRSea did not confer the expected advantage of greater precision of point estimates and for some surveys, estimates were unacceptably inflated. MRSea did not perform well in surveys where transects were missed. HiDef invested considerable time and work with the author of MRSea in order to be able to run it on the survey data. HiDef raised some of these issues during the Marine Scotland Ornithology Impact Assessment workshop in February 2022.
- Over the 25-month survey period, 41 species were observed. During Year 1 of the survey programme (March 2019 to February 2020; comprised of 11 surveys), a total of 88,624 individuals of 31 species were recorded. In Year 2 (March 2020 to April 2021; comprised of 14 surveys), 32 species were recorded over 192,376 observations. A further 21,618 observations identified to species groups were made over the course of the surveys. The number of flights flown in Year 2 were greater and this contributes to the larger number of detections in this year compared to Year 1; however, as seabirds are mobile species, interannual variation in abundance of species is expected.
- Guillemots were the most abundant species, with peaks present in April, May and August and/or September in both years, coinciding with the start of the breeding season and the post-breeding flightless moult stage. April/May peaks coincide with the onset of egg-laying and incubation (Harris and Wanless, 2004). During this time, most birds were recorded as sitting on the water, which is to be expected considering their feeding strategy, in which they dive for prey from the water surface. When accounting for animals diving at the time of the survey, estimates of density were higher during the breeding season, with mean peak densities for the region of 46.91 birds/km2 (95%CI 37.98 – 57.83), compared to 34.88 birds/km2 (95%CI 27.41 – 43.02) during the non-breeding season. Peak population estimates in April S02 2021 equated to 242,168 birds (95%CI 190,509 – 305,941). The local SPA total for guillemots is estimated at 280,972 breeding adults, with another 148,805 breeding adults at North Caithness Cliffs SPA also likely to have connectivity with the Project. The relatively high abundance estimated for the site in April S02 2021 is likely to be explained by a good breeding season in 2020 (supported by our data for September 2020 and NatureScot, 2021), which as a consequence will lead to a high number of birds returning to the area ahead of the following 2021 breeding season.
- The highest mean seasonal peak of kittiwakes was estimated during the non-breeding season at approximately 50,958 birds (95%CI 35,530 – 69,349) likely attributed to the movement of birds between colonies and wintering areas. Behaviour differed between seasons with the largest proportions of flying birds generally occurring between April and June, and October and December dependent on year. Large proportions of birds were recorded as sitting on the water in all surveys, suggesting the Offshore Ornithology Study Area is used for foraging year-round.
- Razorbills were present in relatively high abundances, with birds recorded most frequently in October and September in Year 1 and Year 2 respectively. Throughout the year, most birds were recorded as sitting on the water. This is to be expected when considering the feeding strategy adopted by the species, in which they dive from the surface of the water for prey (Shoji et al., 2015). The highest mean seasonal peak for all razorbills occurred during the non-breeding season, calculated at 35,589 birds (95%CI 25,185 – 46,150).
- Puffins were relatively abundant throughout the Offshore Ornithology Study Area, with density and population estimates suggesting the species utilises the area most frequently between March and September during the breeding season. Mean seasonal peaks were estimated as 12,290 birds (95%CI 9,857 – 14,997) in the breeding season and 20,667 birds (95%CI 17,298 – 24,031) in the non-breeding season. High abundances between May and August suggest birds at nearby colonies use the Offshore Ornithology Study Area to forage during chick rearing, with widespread dispersal towards the end of this period suggesting movement offshore to at-sea wintering areas.
- Gannets were most abundant in the breeding season with a mean seasonal peak for this period estimated at 14,581 birds (95%CI 12,528 – 16,840) and comprised in almost equal proportions of flying and sitting birds; suggesting the area is used during foraging and during passage to foraging grounds further afield. High densities are to be expected within the survey area, due to the proximity to Bass Rock where breeding success of gannets has been consistently high, despite fluctuations in breeding success for other seabird species in the vicinity (Nelson, 2006; Hamer et al., 2007).
- Common scoter occurred in very low numbers, recorded during the June 2019 and January 2020 surveys only. All birds were recorded as flying, with abundance estimates for these months calculated at 16 birds (95%CI 0 - 48) and 9 birds (95%CI 0 - 28), respectively.
- Black-headed gulls were only recorded within the Offshore Ornithology Study Area in the non-breeding season. The mean seasonal peak population estimate for the Offshore Ornithology Study Area was estimated at 9 birds (95%CI 1 - 24) during the non-breeding season.
- Little gulls were observed during the non-breeding and breeding seasons. Low numbers of birds are known to be present along the Fife and Lothian coasts, with the Firth of Forth being one of the only areas where birds are consistently seen in low numbers between December and March (Forrester et al., 2007). The Outer Firth of Forth and St Andrews Bay Complex SPA, which overlaps the southwest corner of the Offshore Ornithology Study Area, was designated to support non-breeding populations of little gulls among other seabird species. The mean seasonal peak population occurred during the non-breeding season, calculated at 279 birds (95%CI 150 - 426).
- Common gulls were primarily recorded during the non-breeding season in both years. Over winter, the UK hosts almost half the European population of common gulls (European Commission, 2009), with many of these birds occurring in Scottish coastal areas (Burton et al., 2013). The mean seasonal peak abundance estimates were 146 birds (95%CI 81 - 218) and 745 birds (95%CI 218 – 1,408) in the breeding and non-breeding season, respectively.
- Herring gulls were the most abundant large gull species encountered during the survey period, present in greater numbers from mid to late summer and again in winter. Very few birds were present throughout the rest of the year. Mean-peak population estimates were highest in the non-breeding season estimated at 3,382 birds (95%CI 957 – 6,294), and the proportion of flying to sitting birds was similar. A mean-peak population of 3,356 birds (95%CI 2,246 – 4,733) was estimated in the breeding season.
- Lesser black-backed gulls were recorded intermittently throughout the survey programme, mainly recorded during the breeding season. Specific to the Offshore Ornithology Study Area, lesser black-backed gulls are a qualifying species for the Forth Islands SPA, with 1,684 AON, 131 AOT and 97 AOT in 2018 on the Isle of May, Fidra and Craigleith respectively (NatureScot, 2018; SMP, 2021). Between years, peaks in abundance varied considerably, with nearly three times as many birds recorded in the July 2020 peak compared to that in July 2019. No birds were recorded in January and February in both years. The mean seasonal peak abundance during the breeding season was 580 birds (95%CI 427 – 741) compared to 17 (95%CI 1 - 43) during the non-breeding season.
- Common terns return to UK waters between April and September to breed, spending their winters across the southern hemisphere. Birds were observed in both the 2019/20 and 2020/21 survey periods, with over 10 times more observations occurring in Year 2 compared to Year 1. In the breeding season, the mean seasonal peak abundance was estimated to be 3,225 birds (95%CI 2,224 – 4,332). Lower abundances at the start of the breeding season, such as between May and June can be attributed to birds beginning egg-laying and nest attendance, in which they are more closely associated with their nest sites until chicks have fledged. Densities of birds during these months in the survey area are expected to be low, as many birds remain close to colonies. A few birds were recorded during the non-breeding season.
- Arctic terns spend a shorter period in UK waters than common terns, returning to the UK to breed between late April and early September. The species was present during the breeding period in both years of surveying. During the breeding and non-breeding seasons, the mean seasonal peak population was estimated to be 4,074 birds (95%CI 3,188 – 5,088) and 163 (95%CI 45 – 325) respectively.
- Great skua were recorded in low densities in the Offshore Ornithology Study Area, primarily between August and December. The peak estimated population estimate was calculated at 72 birds (95%CI 32 – 119) in November 2020. It is likely this peak in abundance can be attributed to the passage of birds through the area during southwards post-breeding migration.
- Red-throated diver were predominately detected within the buffer, with birds recorded within the Proposed Development Array intermittently. The highest mean seasonal peak was estimated during the non-breeding season at 105 birds (95%CI 36 – 204).
- Fulmar densities were relatively consistent throughout the first year of surveying, with slight increases in March 2019 and between November 2019 and January 2020 during the non-breeding season. In Year 2, two large peaks in densities were estimated, occurring in September and December 2020 at 0.77 birds/km2 (95%CI 0.65 – 0.88) and 0.38 birds/km2 (95%CI 0.28 – 0.48), during the breeding and non-breeding seasons. Mean seasonal peak abundance was highest during the breeding season with an estimated 1,776 birds (95%CI 1,469 – 2,100), although this was largely influenced by the September peak. The mean seasonal peak for the non-breeding period was estimated at 1,071 birds (95%CI 787 – 1,365).
- Densities of Manx shearwaters were generally low, with birds primarily observed during the breeding season, peaking in June in Year 1 and Year 2. Mean peak estimates for both years of surveying of 113 birds (95%CI 40 – 209) in the breeding season, compared to 0 birds in the non-breeding season. A higher proportion of birds were recorded as flying compared to other behaviours (e.g. sitting or diving) however, higher proportions of sitting birds recorded during the breeding season may be due to the presence of rafting or foraging birds (Richards et al., 2019).
- Shags were only recorded twice in the Offshore Ornithology Study Area, on the June 2019 and December 2020 surveys. The mean seasonal peak population estimate for the breeding season was calculated at 12 birds (95% CI 0 – 36). Birds were distributed in the south of the Offshore Ornithology Study Area in both June 2019 and December 2020, present in the buffer. All shags were recorded flying northwest.
7 References
7 References
Anker-Nilssen,T., and Røstad, O.W. (1993). Census and Monitoring of Puffins Fratercula arctica on Røst, N Norway, 1979-1988. Ornis Scandinavica (Scandinavian Journal of Ornithology), 24(1), 1–9.
Anker-Nilssen, T., Barrett, R.T., Christensen-Dalsgaard, S., Erikstad, K.E., Lorentsen, S.H., Lorentzen, E., Moe, B., Reiertsen, T.K., Sivertsen, K., Strøm, H. and Systad, G.H. (2017). Sjøfugli Norge 2016. Resultater fra SEAPOP-programmer. SEAPOP: 28.
Arnott, S. A. and Ruxton, G. D. (2002). Sandeel recruitment in the North Sea: demographic, climatic and trophic effects. Marine Ecology Progress Series, 238, 199–210.
Austin, G., Collier, M., Calbrade, N., Hall, C., and Musgrove, A. 2007. Waterbirds in the UK 2006/2007. The Wetland Bird Survey. 10pp. https://www.bto.org/sites/default/files/u18/downloads/publications/wituk200607_1.pdf
Banks, N.A., Burton, N.H.K., Calladine, J.R. and Graham, E.A. (2009). Indexing winter gull numbers in Great Britain using data from the 1953 to 2004 Winter Gull Roost Surveys. Bird Study, 56(1), 103-119.
Barlow, J, Oliver, C.W., Jackson, T.D. and Taylor, B.L. (1988). Harbour porpoise Phocoena phocoena, abundance estimation for California, Oregon and Washington: II. Fishery Bulletin, 86, 433-444.
BirdLife International. (2004). Birds in the European Union: a status assessment. BirdLife International, Wageningen, The Netherlands.
Bogdanova, M.I., Wischnewski, S., Cleasby, I., Whyte, K., Regan, C., Gunn, C., Newell, M., Benninghaus, E., et al. (in prep.). Seabird GPS tracking on the Isle of May, St Abbs Head and Fowlsheugh in 2021 in relation to offshore wind farms in the Forth/Tay region. Report to the Forth and Tay Offshore Wind Developers.
Bradbury, G., Trinder, M., Furness, R., Banks, A.N., Caldow, R.W.G. and Hume, D. (2014). Mapping seabird sensitivity to offshore wind farms. PLoS ONE, 9(9). e106366.
Brown, A. and Grice, P. (2005). Birds in England. T. and A.D. Poyser, London.
Buckland, S., Anderson, D., Burnham, K., Laake, J., Borchers, D. and Thomas, L. (2001). Introduction to Distance Sampling: Estimating Abundance of Biological Populations. Oxford University Press.
Buckland, S.T., Burt, L.M., Rexstad, E.A., Mellor, M., Williams, A.E. and Woodward, R. (2012). Aerial surveys of seabirds: the advent of digital methods. Journal of Applied Ecology, 49, 960–967.
Bukaciński D., Bukacińska M. (2003). Larus canus Common Gull. BWP Update 5: 13–47.
Burton, N.H., Banks, A.N., Calladine, J.R. and Austin, G.E. (2013). The importance of the United Kingdom for wintering gulls: population estimates and conservation requirements. Bird Study, 60(1), 87-101.
Busch, M., Kannen, A., and Garthe, S., (2013). Consequences of a cumulative perspective on marine environmental impacts: offshore wind farming and seabirds at North Sea scale in context of the EU Marine Strategy Framework Directive. Ocean and Coastal Management, 71. 213-224.
Calbrade, N., Holt, C., Austin, G., Mellan, H., Hearn, R., Stroud, D., Wotton, S and Musgrove, A. 2009. Waterbirds in the UK 2008/2009. The Wetland Bird Survey. 10pp. https://www.bto.org/sites/default/files/u18/downloads/publications/wituk200809_1.pdf
Campbell, L.H. (1993). Red-throated Diver. In The New Atlas of Breeding Birds in Britain and Ireland: 1988-1991. Oxford University Press, Oxford. 20-21.
Camphuysen, K. and Garthe, S. (1997). An evaluation of the distribution and scavenging habits of northern fulmars (Fulmarus glacialis) in the North Sea. ICES Journal of Marine Science, 54(4), 654-683.
Camphuysen, C.J., and Garthe, S., (2000). Sea birds and commercial fisheries: population trends of piscivorous seabirds explained? M.J. Kaiser, S. de Groot (Eds.), Effects of Fishing on Non-Target Species and Habitats, Blackwell Science, Oxford. 163-184.
Camphuysen, C.J., A.D. Fox, M.F. Leopold and Petersen, I.K. (2004). Towards standardised seabirds at sea census techniques in connection with environmental impact assessments for offshore wind farms in the U.K. - A comparison of ship and aerial sampling methods for marine birds, and their applicability to offshore wind farm assessments. Report COWRIE - BAM -02-2002.
Camphuysen, C. J. (2005). Understanding marine foodweb processes: an ecosystem approach to sustainable sandeel fisheries in the North Sea. IMPRESS Final Report. Royal Netherlands Institute for Sea Research, Texel, Netherlands
Camphuysen, C.J. (2013). A historical ecology of two closely related gull species (Laridae): multiple adaptations to a manmade environment. PhD Thesis, University of Groningen.
Cazenave, P.W., Ricardo, T., and J., Icarus, Allen. (2016). Unstructured grid modelling of offshore wind farm impacts on seasonally stratified shelf seas. Progress in Oceanography, 145, 25-41.
Cleasby, L.R., Wakefield, E.D., Bodey, T.W., Davies, R.D., Patrick, S.C., Newton, J., Votier, S.C., Bearhop, S., Hamer, K.C., (2015). Sexual segregation in a wide-ranging marine predator is a consequence of habitat selection. Mar. Ecol. Prog. Ser., 518, 1-12.
Cleasby, I.R., Owen, E., Wilson, L.J. and Bolton, M. (2018) Combining habitat modelling and hotspot analysis to reveal the location of high density seabird areas across the UK: Technical Report. RSPB Research Report no. 63. RSPB Centre for Conservation Science, RSPB. Cleasby, I.R., Owen, E., Wilson, L., Wakefield, E.D., O’Connell, P., Bolton, M., (2020). Identifying important at-sea areas for seabirds using species distribution models and hotspot mapping. Biological Conservation, 241, 108375.
Cook, A.S.C.P., Dadam, D., Mitchell, I., Ross-Smith, V.H., Robinson, R.A. (2014). Indicators of seabird reproductive performance demonstrate the impact of commercial fisheries on seabird populations in the North Sea. Ecological Indicators, 38, 1-11.
Coulson, J.C. (2011). The Kittiwake. London: T. and A.D. Poyser.
Cox, S.L., Scott, B.E., Camphuysen, C.J. (2013). Combined spatial and tidal processes identify links between pelagic prey species and seabirds. Mar. Ecol. Prog. Ser., 479, 203-221.
Cramp, S. and Simmons, K.E.L. (1977). Birds of the western Palearctic. Oxford.
Cramp, S. and Simmons, K.E.L. (1983). The birds of the Western Palearctic. Vol. 3. Oxford University Press, Oxford.
Crespin, L., Harris, M.P., Lebreton, J-D., Frederiksen, M, and Wanless, S. (2006). Recruitment to a seabird population depends on environmental factors and on population size. Journal of Animal Ecology, 75(1), 228-238.
Daunt, F., Wanless, S., Greenstreet, S.P., Jensen, H., Hamer, K.C. and Harris, M.P. (2008). The impact of the sandeel fishery closure on seabird food consumption, distribution, and productivity in the northwestern North Sea. Canadian journal of fisheries and aquatic sciences, 65(3), 362-381.
Deakin, Z., Hamer, K.C., Sherley, R.B., Bearhop, S., Bodey, T.W., Clark, B.L., Grecian, W.J., Gummery, M., Lane, J., Morgan, G., Morgan, L., Phillips, R.A., Wakefield, E.D., Votier, S.C. (2019). Sex differences in migration and demography of a wide-ranging seabird, the northern gannet. Marine Ecology Progress Series 622: 191-201. doi: 10.3354/meps12986
Devlin, C.M., Diamond, A.W., Kress, S.W., Hall, C.S. and Welch, L. (2008). Breeding dispersal and survival of Arctic terns (Sterna paradisaea) nesting in the Gulf of Maine. The Auk, 125(4), 850-858.
Dierschke, V., Furness, R.W., Carrie, E.G., Petersen, I.K., Schmutz, J., Ramunas, Z. and Daunt, F. (2017). Possible behavioural, Energetic and Demographic Effects of Displacement on Red-throated Divers. Joint Nature Conservation Committee, JNCC
Dunnet, G.M., Furness, R.W., Tasker, M.L., Becker, P.H. (1990). Seabird ecology in the north sea. Netherland Journal of Sea Research, 26(2-4), 387-425.
Dunning, J.B. (1992). CRC Handbook of Avian Body Masses. CRC Press. ISBN 978-0-8493-4258-5.
Durant, J.M., Anker-Nilssen, T. and Stenseth, N.C. (2006). Ocean climate prior to breeding affects the duration of the nestling period in the Atlantic puffin. Biology letters, 2(4), 628-631.
Eggeling, W.J. (1974). The birds on the Isle of May—a revised assessment of status. Scottish Birds, 8, 93–148.
Embling, C.B., IIlian, J., Armstrong, E., van der Kooij, J., Sharples, J., Camphuysen, C.J. and Scott, B.E. (2012). Investigating fine-scale spatio-temporal predator–prey patterns in dynamic marine ecosystems: a functional data analysis approach. Journal of Applied Ecology, 49, 481–492.
Erikstad, K.E., Fauchald, P., Tveraa, T., Steen, H. (1998). On the cost of reproduction in long-lived birds: the influence of environmental variability. Ecological Society of America, 79(5), 1781-1788.
European Commission. (2009). European Union Management Plan 2009 – 2011: Common gull Larus canus. Luxembourg.
Fijn, R.C., Japink, M. and Poot, M.J.M. (2013). Population and density estimates of seabirds at Neart na Gaotihe: Distance analysis of ship-based survey data from the period November 2009 to October 2012. Bureau Waardenburg bv.
Finney, S.K., Harris, M.P., Keller, L.F., Elston, D.A., Monaghan, P. and Wanless, S. (2003). Reducing the Density of Breeding Gulls Influences the Pattern of Recruitment of Immature Atlantic Puffins Fratercula arctica to a Breeding Colony. Journal of Applied Ecology, 40, 545-552.
Fisher, J. (1952). The fulmar. London: Collins
Forrester, R.W., Andrews, I.J., Mcinerny, C.J., Murray, R.D., Mcgowan, R.Y., Zonfrillo, B., Betts, M.W., Jardine, D.C. and Grundy, D.S. (2007). The Birds of Scotland. Scottish Ornithologists’ Club, Aberlady.
Fox, A.D. (2003). Diet and habitat use of Scoters Melanitta in the western Palearctic - a brief overview. Wildfowl, 54, 163–182.
Frederiksen, M., Harris, M.P., Daunt, F., Rothery, P. and Wanless, S. (2004). The role of industrial fisheries and oceanographic change in the decline of North Sea black-legged kittiwakes. Journal of Applied Ecology, 41, 1129–1139.
Frederiksen, M., Wright, P.J., Heubeck, M., Harris, M.P., Mavor, R.A. and Wanless, S. (2005). Regional patterns of kittiwake Rissa tridactyla breeding success are related to variability in sandeel recruitment. Marine Ecology Progress Series, 300, 201–211.
Frederiksen, M., Daunt, F., Harris, M.P., and Wanless, S. (2008). The demographic impact of extreme events: stochastic weather drives survival and population dynamics in a long-lived seabird. Journal of Animal Ecology, 77(5), 1020-1029.
Frederiksen, M., Moe, B., Daunt, F., Phillips, R.A., Barrett, R.T., Bogdanova, M.I., Boulinier, T., Chardine, et al. (2012). Multi-colony tracking reveals the winter distribution of a pelagic seabird on an ocean basin scale. Diversity and Distributions, 18, 530–542.
Furness, R.W., Ensor, K. and Hudson, A. V. (1992). The use of fishery waste by gull populations around the British Isles. Ardea, 80, 105–113.
Furness, R.W. and Tasker, M.L. (1999). Diets of seabirds and consequences of changes in food supply. International Council for the Exploration of the Sea (ICES).
Furness, R.W. and Tasker, M.L. (2000). Seabird-fishery interactions: quantifying the sensitivity of seabirds to reductions in sandeel abundance, and identification of key areas for sensitive seabirds in the North Sea. Mar. Ecol. Prog. Ser., 202, 253-264.
Furness, R.W. (2015). Non-breeding season populations of seabirds in UK waters: Population sizes for Biologically Defined Minimum Population Scales (BDMPS). Natural England Commissioned Report Number 164.
Furness, R.W., Wade, H.M., Masden, E.A. (2013). Assessing vulnerability of marine bird populations to offshore wind farms. Journal of Environmental Management, 119, 56-66.
Furness, R.W., Hallgrimsson, G.T., Montevecchi, W.A., Fifield, D., Kubetzki, U., Mendel, B. and Garthe, S. (2018). Adult Gannet migrations frequently loop clockwise around Britain and Ireland. Ringing and Migration, 33(1), 45-53.
García, G.O., Becker, P.H. and Favero, M. (2011). Kleptoparasitism during courtship in Sterna hirundo and its relationship with female reproductive performance. Journal of Ornithology, 152(1), pp.103-110.
Gaston, A.J. and Jones, I.L. (1998). Bird families of the world. The Auks Alcidae. Oxford University Press, Oxford.
Gilbert, G., Gibbons, D.W. and Evans, J. (1998). Bird Monitoring Methods: a manual of techniques for key UK species. RSPB.
Green, R.E., Langston, R.H.W., McCluskie, A., Sutherland, R., and Jeremy D. Wilson, J.D. (2016). Lack of sound science in assessing wind farm impacts on seabirds. Journal of Applied Ecology, 53, 1635-1641.
Greenstreet, S., Fraser, H., Amrstrong, E. and Gibb, I. (2010). Monitoring the Consequences of the Northwestern North Sea Sandeel Fishery Closure. Scottish Marine and Freshwater Science Vol 1 No 6. Edinburgh: Scottish Government, 31.
Guilford, T., Meade, J., Willis, J., Phillips, R.A., Boyle, D., Roberts, S., Collett, M., Freeman, R. and Perrins, C.M. (2009). Migration and stopover in a small pelagic seabird, the Manx shearwater Puffinus puffinus: insights from machine learning. Proceedings of the Royal Society B: Biological Sciences, 276(1660), 1215-1223.
Hamer, K.C., Phillips, R.A., Wanless, S., Harris, M.P. and Wood, A.G. (2000). Foraging ranges, diets and feeding locations of gannets Morus bassanus in the North Sea: evidence from satellite telemetry. Marine ecology progress series, 200, 257-264.
Hamer, K.C., Humphreys, E.M., Garthe, S., Hennicke, J., Peters, G., Grémillet, D., Phillips, R.A., Harris, M.P. and Wanless, S. (2007). Annual variation in diets, feeding locations and foraging behaviour of gannets in the North Sea: flexibility, consistency and constraint. Marine Ecology Progress Series, 338, 295-305.
Harris, M.P. (1984). The Puffin, Calton, UK: T and AD Poyser.
Harris, M.P. and Hislop, J.R.G. (1978). The food of young puffins Fratercula arctica. Journal of Zoology, 185, 213-236.
Harris, M. P. and Wanless, S. (1991). The importance of the lesser sandeel Ammodytes marinus in the diet of the shag Phalacrocorax aristotelis. Ornis Scandinavica, 22(4), 375–382.
Harris, M. P. and Wanless, S. (2004). The Atlantic Puffin Fratercula arctica. In: Mitchell, I. P., Newton, S. F., Ratcliffe, N. and Dunn,T. E. (eds.) Seabird populations in Britain and Ireland: 392-406. Poyser, London.
Harris, M.P., Daunt, F., Newell, M., Phillips, R.A. and Wanless, S. (2010). Wintering areas of adult Atlantic puffins Fratercula arctica from a North Sea colony as revealed by geolocation technology. Marine Biology, 157, 827–836.
Harris, M. P., Newell, M. A., Daunt, F. and Wanless, S. (2017). Monitoring the breeding success of common guillemots Uria aalge: the value of multiple plots. Seabird, 30, 31-38.
Harwood, A.J.P., Perrow, M.R. and Berridge, R.J. (2018). Use of an optical rangefinder to assess the reliability of seabird flight heights from boat-based surveyors: implications for collision risk at offshore wind farms. Journal of Field Ornithology, 89, 372–383.
Hatch, S.A. (1987). Adult survival and productivity of Northern Fulmars in Alaska. The Condor, 89(4), 685-696.
Hatch, J. (2002). Arctic tern (Sterna paradisaea). The Birds of North America, Philadelphia, PA.
Heinänen, S., Žydelis, R., Kleinschmidt, B., Dorsch, M., Burger, C., Morkūnas, J., Quillfeldt, P., and Nehls, G., (2020). Satellite telemetry and digital aerial surveys show strong displacement of red-throated divers (Gavia stellata) from offshore wind farm. Marine Environmental Research, 160, 104989.
Horswill, C., and Robinson, R.A. (2015). JNCC Report No: 552, Review of Seabird Demographic Rates and Density Dependence. British Trust for Ornithology, ISSN 0963 8901.
Horswill, C., O'Brien, S.H. and Robinson, R.A. (2017). Density dependence and marine bird populations: are wind farm assessments precautionary? Journal of Applied Ecology, 54(5), 1406-1414.
Horswill, C., Manica, A., Daunt, F., Newell, M., Wanless, S., Wood, M. and Matthiopoulos, J. (2021). Improving assessments of data‐limited populations using life‐history theory. Journal of Applied Ecology, 58(6), 1225-1236.
Horton, N., Brough, T. and J.B.A. Rochard. (1983). The importance of refuse tips to gulls wintering in an inland area of south-east England. Journal of Applied Ecology, 20, 751-765.
del Hoyo,, J., Elliot, A. and Sargatal, J. (1992). Handbook of the Birds of the World, vol. 1: Ostrich to Ducks. Lynx Edicions, Barcelona, Spain.
del Hoyo, J., Elliot, A. and Sargatal, J. (eds) (1996). Handbook of the birds of the world, vol. 3. Lynx Edicions, Barcelona, Spain.
Jarrett, D., Cook, A.S.C.P., Woodward, I., Ross, K., Horswill, C., Dadam, D. and Humphreys, E.M. (2018). Short-Term Behavioural Responses of Wintering Waterbirds to Marine Activity. Scottish Marine and Freshwater Science, 9(7).
Jessopp, M.J., Cronin, M., Doyle, T.K., Wilson, M., McQuatters-Gollop, A., Newton, S. and Phillips, R.A. (2013). Transatlantic migration by post-breeding puffins: a strategy to exploit a temporarily abundant food resource? Marine Biology, 160, 2755-2762.
JNCC. (2014). Seabird Population Trends and Causes of Change: 1986-2013 Report. Joint Nature Conservation Committee, Peterborough.
JNCC. (2016). Outer Firth of Forth and St Andrews Bay Complex Proposed Special Protection Area (pSPA) No: UK9020316. SPA Site Selection Document: Summary of the scientific case for site selection. Joint Nature Conservation Committee, Peterborough.
JNCC. (2021). Seabird Population Trends and Causes of Change: 1986-2019 Report. Joint Nature Conservation Committee, Peterborough.
Johnston, A., Cook, A.S., Wright, L.J., Humphreys, E.M. and Burton, N.H. (2014). Modelling flight heights of marine birds to more accurately assess collision risk with offshore wind turbines. Journal of Applied Ecology, 51, 31–41.
Keogan, K., Lewis, S., Howells, R.J., Newell, M.A., Harris, M.P., Burthe, S., Phillips, R.A., Wanless, S., Phillimore, A.B. and Daunt, F. (2019). No evidence for fitness signatures consistent with increasing trophic mismatch over 30 years in a population of European shag Phalacrocorax aristotelis. Journal of Animal Ecology, 90(2), 432-446.
Kober, K., Webb, A., Win, I., Lewis, M., O’Brien, S., Wilson, L.J., and Reid, J.B., (2010). JNCC Report No: 431, An analysis of the numbers and distribution of seabirds within the British Fishery Limit aimed at identifying areas that qualify as possible marine SPAs. Joint Nature Conservation Committee, ISSN 0963-8091.
Kober, K., Wilson, L.J., Black, J., O’Brien, S., Allen, S., Win, I., Bingham, C. and Reid, J.B. (2012). The identification of possible marine SPAs for seabirds in the UK: The application of Stage 1.1-1.4 of the SPA selection guidelines. Joint Nature Conservation Committee, ISSN 0963-8091.
Lane, J.V. and Hamer, K.C. (2021). Annual adult survival and foraging of gannets at Bass Rock, Scotland: Report to the Ornithology subgroup of the Forth and Tay Regional Advisory Group (FTRAG-O) – November 2021. Forth and Tay Regional Advisory Group (FTRAG-O) Official Report. NnG Document number NNG-LUN-ECF-REP-0002.
Lane, J.V., Jeavons, R., Deakin, Z., Sherley, R.B., Pollock, C.J., Wanless, R.J., and Hamer, K.C. (2020). Vulnerability of northern gannets to offshore windfarms; seasonal and sex-specific collision risk and demographic consequences. Marine Environmental Research, 162, 105196.
Lorentsen, S.-H., Anker-Nilssen, T. and Erikstad, K. E. (2018). Seabirds as guides for fisheries management: European shag Phalacrocorax aristotelis diet as indicator of saithe Pollachius virens recruitment. Marine Ecology progress Series, 586, 193–201.
Maclean, I.M., Frederiksen, M. and Rehfisch, M.M. (2007). Potential use of population viability analysis to assess the impact of offshore wind farms on bird populations. BTO Research Report 480. BTO, Thetford.
McInerny, C.J. and Griffin, M. (2007). Autumn skua migration at Hound Point, Lothian. Scottish Birds, 27, 24.
Merkel, B. (2019). Migration in seabirds: seasonal structure in space and environment across species, populations and individuals. PhD thesis. Tromsø: The Arctic University of Norway.
Mitchell, P.I., Newton, S.F., Ratcliffe, N. and Dunn, T.E. (2004). Seabird populations of Britain and Ireland. T. and AD Poyser, London
Murray, S., Wanless, S. and Harris, M. (2014). The Bass Rock – now the world’s largest Northern Gannet colony. British Birds, 107, 765-769.
NatureScot. (2018). Citation For Special Protection Area (SPA) Site Description: Forth Islands (UK9004171) Including Marine Extension. NatureScot.
NatureScot. (2020a). Seasonal Periods for Birds in the Scottish Marine Environment. Short Guidance Note Version 2. NatureScot.
NatureScot. (2020b). Citation for Special Protection Area (SPA) Site Description: Outer Firth Of Forth and St Andrews Bay Complex (UK9020316). NatureScot.
NatureScot. (2021). Isle of May National Nature Reserve: Guillemots on the up! [Online]. Available at: https://isleofmaynnr.wordpress.com/2021/01/07/guillemots-on-the-up/ . Accessed 01 July 2022.
Nelson, B. (1966). The behaviour of the young Gannet. British Birds, 59(10), 393–419.
Nelson, B. (2006). Mean laying dates in the northern gannet. Scott Birds, 26, 50.
Newell, M., Wanless, S., Harris, M.P., Daunt, F. (2015). Effects of an extreme weather event on seabird breeding success at a North Sea colony. Mar. Ecol. Prog. Ser., 532, 257-268.
Newell, M., Harris, M.P., Wanless, S., Burthe, S., Bogdanova, M., Gunn, C.M. and Daunt, F. (2017). The Isle of May long-term study (IMLOTS) seabird annual breeding success 1982–2016. NERC Environmental Information Data Centre.
Newton, S.F., Thompson, K. and Mitchell, P.I. (2004). Manx Shearwater Puffinu puffinus. In: Mitchell, P.I., Newton, S.F., Ratcliffe, N. and Dunn, T.E. Seabird Populations of Britain and Ireland. T. and A. D. Poyser, London, 63-80.
Ollason, J.G., Bryant, A.D., Davis, P.M., Scott, B.E., Tasker, M.L. (1997). Predicted seabird distributions in the North Sea: the consequences of being hungry. ICES Journal of Marine Science, 54(4), 507-517.
Outram, B. and Steel, D. (2018). Isle of May National Nature Reserve Annual Report 2018. NatureScot.
Pakarinen R. and Jarvinen 0. (1984). The Red-throated Diver in Finland: an ecological population analysis of its status and population trends. Lintumies, 19, 46-54.
Parsons, M., Mitchell, I., Butler, A., Ratcliffe, N., Frederiksen, M., Foster, S., and Reid, J.B. (2008). Seabirds as indicators of the marine environment. ICES Journal of Marine Science, 65(8), 1520-1526.
Phillips, R.A., Petersen, M.K., Lilliendahl, K., Solmundsson, J., Hamer, K.C., Camphuysen, C.J. and Zonfrillo, B. (1999). Diet of the northern fulmar Fulmarus glacialis: reliance on commercial fisheries?. Marine Biology, 135(1), 159-170.
Rattiste, K. (2006). Life history of the common gull (Larus canus), A long-term individual-based study. PhD Thesis, Uppsala University.
Richards, C., Padget, O., Guilford, T. and Bates, A.E. 2019. Manx shearwater (Puffinus puffinus) rafting behaviour revealed by GPS tracking and behavioural observations. PeerJ, 7, p.e7863.
Rome, M.S. and Ellis, J.C. (2004). Foraging ecology and interactions between herring gulls and great black-backed gulls in New England. Waterbirds, 27(2), 200-210.
Ross-Smith, V.H., Robinson, R.A., Banks, A.N., Frayling, T.D., Gibson, C.C. and Clark, J.A. 2014. The lesser black-backed gull Larus fuscus in England: how to resolve a conservation conundrum. Seabird, 27, 41–61.
Ruffino, L., Thompson, D. and O’Brien, S. (2020). JNCC Report No:651 Black-legged kittiwake population dynamics and drivers of population change in the context of offshore wind development. ISSN 0963-8091, Peterborough.
Scotland’s Marine Assessment (2020). Seabirds. https://marine.gov.scot/sma/assessment/seabirds-0
Scott, B.E., Sharples, J., Ross, O.N., Wang, J., Pierce, G.J. and Camphuysen, C.J. (2010). Sub-surface hotspots in shallow seas: fine-scale limited locations of top predator foraging habitat indicated by tidal mixing and sub-surface chlorophyll. Marine Ecology Progress Series, 408, 207–226.
Scott, B.E., Langton, R., Philpott, E., and Waggit, J.J. (2014). Seabirds and marine renewables: are we asking the right questions? Marine Renewable Energy Technology and Environmental Interactions, 81-92.
Scott-Hayward, L.A.S., Oedekoven, C.S., Mackenzie, M.L., Walker, C.G. and Rexstad, E. (2013). User Guide for the MRSea Package: Statistical Modelling of bird and cetacean distributions in offshore renewables development areas. University of St. Andrews contract for Marine Scotland, SB9 (CR/2012/05).
Scottish Ornithologists’ Club (SOC). (2021). Online Scottish Bird Report (oSBR). [Online]. Available at: https://www.the-soc.org.uk/about-us/online-scottish-bird-report. Accessed 03/12/2021.
Seabird Monitoring Programme (SMP). (2021). Seabird Monitoring Programme Database. [Online]. https://app.bto.org/seabirds/public/index.jsp. Accessed 13/09/2021.
Shoji, A., Elliott, K., Fayet, A., Boyle, D., Perrins, C. and Guilford, T. (2015). Foraging behaviour of sympatric razorbills and puffins. Marine Ecology Progress Series, 520, pp.257-267.
Spencer, S.M. (2012). Diving behavior and identification of sex of breeding Atlantic puffins (Fratercula arctica), and nest-site characteristics of Alcids on Petit Manan Island, Maine. MS thesis, University of Massachusetts Amherst, Amherst, MA.
Stanbury, A., Eaton, M., Aebischer, N., Balmer, D., Brown, A., Douse, A., Lindley, P., McCulloch, N., Noble, D. and Win, I., 2021. The status of our bird populations: the fifth Birds of Conservation Concern in the United Kingdom, Channel Islands and Isle of Man and second IUCN Red List assessment of extinction risk for Great Britain. British Birds, 114, pp.723-747.
Statutory Nature Conservation Bodies. (2017). Joint SNCB Interim displacement advice notice, Advice on how to present assessment information on the extent and potential consequences of seabird displacement from Offshore Wind Ferm (OWF) developments. Statutory Nature Conservation Bodies.
Stone, C.J., Webb, A., Barton, C., Ratcliffe, N., Reed, T.C., Tasker, M.L., Camphuysen, C.J. and Pienkowski, M.W. (1995). An atlas of seabird distribution in north-west European waters. JNCC, Peterborough, ISBN 1 873701 94 2.
Stroud, D.A., Chambers, D., Cook, S., Buxton, N., Fraser, B., Clement, P., Lewis, I., McLean, I., Baker, H., Whitehead, S. (2001). The UK SPA Network: Its Scope and Content, vols. 1–3. JNCC, Peterborough.
Tasker, M.L., Webb, A., Hall, A.J., Pienkowski, M.W. and Langslow, D.R. (1987). Seabirds in the North Sea. Nature Conservation Council. Peterborough.
Tasker, M.L., Jones, P.H., Dixon, T.J. and Blake, B.F. (1984). Counting seabirds at sea from ships: a review of methods employed and a suggestion for a standardized approach. The Auk, 101, 567-577.
Tasker, M.L., Webb, A. and Matthews, J.M. (1991). A census of the large inland common gull colonies of Grampian. Scottish Birds, 16, 106-12.
Tasker, M. (1994). Common gull Larus canus. 288-9 in: Tucker, G.M. and Heath, M.F. (1994). Birds in Europe: Their Conservation Status. BirdLife Conservation Series No. 3, BirdLife International, Cambridge, UK.
Thaxter, C.B., and Burton, N.H.K. (2009). High definition imagery for surveying seabirds and marine mammals: a review of recent trials and development of protocols. British Trust for Ornithology Report Commissioned by Cowrie Ltd.
Thaxter, C.B., Wanless, S., Daunt, F., Harris, M.P., Benvenuti, S., Watanuki, Y., Grémillet, D. and Hamer, K.C. (2010). Influence of wing loading on the trade-off between pursuit-diving and flight in common guillemots and razorbills. The Journal of Experimental Biology, 213, 1018-1025.
Thaxter, C.B., Lascelles, B., Sugar, K., Cook, A.S.C.P., Roos, S., Bolton, M., Langston, R.H.W., and Burton, N.H.K. (2012). Seabird foraging ranges as a preliminary tool for identifying candidate Marine Protected Areas. Biological Conservation, 156, 53-61.
Thaxter, C.B., Ross-Smith, V.H. and Cook, A.S.C.P. (2016). How high do birds fly? A review of current datasets and an appraisal of current methodologies for collecting flight height data: Literature review. BTO Research Report No. 666.
Thompson, P.M. (2006). Identifying drivers of change: did fisheries play a role in the spread of North Atlantic Fulmars?. Conservation Biology Series, Cambridge. 12, 143.
Uhlmann, S.S., Ulrich, C. and Kennelly, S.J. (2019). The European Landing Obligation: Reducing Discards in Complex, Multi-Species and Multi-Jurisdictional Fisheries. Springer Nature, 431.
Vittery, A. (2001). Little gulls feeding in association with auks. Scottish Birds, 22, 107-108.
Votier, S. C., Bearhop, S., Ratcliffe, N., Phillips, R. A., and Furness, R. W. (2004). Predation by great skuas at a large seabird colony. Journal of Applied Ecology, 41, 1117–1128.
Votier, S.C., Bearhop, S., Fyfe, R. and Furness, R.W. (2008). Temporal and spatial variation in the diet of a marine top predator: links with commercial fisheries. Mar. Ecol. Prog. Ser., 367, 223–232
Waggitt, J.J., Cazenave, P.W., Howarth, L.M., Evans, P.G.H., van der Kooij, J., Hiddink, J.G. (2018). Combined measurements of prey availability explain habitat selection in foraging seabirds. Biol. Lett. 14, 20180348.
Wakefield, E.D., Owen, E., Baer, J., Carroll, M.J., Daunt, F., Dodd, S.G., Green, J.A., Guilford, et al. (2017). Breeding density, fine-scale tracking, and large-scale modelling reveal the regional distribution of four seabird species. Ecological Applications, 27(7), 2074-2091.
Wakefield, E.W., Owen, E., Baer, J., Daunt, F., Dodd, L.S., Green, J.A., Guildford, T., Mavor, R., et al. (2019). Erratum to Wakefield et al. 2017. Breeding density, fine‐scale tracking, and large‐scale modelling reveal the regional distribution of four seabird species. Ecological Applications. 27:2074–2091. Ecological Applications, 29(3), 2019, e01885.
Walker, C. MacKenzie, M. L. Donovan, C. R. and O' Sullivan, M. (2011). SALSA – A Spatially Adaptive Local Smoothing Algorithm. Journal of Statistical Computation and Simulation, 81, 2.
Wanless, S. and Harris, M. (1997). Successful Double-Brooding in European Shags. Colonial Waterbirds, 20(2), 291–294.
Wanless, S., Harris, M.P. and Greenstreet, S.P.R. (1998). Summer sandeel consumption by seabirds breeding in the Firth of Forth, south-east Scotland. ICES Journal of Marine Science, 55, 1141-1151.
Wanless, S., Frederiksen, M., Walton, J., and Harris, M.P. (2009). Long-term changes in breeding phenology at two seabird colonies in the western North Sea. Ibis, 151, 274–285.
Wanless, S., Harris, M. P., Newell, M. A., Speakman, J. R., Daunt, F. (2018). Community-wide decline in the occurrence of lesser sandeels Ammodytes marinus in seabird chick diets at a North Sea colony. Marine Ecology Progress Series, 600, 193-206.
Webb, A. and Nehls, G. (2019). Chapter 3 Surveying seabirds.
Weiss, F., Buettger, H., Baer, J., Welcker, J. and Nehls, G. (2016). Erfassung von Seevögeln und Meeressäugetieren mit dem HiDef Kamerasystem aus der Luft. Seevögel, 37(2), 14–21.
Wernham, C.V., Toms, M.P., Marchant, J.H., Clark, J.A., Siriwardena, G.M. and Baillie, S.R. (2002). The Migration Atlas: movements of the birds of Britain and Ireland. T. and A.D. Poyser, London.
Woodard, I., Thaxter, C. B., Owen, E. and Cook, A. S. C. P. (2019). Desk-based revision of seabird foraging ranges used for HRA screening. BTO research report number 724
Annex A To The Ornithology Baseline Technical Report: Scientific Names And Taxonomic Groupings
Annex A To The Ornithology Baseline Technical Report: Scientific Names And Taxonomic Groupings
Full Annex provided in separate document.
Annex B To The Ornithology Baseline Technical Report: Design-Based Analysis – MoNthly Population Estimates (Berwick Bank Development Area Plus 16km Buffer)
Open ▸Annex B To The Ornithology Baseline Technical Report: Design-Based Analysis – MoNthly Population Estimates (Berwick Bank Development Area Plus 16km Buffer)
Full Annex provided in separate document.
Annex C To The Ornithology Baseline Technical Report: Design-Based Analysis – Population Estimates For All Birds Grouped By Species (Berwick Bank Development Area Plus 16km Buffer)
Open ▸Annex C To The Ornithology Baseline Technical Report: Design-Based Analysis – Population Estimates For All Birds Grouped By Species (Berwick Bank Development Area Plus 16km Buffer)
Full Annex provided in separate document.
Annex D To The Ornithology Baseline Technical Report: Design-Based Analysis – Population Estimates For Flying Birds Grouped By Species (Berwick Bank Development Area Plus 16km Buffer)
Open ▸Annex D To The Ornithology Baseline Technical Report: Design-Based Analysis – Population Estimates For Flying Birds Grouped By Species (Berwick Bank Development Area Plus 16km Buffer)
Full Annex provided in separate document.
Annex E To The Ornithology Baseline Technical Report: Design-Based Analysis – Population Estimates For Sitting Birds Grouped By Species (Berwick Bank Development Area Plus 16km Buffer)
Open ▸Annex E To The Ornithology Baseline Technical Report: Design-Based Analysis – Population Estimates For Sitting Birds Grouped By Species (Berwick Bank Development Area Plus 16km Buffer)
Full Annex provided in separate document.
Annex F To The Ornithology Baseline Report: Design-Based Analysis – Adjusted Monthly Population Estimates (Berwick Bank Development Plus 16km Buffer) For Auks
Open ▸Annex F To The Ornithology Baseline Report: Design-Based Analysis – Adjusted Monthly Population Estimates (Berwick Bank Development Plus 16km Buffer) For Auks
Full Annex provided in separate document.
Annex G To The Ornithology Baseline Technical Report: Design-Based Analysis – Monthly Population Estimates (Berwick Bank Development Area Only)
Open ▸Annex G To The Ornithology Baseline Technical Report: Design-Based Analysis – Monthly Population Estimates (Berwick Bank Development Area Only)
Full Annex provided in separate document.
Annex H To The Ornithology Baseline Technical Report: Design-Based Analysis – Population Estimates For All Birds Grouped By Species (Berwick Bank Development Area Only)
Open ▸Annex H To The Ornithology Baseline Technical Report: Design-Based Analysis – Population Estimates For All Birds Grouped By Species (Berwick Bank Development Area Only)
Full Annex provided in separate document.
Annex I To The Ornithology Baseline Technical Report: Design-Based Analysis – Population Estimates For Flying Birds Grouped By Species (Berwick Bank Development Area Only)
Open ▸Annex I To The Ornithology Baseline Technical Report: Design-Based Analysis – Population Estimates For Flying Birds Grouped By Species (Berwick Bank Development Area Only)
Full Annex provided in separate document.
Annex J To The Ornithology Baseline Technical Report: Design-Based Analysis – Population Estimates For Sitting Birds Grouped By Species (Berwick Bank Development Area Only)
Open ▸Annex J To The Ornithology Baseline Technical Report: Design-Based Analysis – Population Estimates For Sitting Birds Grouped By Species (Berwick Bank Development Area Only)
Full Annex provided in separate document.
Annex K To The Ornithology Baseline Technical Report: Design-Based Analysis – Adjusted Monthly Population Estimates (Berwick Bank Development Area Only) For Auk Species
Open ▸Annex K To The Ornithology Baseline Technical Report: Design-Based Analysis – Adjusted Monthly Population Estimates (Berwick Bank Development Area Only) For Auk Species
Full Annex provided in separate document.
Annex L To The Ornithology Baseline Technical Report: model-based analysis using MRSEA: abundance estimates and density surfaces
Open ▸Annex L To The Ornithology Baseline Technical Report: model-based analysis using MRSEA: abundance estimates and density surfaces
Full Annex provided in separate document. Open ▸
[1] The proportion of urban gulls (roof nesting) was compared to the total population in Scotland from Seabird 2000. This resulted in a correction of 8% that was used to correct the total count of birds at SPAs. Information accessed from: Review of Urban Gulls and their Management in Scotland (www.gov.scot)
[2] The proportion of urban gulls (roof nesting) was compared to the total population in Scotland from Seabird 2000. This resulted in a correction of 17% that was used to correct the total count of birds at SPAs. Information accessed from: Review of Urban Gulls and their Management in Scotland (www.gov.scot)