

1 INTRODUCTION
Contemporary ornithological baseline monitoring (2019-2021) has been undertaken to inform the EIA process for Berwick Bank Wind Farm using digital video aerial surveys completed by HiDef Aerial Surveying Ltd. In order to supplement the baseline data, a suite of boat-based surveys have been carried out with the primary aim of collecting flight height data from the Berwick Bank Wind Farm area to inform and support the EIA.
The previous boat-based surveys carried out in 2009 to 2011 in the Firth of Forth Round 3 Zone (Seagreen 2012a,b) followed a modified European Seabirds at Sea (ESAS) protocol and recorded bird flight heights in three height bands (<20 m, 20 m to 100 m and >120 m) to reflect positions of birds below, at and above the rotor swept height of candidate wind turbines under consideration at that time. Whilst useful to determine the overall proportion of flight activity below 20 m, these bands do not however, directly reflect the potential rotor swept heights of modern or future wind turbine technology. Further boat-based surveys have therefore been undertaken to collect site-specific flight height and behavioural data to inform the Berwick Bank collision risk modelling (CRM).
This report details the methods and results of the 2020 and 2021 boat-based surveys for Berwick Bank Wind Farm.
2 Methods
2 Methods
2.1.1 Survey Design
Boat-based surveys were carried out by ECON Ecological Consultancy Ltd (ECON hereafter) and RPS in the breeding season in 2020 and 2021. Surveys were planned to start in June 2020; however, due to the COVID-19 outbreak, they were started in July 2020 and continued monthly in August 2020 and in April, May and June 2021.
The survey in 2020-2021 followed a modified methodology based on COWRIE recommendations (Camphuysen et al., 2004) for ornithological surveys of wind farms that stems from the ESAS protocol (see Tasker et al., 1984, Webb & Durinck, 1992), as utilised for the previous boat-based surveys in the Firth of Forth Round 3 Zone (Seagreen, 2012a,b, 2018). Surveys were undertaken from the Artemis (IMO reference 9119713), a 28 m Scottish Fisheries Federation vessel which provides a suitable viewing platform and meets the vessel requirements as set out by COWRIE (Camphuysen et al., 2004).
Methodological modifications involved repeatedly sampling locations along a continuous transect route throughout the day, broadly following the method documented in Embling et al. (2012). The survey design for Berwick Bank consisted of four survey sites ( Figure 2.1 Open ▸ ), with each site having two parallel 15 km line transects separated by a 3 km gap. The sites were selected based on the analysis of the baseline boat-based survey data from Seagreen Phase 1 baseline surveys (2009-2011) (and prior to the redesign of the Berwick Bank project as detailed in the October 2021 Scoping Report) to achieve good representative spatial coverage across the site. Each 15 km transect was surveyed at approximately 8 knots, which took around one hour to complete and it took approximately 2.5 hours to complete the survey site and return to the start location. The cross lines between the two transects were not surveyed to ensure the lines remained independent, that there were no variations in survey effort or overlap and that there was the consistent orientation of survey lines.
Figure 2.1 Boat-based transect routes to survey the four sites. At the time of survey, sites were known as Berwick Bank (sites 1 and 2) and Marr Bank (sites 3 and 4).
Each survey site ( Figure 2.1 Open ▸ ) was repeatedly surveyed over the course of one day, aiming for four repetitions at dawn, morning, afternoon and ending in the evening, with each site surveyed once a month in July and August 2020 and April, May and June 2021, in order to cover the core breeding period of the sensitive seabird receptors. The amount of time between repeat transect runs varied due to the amount of daylight hours, with the time between runs used to collect additional flight height data using the rangefinder and for convenience breaks for the surveyors. On some days, adverse weather constraints prevented full coverage of four survey repetitions.
Transects were consistently surveyed in a clockwise direction to ensure continuity in snapshots between surveys. However, the start location was varied between surveys to try to prevent potential bias associated with the position along the transect. The order in which these four survey sites were visited was randomly selected to again ensure consistency with the previous surveys of the Firth of Forth Round 3 Zone in 2009-2011 and surveys of Seagreen Phase 1 in 2017. The exact timing of surveys within each month were determined by the first identified ‘window’ of suitable weather forecasted.
The use of two surveyors, one either side of the vessel, and a dedicated data recorder for all surveys enabled the repeat sampling of sites throughout the day between sunrise and sunset and allowed investigation of any changes in bird densities to occur. All data collected were then considered for use in Distance analysis of observations of birds on the water (Buckland et al., 2001).
2.2 Data Collection
2.2 Data Collection
Birds in flight were quantified through radial snapshots at pre-determined locations, and birds on the water used the line transect method. Birds in flight were also recorded continuously throughout the survey. All birds were assigned to distance bands perpendicular from the boat noting the side of the vessel (port or starboard); A: 0-50 m, B: 50-100 m, C: 100-200 m, D: 200-300 m, E: >300 m. Distance bands A to D were classed as within transect, band E was outside the transect. Sea state, wind speed and direction and subjective surveyor defined visibility scores were also recorded throughout the surveys.
Age and plumage data were also collected as part of the standard survey design to enable partitioning of birds to (presumed) breeding and non-breeding groups. Birds were aged by calendar year from 1 to 6 and all observed plumage characteristics were noted.
As it is not deemed possible to consistently separate non-breeding adult auks from advanced juvenile birds from at-sea observations, auk species in the breeding season that are not in summer (breeding) plumage and not obviously non-adult, were noted as being in winter plumage.
In addition to age and plumage, the following information was recorded and described for individual or grouped records whenever possible:
- All interactions with other birds (of defined species) and/or marine mammals;
- Any perceptible behaviour (e.g., sleeping, preening);
- Interactions with the survey vessel or any other vessel (e.g., escape diving or circling);
- Foraging or feeding activity and interactions, including within defined and described mixed species feeding aggregations (MSFA);
- Presence of post-feeding aggregations;
- Birds carrying fish (with fish being identified to the lowest taxonomic rank possible); and
- Associations with features of interest such as tidal fronts, upwellings, currents, detritus, flotsam and jetsam etc.
Every effort was made to record as much behavioural detail as possible, especially in relation to foraging but also other behaviours such as chick guarding etc (see Camphuysen et al., 2004). However, it must be noted that at times, high densities of birds can make fine scale recording of behaviours at the individual level impossible. In these cases, broad categorisations are applied, often to grouped birds of the same species with shared characteristics (e.g., distance band, flight height and direction etc).
To shed light on the potential environmental factors that can contribute to ecosystem functioning within the Berwick Bank wind farm area, a low-cost monitoring solution to provide continuous measurements of surface waters was utilised. A Star Oddi conductivity temperature depth (CTD) instrument (3-37 mS/cm, 1-1000m) was deployed and towed at the surface to monitor water temperature, salinity, and conductivity at a measured depth (results are provided within Appendix 4).
2.2.1 Flight Height
Flight height data collection followed the methods applied during the surveys of the Seagreen Phase 1 Wind Farm in 2017 (Seagreen, 2018) and published by Harwood et al. (2018). All surveyors visually estimated flight heights of all birds seen in snapshots or line transect in 5 m bands (i.e., >0-5, >5-10, >10-15, etc). Surveyors also utilised optical laser rangefinders (Nikon Forestry Pro II) to provide flight height measurements when they were not surveying the line transect or if very few birds were present. Both data sets were analysed to derive flight height distributions for comparison with each other and with the generic flight height distribution published by Johnston et al. (2014). All surveyors received training in the correct use of the rangefinders prior to the start of the surveys.
The survey team included a dedicated surveyor tasked with collecting as many rangefinder flight height observations as possible. To increase the capacity for rangefinder flight height observations, two additional laser rangefinders were used opportunistically by the other observers in the survey team. However, surveyors always prioritised the basic line transect survey to ensure that that bird abundances were not underestimated. Where possible, a GPS waypoint was associated with records to allow spatial referencing.
The dedicated rangefinder operator continually scanned for potential seabird targets. As soon as a potential target bird appeared, attempts were made to measure its flight height. The rangefinder operator aimed to take a measurement of every bird that came into range of the instrument (the Nikon Forestry Pro II has a published measurement range of 7.5 – 1,600 m); most birds were targeted up to approximately 400 distance, with infrequent measurements of birds up to 1 km away and two exceptional records up to approximately 2 km away. Due to discrepancies in size, the range at which larger species such as gannet or great black-backed gull can be measured is greater than that for smaller species such as terns (larger species could be detected up to 1 km horizontal distance, whereas smaller species were recorded within 400 m from the boat). When a range of species were present, preference was given to kittiwake and gannet, the key species to be assessed using CRM. However, due to those species occurring so frequently and being well represented in the data, novel species (e.g. terns and skuas) were also selected if the opportunity arose. Typically, there were relatively few potential targets available at any one time, so data were collected for most birds that came within range. However, when swamping occurs the primary objective was to acquire as many verified flight heights as possible and targets deemed most likely to yield data were selected (i.e. that can be easily targeted with the rangefinder).
2.3 Data Analysis
2.3 Data Analysis
2.3.1 Abundance
Seabird density estimates were derived using Distance analysis on the visual observational data to account for birds undetected during the boat-based surveys (due to detection decreasing with increasing distance from the transect line; Buckland et al., 2001). Distance analysis was carried out on the observed counts for the five species: kittiwake, gannet, guillemot, razorbill and puffin. This analysis was carried out in R Studio (R Core Team, 2021), using the Distance package (Miller, 2019) and involved fitting either half-normal or hazard-rate detection functions, the model chosen based on Akaike’s Information Criterion (AIC) score (Miller et al., 2019).
Additionally, as auk species dive underwater to forage, birds are likely to be missed during the surveys and so a correction factor was applied to sitting guillemot, razorbill and puffin to account for this. The correction factor for each species were taken from Thaxter et al. (2010), with the correction factor derived from time spent under water during the chick-rearing stage. The correction factor used for guillemot sitting on the sea surface was 1.375, razorbill 1.174, and puffin 1.1416.
To generate densities across the survey sites, once distance corrected and adjusted for missed auk species, abundances were divided by the total number of cells and snapshots surveyed by each site: snapshots were conducted at 500 m intervals (~ 2-minute intervals) rather than timed along the specified transect lines, thereby compensating for any changes in vessel speed according to variable currents or sea state within and between surveys, with all transects designed to be divisible into complete 500 m cells (sites therefore contained 60 cells).
2.3.2 Flight Height
Following Cook et al. (2018), Normal, log-normal, gamma, normal-mixture and gamma-mixture distribution were fitted to the rangefinder data using the mixtools (Benaglia et al., 2009) and fitdistrplus (Delignette-Muller and Dutang, 2015) packages in the R statistical package (R Core Team, 2021). The best fitting distribution was selected based on visual appraisal (Appendix 1).
From the visual observation height estimates, the proportion of records in each 5 m height band were categorised, which will allow an overall estimate of the proportion of birds deemed to be below and at rotor-swept height for use in CRM.
All flight heights were corrected to account for variation in observer eye height. The negative values arising from this analysis were due to variations in swell height influencing the eye height of the observer and for the purposes of this initial analysis were corrected to 1 m above sea level as they will be low-flying birds.
To investigate if distance from the boat had an influence on observed flight heights, flight heights from both rangefinder and surveyor flight height estimates were compared against distance of the observation from the boat. This was done to examine if the presence of the vessel potentially had an influence on the flight heights being recorded (e.g., if birds fly lower when close to the boat, flight heights could be underestimated); species such as kittiwake may be attracted to the boat (Wahl and Heinemann, 1979). Seabirds also often display Area Restricted Search (ARS) behaviour (whereby they increase sinuosity and reduce speed in specific areas; Hill et al., 2000) near fishing boats, often foraging behind them (Votier et al., 2004). By comparing flight height against distance, it can provide insight into whether those flight heights recorded are associated with such behaviour and hence maybe influence the distribution of flight heights being recorded.
3 Results
3 Results
3.1.1 Surveys
Table 3.1 to Table 3.5 provide details of the dates, timing and conditions of each survey in July and August 2020 and April, May and June 2021.
Table 3.1 Daily survey effort and summary of weather conditions for July 2020 boat-based surveys
| 2/7/2020 | 3/7/2020 | 4/7/2020 | 5/7/2020 | 6/7/2020 |
Site | 1 | 3 | 2 | 4 | 4 |
Run 1 start time | 04:27:13 | 04:32:43 | 04:25:22 | 10:05:10 | 04:32:34 |
Run 1 end time | 07:05:40 | 07:11:30 | 06:55:51 | 12:44:10 | 07:18:34 |
Run 2 start time | 08:01:41 | 09:39:15 | 09:28:56 | 16:07:15 | - |
Run 2 end time | 10:28:57 | 12:16:11 | 12:00:47 | 18:58:00 | - |
Run 3 start time | 11:02:43 | 14:29:40 | 14:24:11 | 19:24:00 | - |
Run 3 end time | 13:30:28 | 17:06:12 | 17:03:34 | 22:04:30 | - |
Run 4 start time | 14:46:10 | 18:27:18 | 18:24:11 | - | - |
Run 4 end time | 17:30:46 | 21:08:03 | 21:01:19 | - | - |
Run 5 start time | 18:44:15 | N/A | N/A | N/A | N/A |
Run 5 end time | 21:18:57 | N/A | N/A | N/A | N/A |
Total survey time | 12:52:46 | 10:33:00 | 10:18:51 | 8:10:15 | 2:46:00 |
Line transect distance | 150 km | 120 km | 120 km | 90 km | 30 km |
Total snapshots surveyed | 293 | 231 | 240 | 79 | 58 |
Weather conditions | Fair | Poor, rain | Fair - good | Fair, windy | Fair |
Wind direction | NE, ENE, SE | S, SE, SW, W | SW, E, VAR, S | WSW, W, SW | WSW, W, NW |
Wind speed (knots) | 5-10 | 10 - 15 | 5-13 | 20-28 | 20-15 |
Sea state | 1-3 | 2-4 | 1-2 | 4-6 | 2-4 |
Swell | 1.2-1.5 m | 1.5 m | 1.0-1.2 m | 1.0-2.5 | 0.8-1.0 |
Precipitation | 0 | 0-4 | 0-2 | 0-3 | 0 |
Comments |
| Modified approach to sample 4 ‘runs’ due to health and safety concerns regarding fatigue. |
| Weathered off in the morning and early afternoon by 35 knot winds and wave heights of >4 m |
|
Table 3.2 Daily survey effort and summary of weather conditions for August 2020 boat-based surveys
| 6/8/2020 | 7/8/2020 | 8/8/2020 | 9/8/2020 |
Site | 4 | 2 | 3 | 1 |
Run 1 start time | 05:18:45 | 05:19:15 | 05:17:51 | 05:17:43 |
Run 1 end time | 07:55:59 | 07:59:47 | 07:53:39 | 07:57:36 |
Run 2 start time | 09:58:22 | 09:43:22 | 09:43:59 | 09:43:08 |
Run 2 end time | 12:38:04 | 12:22:04 | 12:21:57 | 12:24:46 |
Run 3 start time | 14:04:17 | 13:51:00 | 13:43:57 | 13:53:01 |
Run 3 end time | 16:39:09 | 16:38:54 | 16:25:44 | 16:42:05 |
Run 4 start time | 18:35:23 | 17:43:08 | 17:44:18 | 17:44:14 |
Run 4 end time | 21:20:02 | 20:26:01 | 20:24:54 | 20:30:09 |
Total survey time | 10:36:27 | 10:50:01 | 10:36:09 | 10:56:30 |
Line transect distance | 120 km | 120 km | 120 km | 120 km |
Total snapshots surveyed | 240 | 237 | 237 | 240 |
Weather conditions | Fair-Good | Fair-Good | Good | Good |
Wind direction | W, WSW, SW, S, SE | SW, S, SE, SW | W, NE, E, NW, N, E | NE, E, ENE, E |
Wind speed (knots) | 3-17 | 8-15 | 3-13 | 11-14 |
Sea state | 1-3 | 1-3 | 1-2 | 2-3 |
Swell | 0.3-1.0 | 0.25-0.8 | 0.25-0.75 | 0.5-1.2 |
Precipitation | 0 | 0 | 0 | 0 |
Table 3.3 Daily survey effort and summary of weather conditions for April 2021 boat-based surveys
| 7/4/2021 | 8/4/2021 | 9/4/2021 | 10/4/2021 |
Site | 1 | 2 | 3 | 4 |
Run 1 start time | 14:51:29 | 06:16:21 | 05:58:13 | 06:00:26 |
Run 1 end time | 17:36:25 | 09:13:06 | 08:34:19 | 08:42:29 |
Run 2 start time | 18:25:20 | 10:18:19 | 09:30:14 | 09:31:19 |
Run 2 end time | 19:44:05 | 13:31:27 | 12:28:23 | 12:04:21 |
Run 3 start time | - | 14:01:23 | 13:10:00 | 13:12:33 |
Run 3 end time | - | 16:02:59 | 15:50:42 | 15:53:21 |
Run 4 start time | - | - | 16:29:34 | 16:57:54 |
Run 4 end time | - | - | 19:05:52 | 19:38:12 |
Total survey time | 3:48:13 | 7:16:39 | 10:51:15 | 10:36:11 |
Line transect distance | 45 km | 77 km | 120 km | 120 km |
Total snapshots surveyed | 93 | 165 | 214 | 246 |
Weather conditions | Fair | Dry, Windy | Fair, Sunny, Snow | Clear, Dry, Light snow, Heavy snow |
Wind direction | NE, NW | SW | NW, W | NW, N |
Wind speed (knots) | 10-15 | 25-30 | 12-27 | 2-20 |
Sea state | 3-4 | 4-6 | 4-6 | 2-3 |
Swell | 3-4 | 1.5-4 | 1.25-2.5 | 1-1.5 |
Precipitation | 0 | 0-5 | 0-7 | 0 / Snow |
Comments | Due to a 5m swell and associated wind speed of 39 knots from the north-west, surveys in the morning were unfortunately weathered off. However, the wind and sea conditions improved from c.13:30 allowing afternoon surveys to take place. Water quality monitoring kit was not taken on board and therefore readings could not be recorded. Following completion of the third run at 19:44, surveying finished for the day and the vessel set sail for the south-eastern site. | Due to 35 knots (gusting to 40knots) from the south-west, surveys were weathered off at 16:03 halfway down the 6th line on the end of the 3rd run. | Conditions improved through the day. Poor at first, north-west wind 25 knots and sea state 5-6. Good conditions in the afternoon, with wind dropping to 12-18 knots and going west. Snow showers and sunny spells. | Conditions mostly good. North-west winds 15 knots dropped to 3 knots then 20 knots and squalls (heavy snow) on final run. Visibility generally good to excellent all day. |
Table 3.4 Daily survey effort and summary of weather conditions for May 2021 boat-based surveys
| 5/5/2021 | 6/5/2021 | 7/5/2021 | 8/5/2021 |
Site | 1 | 3 | 2 | 4 |
Run 1 start time | 14:46:55 | 05:22:04 | 05:25:22 | 05:21:51 |
Run 1 end time | 17:31:13 | 07:52:50 | 07:54:03 | 07:51:23 |
Run 2 start time | 18:45:31 | 09:33:22 | 09:50:38 | 09:35:38 |
Run 2 end time | 21:19:20 | 12:05:05 | 12:23:47 | 12:12:34 |
Run 3 start time | - | 13:49:39 | 13:49:44 | - |
Run 3 end time | - | 16:26:30 | 16:14:04 | - |
Run 4 start time | - | 18:10:47 | 17:55:44 | - |
Run 4 end time | - | 20:40:38 | 20:15:05 | - |
Total survey time | 5:18:07 | 10:09:11 | 9:45:31 | 5:06:28 |
Line transect distance | 60 km | 120 km | 120 km | 60 km |
Total snapshots surveyed | 124 | 247 | 244 | 124 |
Weather conditions | Dry, Fair | Fair, Good | Fair, Good | Fair |
Wind direction | N, NW, SW, S | SW, W, NW | NW, S, SW, W | SE, SW |
Wind speed (knots) | 6-28 | 5-22 | 5-20 | 17-26 |
Sea state | 3-4 | 2-4 | 2-4 | 2-5 |
Swell | 2-2.5 | 1-2 | 1.5-2 | 1-2 |
Precipitation | 0-1 | 0-2 | 0 | 0 |
Comments | Due to a 3m+ swell and associated wind speed of 28 knots from the north-west, surveys in the morning were weathered off at around 04:30. However, the wind and sea conditions improved from around 14:45 allowing afternoon surveys to take place, with winds changing from the north-west (15 knots) to the south-west (8 knots) . Sea state during the surveys was 3-4 with a 2-3m swell. Water monitoring surface tag was deployed. |
|
| Due to bad weather the boat surveys were weathered off after two runs due to 40 knot wind from the south-east with 5m+ swell. |
Table 3.5 Daily survey effort and summary of weather conditions for June 2021 boat-based surveys
| 9/6/2021 | 10/6/2021 | 11/6/2021 | 12/6/2021 |
Site | 3 | 2 | 1 | 4 |
Run 1 start time | 04:06:02 | 04:02:10 | 04:10:30 | 04:23:05 |
Run 1 end time | 06:43:11 | 06:40:00 | 06:45:35 | 07:02:02 |
Run 2 start time | 09:07:29 | 09:03:35 | 09:01:30 | 10:01:15 |
Run 2 end time | 11:36:42 | 11:41:50 | 11:38:46 | 12:30:00 |
Run 3 start time | 14:07:00 | 14:03:35 | 14:01:55 | 13:58:25 |
Run 3 end time | 16:38:10 | 16:40:15 | 16:42:35 | 16:21:53 |
Run 4 start time | 18:31:00 | 18:46:50 | 18:56:23 | 17:58:46 |
Run 4 end time | 21:11:55 | 21:20:40 | 21:36:38 | 20:35:20 |
Total survey time | 10:18:27 | 10:26:35 | 10:32:01 | 10:07:44 |
Line transect distance | 120 km | 120 km | 120 km | 120 km |
Total snapshots surveyed | 225 | 245 | 246 | 239 |
Weather conditions | FAIR, SUNNY | FAIR, SUNNY | FAIR, WINDY | FAIR |
Wind direction | S, SW, SSW | SW, WSW | S,SW,W | SW, S |
Wind speed (knots) | 5-17 | 11-29 | 8-25 | 13-23 |
Sea state | 2-3 | 2-4 | 3-4 | 3-4 |
Swell | 0.5-1 | 0.75-1.5 | 0.75-1.5 | 0.5-1.5 |
Precipitation | 0 | 0-1 | 0 | 0-1.8 |
Comments |
|
| Second data logger was lost. Exact circumstances unknown but appears the cable may have rubbed against the hull and snapped. |
|
3.1.2 Abundances
A total of 47,777 birds were recorded in distance bands A-D during the 2020-2021 boat-based surveys, comprising 40 identified species. The five key species accounted for 86.83% of all records: kittiwake (23.67%); gannet (16.12%); guillemot (32.09%); razorbill (9.68%); and puffin (7.26%). The majority of birds were recorded within the western survey sites 3 and 4 of the Berwick Bank project area (61.12%) compared to eastern survey sites 1 and 2 (38.88%). This is likely due to sites 3 and 4 within Berwick Bank being in closer proximity to coastal breeding colonies. Table 3.6 shows the total monthly records of each species at each survey site; for individual monthly breakdowns, see Appendix 2.
A large portion of Arctic tern were present during the August surveys (see Appendix 2, Table 4.1), specifically in site 3 of the Berwick Bank project area. High abundances are likely the result of post-breeding dispersal movements from their breeding colonies along the east coast.
Table 3.6 Total observations of all bird species in Distance Bands A-D with repeat sightings excluded
Species | Site 1 | Site 2 | Site 3 | Site 4 | Total |
|---|---|---|---|---|---|
Arctic Skua | 2 | 0 | 1 | 0 | 3 |
Arctic Tern | 114 | 361 | 489 | 2565 | 3529 |
Unidentified Auk species | 8 | 14 | 94 | 70 | 186 |
Black-headed Gull | 0 | 0 | 1 | 0 | 1 |
Collared Dove | 0 | 1 | 1 | 0 | 2 |
Common Gull | 10 | 2 | 3 | 2 | 17 |
Common Scoter | 0 | 0 | 0 | 1 | 1 |
Common Tern | 0 | 1 | 0 | 0 | 1 |
Curlew | 0 | 0 | 5 | 5 | 10 |
Fulmar | 144 | 160 | 128 | 141 | 573 |
Gannet | 1570 | 1484 | 2146 | 2504 | 7704 |
Golden Plover | 1 | 0 | 0 | 0 | 1 |
Great Black-backed Gull | 10 | 23 | 10 | 6 | 49 |
Great Skua | 3 | 1 | 6 | 2 | 12 |
Guillemot | 2601 | 4560 | 3333 | 4839 | 15333 |
Herring Gull | 103 | 204 | 192 | 197 | 696 |
Kittiwake | 1234 | 3220 | 3741 | 3113 | 11308 |
Large Gull species | 0 | 0 | 1 | 0 | 1 |
Lesser Black-backed Gull | 43 | 38 | 57 | 41 | 179 |
Little Gull | 0 | 0 | 0 | 1 | 1 |
Manx Shearwater | 3 | 4 | 7 | 8 | 22 |
Meadow Pipit | 0 | 0 | 0 | 2 | 2 |
Pink-footed Goose | 0 | 0 | 0 | 2 | 2 |
Puffin | 606 | 835 | 1276 | 752 | 3469 |
Razorbill | 632 | 573 | 1067 | 2353 | 4625 |
Redshank | 0 | 0 | 11 | 0 | 11 |
Red-breasted Merganser | 0 | 0 | 1 | 1 | 2 |
Sabine's Gull | 0 | 0 | 1 | 0 | 1 |
Sandwich Tern | 1 | 0 | 0 | 0 | 1 |
Sooty Shearwater | 0 | 0 | 1 | 1 | 2 |
Sedge Warbler | 0 | 0 | 0 | 1 | 1 |
Skylark | 0 | 1 | 0 | 0 | 1 |
Storm Petrel | 4 | 0 | 1 | 0 | 5 |
Swallow | 1 | 0 | 0 | 0 | 1 |
Swift | 2 | 1 | 1 | 0 | 4 |
Teal | 0 | 0 | 14 | 0 | 14 |
Tern species | 0 | 0 | 1 | 0 | 1 |
Tree Pipit | 0 | 0 | 1 | 0 | 1 |
Turnstone | 0 | 2 | 1 | 1 | 4 |
Whimbrel | 0 | 0 | 0 | 1 | 1 |
To estimate the densities for each key species within each survey area ( Figure 2.1 Open ▸ ), adjusted counts from Distance analysis were apportioned down to cell size estimates, with cell sizes derived from all snapshots considered in any month. Table 3.7 shows the number of cells covered by each survey run.
Table 3.7 Number of cells each month taken from the number of snapshots surveys at each site.
Survey Site / Transect Run | Survey Month | ||||
|---|---|---|---|---|---|
July 2020 | August 2020 | April 2021 | May 2021 | June 2021 | |
Site 1 |
|
|
|
|
|
1 | 58 | 60 | 0 | 0 | 44 |
2 | 60 | 58 | 0 | 0 | 40 |
3 | 56 | 58 | 34 | 52 | 50 |
4 | 60 | 60 | 24 | 44 | 50 |
5 | 56 | 0 | 0 | 0 | 0 |
Site 2 |
|
|
|
|
|
1 | 60 | 60 | 42 | 50 | 54 |
2 | 60 | 58 | 44 | 44 | 58 |
3 | 60 | 60 | 36 | 54 | 60 |
4 | 60 | 58 | 0 | 60 | 56 |
Site 3 |
|
|
|
|
|
1 | 54 | 60 | 46 | 52 | 42 |
2 | 60 | 60 | 46 | 48 | 48 |
3 | 60 | 60 | 20 | 52 | 40 |
4 | 56 | 60 | 32 | 38 | 50 |
Site 4 |
|
|
|
|
|
1 | 54 | 60 | 36 | 48 | 40 |
2 | 60 | 60 | 36 | 38 | 48 |
3 | 56 | 60 | 48 | 0 | 52 |
4 | 58 | 60 | 44 | 0 | 50 |
Figure 3.1 to Figure 3.5 below, shows the densities across each survey region for each of the five key seabird species, highlighting the differing densities dependent on the time of day. Time of day was derived from site survey times shown in Table 3.1 to Table 3.5.
The above results show that the highest abundances of all five key species were observed in July and August. Overall there were greater abundances of each species in the western half of the Berwick Bank wind farm area (sites 3 and 4) than in the eastern half (sites 1 and 2), likely due to the closer proximity to coastal breeding colonies. There was no clear pattern between time of day and seabird abundances.
3.1.3 Flight Analysis
This section provides details of the flight heights of birds estimated visually by the surveyors.
Out of the five key species ( Figure 3.6 Open ▸ ), only gannet and kittiwake were observed to be flying more than 40% of the time in all months. Auk species (guillemot and razorbill) moult for a period of several weeks in July and August, becoming flightless during this time (Mitchell et al., 2004). This is reflected in the number of guillemot and razorbill recorded flying in the July and August 2020 surveys.
Figure 3.6 Key species percentages on the water and in flight recorded during the 2020-2021 boat-based surveys.
3.1.3.1 Flight Direction
Overall, the dominant flight direction for each of the five most abundant species (kittiwake, gannet, guillemot, razorbill and puffin) were similar for guillemot, gannet, kittiwake and puffin (south-west/west; Figure 3.7 Open ▸ ), likely due to the birds commuting between breeding colonies at Forth Islands, St Abb’s Head and the Farne Islands, and foraging grounds within Berwick Bank. For kittiwake, it was also noted that 16.9% of all birds during the breeding months were recorded flying north-west, suggesting that some birds may have been commuting to colonies near Fowlsheugh.
Razorbill had an overall dominant flight direction of north (28.2%), likely due to being in transit to Fowlsheugh. Razorbill were also noted to be flying west towards the Forth Islands SPA during the early breeding months (June and July), with the reciprocal outbound north-easterly flight path also frequently reported.
Flight directions also varied by season, with surveys in August 2020 highlighting that those birds seen were likely actively foraging (during the chick-rearing period), with high percentages of razorbill and kittiwake having no flight direction or seen circling (42.9% and 16.0% respectively). Across all seasons, high percentages of kittiwake were seen to have either no direction or were recorded as circling, possibly result of birds being attracted to the vessels or actively foraging. A breakdown of monthly surveys and flight directions for each of the five species can be viewed within Appendix 3.
Figure 3.7 Overall flight directions recorded during the 2020-2021 breeding season boat-based surveys of Berwick Bank, with repeat sightings removed.
3.1.3.2 Surveyor Estimated Flight Heights
Due to a large proportion of kittiwake and gannet ( Figure 3.6 Open ▸ ) observed flying, with both species having been observed flying at typical collision risk heights (> 30 m), flight height profiles have been derived from surveyor flight height observations.
3.1.3.2.1 Kittiwake
The investigation into whether distance from the boat had an influence on observed flight heights of kittiwakes highlighted that regardless of distance from the boat, low flight heights were recorded: over 85% of all records of flying birds within all distance bands had a flight height of 20 m or below (Table 3.9).
Height Band (m) | Distance Band A 0-50 m | Distance Band B 50-100 m | Distance Band C 100-200 m | Distance Band D 200-300 m |
|---|---|---|---|---|
>0-5 | 34.67 | 34.01 | 37.78 | 52.82 |
>5-10 | 19.13 | 22.19 | 20.70 | 18.87 |
>10-15 | 22.59 | 23.95 | 21.50 | 15.45 |
>15-20 | 12.26 | 10.23 | 10.32 | 8.05 |
>20-25 | 7.18 | 6.09 | 5.02 | 2.83 |
>25-30 | 2.47 | 1.85 | 2.62 | 1.07 |
>30-35 | 0.90 | 0.97 | 1.11 | 0.43 |
>35-40 | 0.49 | 0.13 | 0.26 | 0.18 |
>40-45 | 0.31 | 0.44 | 0.26 | 0.21 |
>45-50 | 0.00 | 0.09 | 0.11 | 0.00 |
>50-55 | 0.00 | 0.00 | 0.23 | 0.06 |
>55-60 | 0.00 | 0.00 | 0.00 | 0.00 |
>60-65 | 0.00 | 0.04 | 0.09 | 0.00 |
>70 | 0.00 | 0.00 | 0.00 | 0.03 |
All kittiwakes observed during the 2020-2021 boat-based surveys were used for analysis (distance bands A – D), with 6,955 observational records for kittiwake having an assigned flight height (those within Distance band E were removed, n = 203).
The majority of kittiwake records showed birds to be flying below 30 m: on average across months within Berwick Bank, 98.91% of all records were below 30 m. Only surveys in July 2020 and April 2021 showed over 1% of records having a flight height of greater than 35 m. There was a notably higher proportion of kittiwakes recorded flying at 0-5 m above sea level in Distance Band D than in closer Bands A, B and C. This was reflected in slightly higher proportions of birds recorded flying above 10 m in Bands A, B and C than in Band D. Table 3.8 shows the monthly variation in flight heights observed across the Berwick Bank project area.
Table 3.9 Proportion of kittiwakes within each flight height band observed during the 2020-2021 Berwick bank boat-based surveys.
Height Category | Survey Month and Proportion of Observed Birds | ||||
|---|---|---|---|---|---|
July 2020 | August 2020 | April 2021 | May 2021 | June 2021 | |
< 30 m | 98.13 | 99.51 | 98.21 | 98.96 | 99.71 |
> 30 m | 1.87 | 0.49 | 1.79 | 1.04 | 0.29 |
> 35 m | 1.19 | 0.29 | 1.34 | 0.66 | 0 |
Figure 3.8 Open ▸ illustrates the differences in overall monthly and site variation in observed flight heights of kittiwake. Flight heights of up to 70 m were observed, although this only happened on one occasion in July 2020. Eight birds were seen flying higher than 50 m.
Figure 3.8 (Top) Kittiwake surveyor flight height observations within Berwick Bank across months. (Bottom) Kittiwake surveyor flight height observations within Berwick Bank across sites during the 2020-2021 boat-based surveys
3.1.3.2.2 Gannet
The investigation into whether distance from the boat had an influence on observed gannet flight heights highlighted that regardless of distance from the boat, low flight heights were recorded: over 90% of all records of flying birds within all distance bands had a flight height of 20 m or below (Table 3.10).
Height Band (m) | Distance Band A 0-50 m | Distance Band B 50-100 m | Distance Band C 100-200 m | Distance Band D 200-300 m |
|---|---|---|---|---|
>0-5 | 19.67 | 21.16 | 21.44 | 27.56 |
>5-10 | 54.60 | 54.11 | 55.14 | 55.70 |
>10-15 | 12.44 | 12.81 | 12.10 | 9.26 |
>15-20 | 5.88 | 4.93 | 3.87 | 2.51 |
>20-25 | 2.76 | 2.12 | 2.15 | 1.92 |
>25-30 | 1.53 | 1.30 | 1.81 | 0.67 |
>30-35 | 0.80 | 1.16 | 1.25 | 0.58 |
>35-40 | 0.80 | 0.55 | 0.65 | 0.76 |
>40-45 | 0.31 | 0.89 | 0.69 | 0.45 |
>45-50 | 0.49 | 0.21 | 0.30 | 0.09 |
>50-55 | 0.49 | 0.34 | 0.56 | 0.36 |
>55-60 | 0.18 | 0.34 | 0.04 | 0.09 |
>60-65 | 0.06 | 0.00 | 0.00 | 0.00 |
>70 | 0.00 | 0.07 | 0.00 | 0.04 |
During the 2020-2021 boat-based surveys, within distance bands A – D, 6,028 records of gannet had assigned flight heights (n = 199 observations were removed due to being within either distance band E or were a repeat sighting).
Gannet were observed more frequently flying at higher heights than kittiwake, with 5.93% observed flying greater than 30 m and over 5% flying higher than 35 m in August 2020 during the surveys (Table 3.11). In the month of April 2021, 100% of all gannets were observed flying below 30 m (only one record during the May 2021 surveys had a flight height of > 35 – 40 m). There was a higher proportion of gannets recorded flying at 0-5 m above sea level in Distance Band D than in closer Bands A, B and C. This was reflected in slightly higher proportions of birds recorded flying above 10 m in Bands A, B and C than in Band D.
Survey Area | Survey Month and Proportion of Observed Birds | ||||
|---|---|---|---|---|---|
July 2020 | August 2020 | April 2021 | May 2021 | June 2021 | |
Berwick Bank |
|
|
|
|
|
< 30 m | 99.17 | 94.07 | 100 | 99.85 | 96.21 |
> 30 m | 0.83 | 5.93 | 0 | 0.15 | 3.79 |
> 35 m | 0.54 | 5.15 | 0 | 0.15 | 1.37 |
Flight heights of up to 65 m were observed, although this only occurred on one occasion during the Berwick Bank August 2020 surveys ( Figure 3.9 Open ▸ ).
Figure 3.9 (Top) Gannet surveyor flight height estimates observed within Berwick Bank across months. (Bottom) Gannet surveyor flight height estimates observed within Berwick Bank across sites during the 2020-2021 boat-based surveys
3.1.3.3 Rangefinder Flight Height Analysis
Analysis of the rangefinder data for gannet and kittiwake from the breeding season months (April-August) provided 1,327 observations for analysis.
3.1.3.3.1 Flight height and distance from boat
During examination of rangefinder flight heights and their distances from the boat, low flight heights (0-5 m) of gannet were observed up to distances of 800 m (2 data points were removed due to being detected outside rangefinder range; errors > 1,600 m) ( Figure 3.10 Open ▸ ), with visual inspection suggesting that rangefinder flight heights may be slightly influenced by the vessel. However, this would require further investigation utilising more complex modelling methods (Corbeau et al. 2019) to understand at what distances gannet foraging behaviour may become influenced by the presence of the boat. Our results showed that 30% of all rangefinder flight height records were recorded within 100 m from the boat.
The trendline within the graph below ( Figure 3.10 Open ▸ ) highlights that lower flight heights of gannet were more frequently observed at distances close to the boat. This contradicts the pattern seen in the observer-estimated flight heights where a higher proportion of birds were recorded in the lowest height band 0-5 m in Distance Band D than in closer Bands A, B and C.
Figure 3.10 Variation in rangefinder-derived flight heights of gannet against distance from the boat; data from the Berwick Bank 2020-2021 boat-based surveys. Trendline is represented by the redline.
Kittiwake were observed up until distances of 948 m ( Figure 3.11 Open ▸ ), with visual inspection suggesting that rangefinder flight heights measured within close proximity to the boat could be influenced by the vessel. 53.92% of all rangefinder flight height records of kittiwake were recorded within 100 m of the boat, with 72.47% of those records at flight heights of below 15 m. The extent of the influence of the boat on kittiwake flight heights would require further investigation utilising more complex modelling methods (and additional variables such as flight speed) to understand at what distances kittiwake flight behaviour may become influenced.
The trendline within the graph below ( Figure 3.11 Open ▸ ) highlights that lower flight heights of kittiwake were more frequently observed at distances close to the boat. This contradicts the pattern seen in the observer-estimated flight heights where a higher proportion of birds were recorded in the lowest height band 0-5 m in Distance Band D than in closer Bands A, B and C.
Figure 3.11 Variation in rangefinder-derived flight heights of kittiwake against distance from the boat; data from the Berwick Bank 2020-2021 boat-based surveys. Trendline is represented by the redline.
3.1.3.3.2 Gannet flight height distribution
Gannet observations ( Figure 3.12 Open ▸ ) ranged from 0 m to 78.8 m. Due to negative values in the data set (caused by variation in swell heights of up to 3.5 m influencing the eye height of the observer), a number of observations were corrected to 1 m above sea level for the analyses to ensure these low-flying birds were captured in the flight height distributions without yielding unrealistic negative flight heights (Gannet n = 86).
Figure 3.12 Proportion of gannet observations per month for each height band derived from rangefinder data.
Gannets appeared to fly at greater heights during August 2020, with 15.35% flying above 35 m (Table 3.12), whereas no records of gannet were observed above 30 m during April and May 2020 surveys.
Count | Minimum height (m) | Maximum height (m) | Percentage above > 30 m | Percentage above > 35 m | |
Berwick Bank | 730 | 0 | 78.8 | 8.37 | 6.44 |
July 2020 | 206 | 0 | 57.4 | 2.91 | 1.94 |
August 2020 | 241 | 0.05 | 58.8 | 18.26 | 15.35 |
April 2021 | 62 | 0 | 26.32 | 0.00 | 0.00 |
May 2021 | 63 | 0.06 | 21.95 | 0.00 | 0.00 |
June 2021 | 158 | 0.19 | 78.8 | 6.96 | 3.80 |
3.1.3.3.3 Kittiwake flight height distribution
Kittiwake observations ranged between 0 m to 68.66 m Figure 3.13 Open ▸ ). Due to the presence of negative values, a number of observations were corrected to 1 m above sea level for the analyses (Kittiwake n = 12) to ensure these low-flying birds were captured in the flight height distributions without yielding unrealistic negative flight heights.
Figure 3.13 Proportion of kittiwake observations per month for each height band derived from rangefinder data.
Kittiwake appeared to fly at greater heights during the earlier breeding months (April, May and June) with 4.23% flying above 35 m during the April 2021 surveys (Table 3.13). There were no records of kittiwake flying greater than 35 m during the July and August 2020 surveys.
Table 3.13 Summary of rangefinder records for kittiwake (note errors removed and corrected according to eye height)
| Count | Minimum height (m) | Maximum height (m) | Percentage above > 30 m | Percentage above > 35 m |
Berwick Bank | 597 | 0.6 | 68.66 | 2.01 | 1.01 |
July 2020 | 218 | 0 | 30.23 | 0.46 | 0.000 |
August 2020 | 143 | 0.77 | 56.55 | 1.40 | 0.000 |
April 2021 | 71 | 0.65 | 24.7 | 7.04 | 4.23 |
May 2021 | 96 | 0.75 | 68.66 | 2.08 | 2.08 |
June 2021 | 69 | 0.96 | 36.76 | 2.90 | 1.45 |
3.1.3.4 Flight Height Comparison
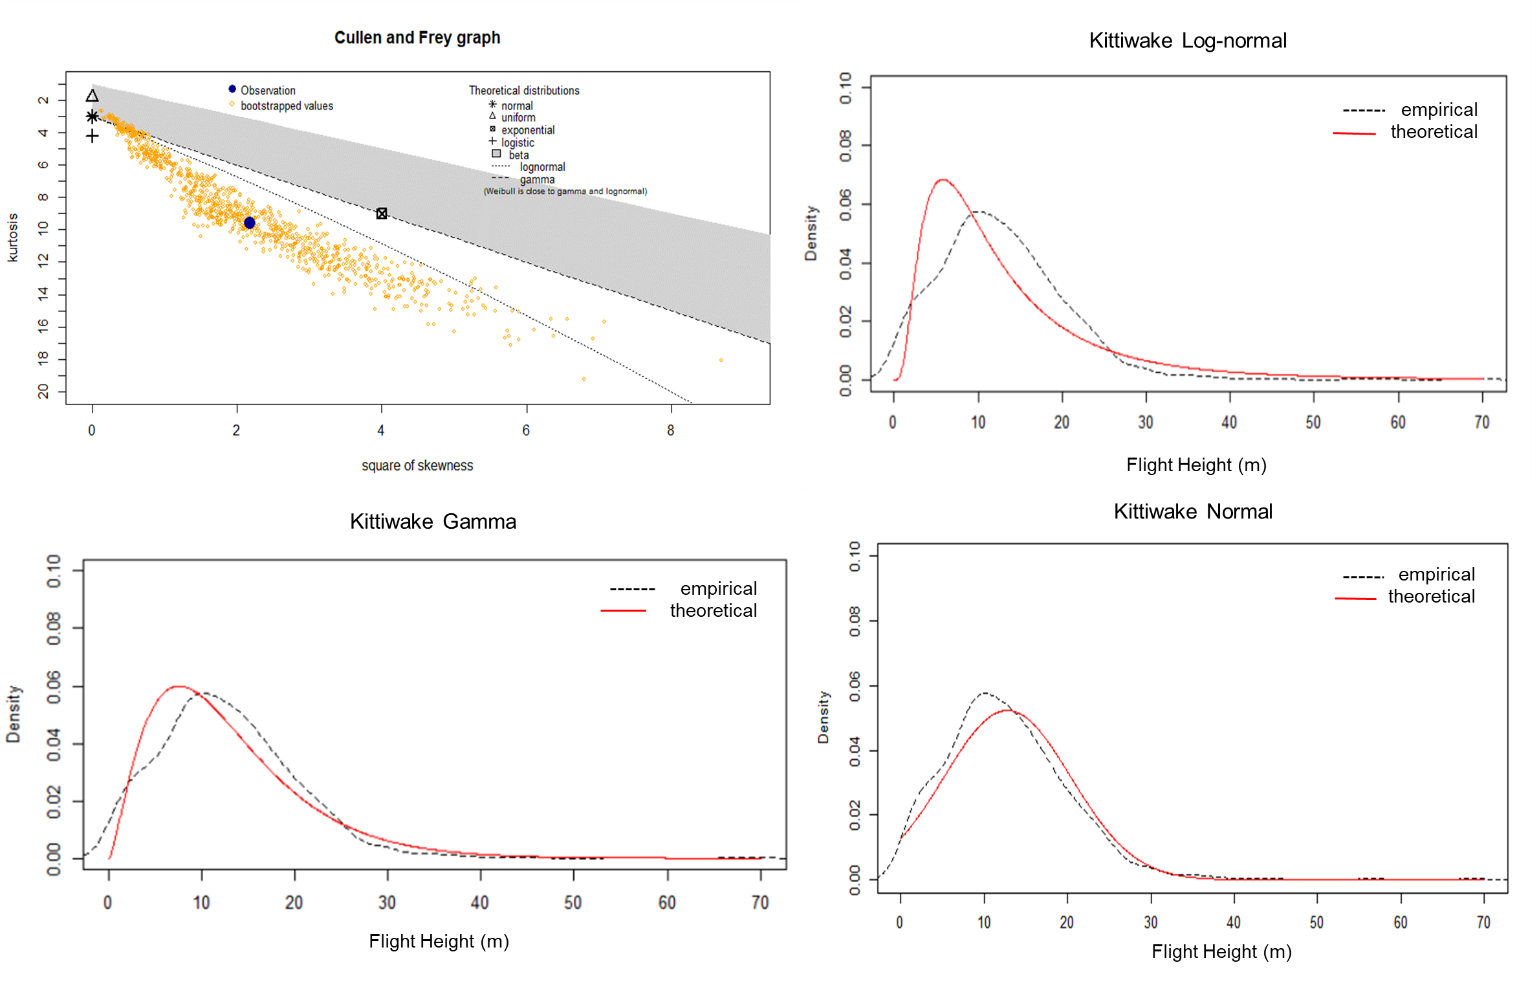
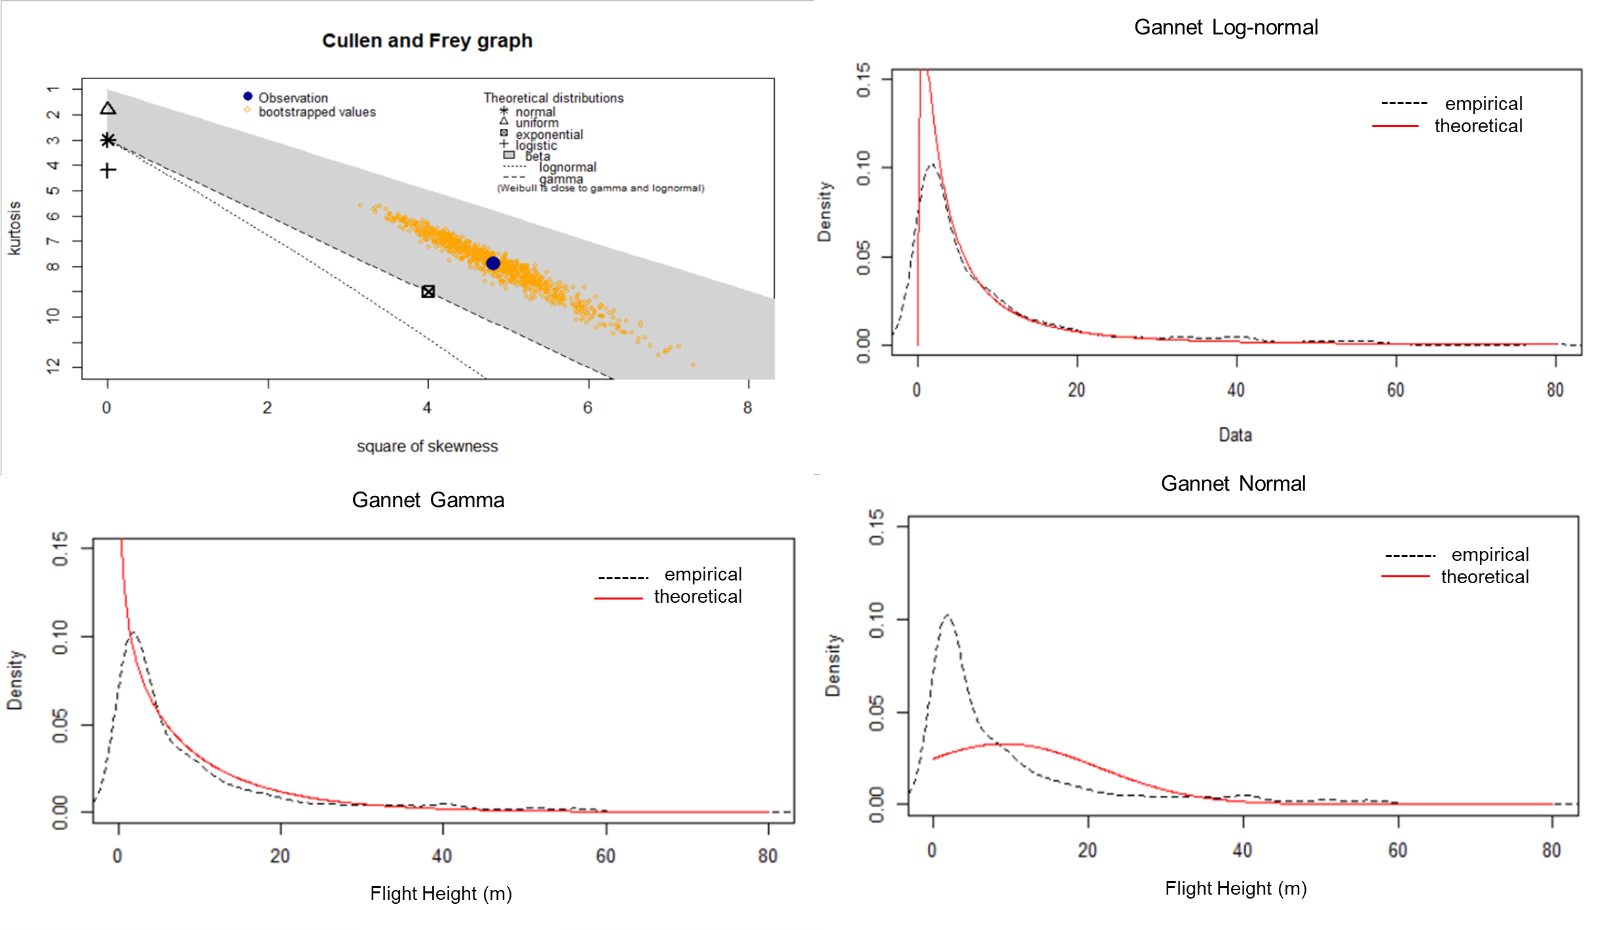
Figure 3.14 Open ▸ and Figure 3.15 Open ▸ illustrates the fitted distributions for gannet (log-normal) and kittiwake (normal) compared to the Johnston et al. (2014) and surveyor observational distributions. The best fitting distributions were based on visual assessment (Appendix 1).
The gannet fitted distribution from the rangefinder data for the combined Berwick Bank survey sites ( Figure 3.14 Open ▸ ) is similar to the Johnston et al. (2014) distributions, however does differ slightly, with the rangefinder data from the 2020-2021 boat surveys showing that a higher proportion of gannets were seen flying at greater heights, above 30 m. The visual observational surveyor flight height estimates show a lower proportion of birds observed to be flying above 30 m compared to Johnston et al. (2014) and the rangefinder data.
Figure 3.14 Variation in fitted flight height distributions for gannet based on the rangefinder data and visual observation data collected during boat-based surveys of the Berwick Bank project area in 2020 and 2021 and generic flight heights by Johnston et al. (2014).
Flight height comparisons for gannet are further shown within Table 3.14, highlighting the difference between the proportion of birds observed below and above 30 m and above 35 m. The observer estimated flight heights show similarities with Johnston et al. (2014), while the rangefinder flight height measurements are different, with a higher proportion of birds (8.36%) recorded flying above 30 m and 6.44% recorded flying above 35 m, corresponding approximately to collision risk height (assuming that the Berwick Bank turbine airgap is 37 m above LAT, with a tidal offset of approximately 2.5 m).
Table 3.14 Flight height percentage comparison for Gannet flying below/above 30 m. 2020-2021 data taken from Berwick Bank boat-based surveys.
Source | ≤30 m | >30 m | >35 m |
Johnston et al. 2014 | 96.00 % | 4.01 % | 2.39 % |
2020-2021 rangefinder data | 91.10 % | 8.36 % | 6.44 % |
2020-2021 observer estimated flight height data | 97.12 % | 2.88 % | 1.96 % |
The kittiwake fitted distribution from the rangefinder data ( Figure 3.15 Open ▸ ) differs considerably from the Johnston et al. (2014) flight height distributions, with the rangefinder detecting more birds in the airspace between 10 m to 30 m than below 10 m and overall a larger proportion of birds observed below 30 m. Surveyor flight height estimates were more similar to Johnston et al. (2014) estimates compared to the rangefinder data, however a larger proportion were again observed below 30 m compared to generic flight heights by Johnston et al. (2014).
Figure 3.15 Variation in fitted flight height distributions for kittiwake based on the rangefinder data and visual observational data collected during boat-based surveys of the Berwick Bank project area in 2020 and 2021 and generic flight heights by Johnston et al. (2014).
Flight height comparisons for kittiwake are further shown within Table 3.15, highlighting the difference between the proportion of birds observed below and above 30 m and above 35 m. The rangefinder data and observer estimated flight height data show a higher proportion of birds below 30 m (97.82 % and 98.80 % respectively) compared to Johnston et al. (2014) (94.77 %). There is a corresponding lower proportion of birds flying at collision risk height recorded by the rangefinder measurements (1.01%) and the observer flight height estimates (0.80%) compared to Johnston et al. (2004) (3.23 %; assuming that the Berwick Bank turbine airgap is 37 m above LAT, with a tidal offset of approximately 2.5 m).
Table 3.15 Flight height percentage comparison for Kittiwake flying below/above 30 m. 2020-2021 data taken from Berwick Bank boat-based surveys
Source | ≤30 m | >30 m | >35 m |
Johnston et al. 2014 | 94.77 % | 5.23 % | 3.23 % |
2020-2021 rangefinder data | 97.82 % | 2.01 % | 1.01 % |
2020-2021 observer estimated flight height data | 98.80 % | 1.20 % | 0.80 % |
4 Summary and Conclusions
4 Summary and Conclusions
- Rangefinder flight height data collected for gannet during the 2020-2021 boat-based surveys were similar to that reported by Johnston et al. (2014). However, a slightly greater proportion of gannet were recorded flying at lower heights (< 5 m) than that reported by Johnston et al. (2014): rangefinder data estimated 54.93% of birds observed flying below 5 m, while Johnston et al. (2014) reported 46.26%. A higher proportion of birds were recorded flying within or close to the rotor swept zone of the proposed Berwick Bank turbine: rangefinder data 8.36% >30 m, 6.44% >35 m compared to Johnston et al. (2014) 4.01 % >30 m, 2.39% >35 m..
- Rangefinder flight height data collected for kittiwake differed considerably from what was reported by Johnston et al. (2014), with a lower proportion of birds observed flying within or close to the rotor swept zone of the Berwick Bank turbine: rangefinder data 2.01% >30 m, 1.01% >35 m compared to Johnston et al. (2014) 5.23 % >30 m, 3.23% >35 m.
- Visual surveyor flight height estimates recorded the lowest proportions of both gannet and kittiwake flying within or close to the rotor swept zone of the Berwick Bank turbine: gannet - 2.88% >30 m, 1.96% >35 m; kittiwake – 1.20% >30 m, 0.80% >35 m.
- There was some evidence that both gannet and kittiwake flight heights may be influenced by their position relative to the survey vessel. Although a statistical analysis has not been carried out within the scope of this report, there is indication from the observer-estimated flight heights that the closer the bird was to the boat the greater the proportion of recorded flights within height bands above 10 m; i.e. birds fly higher when close to the vessel. It could be speculated that this is because birds approaching the boat increase height relative to the boat deck to fly over or view the boat. However, the flight heights of both gannet and kittiwake as measured by the rangefinder showed a tendency to decrease closer to the survey vessel, perhaps as a reactive attraction towards the boat. An alternative explanation for the pattern seen in the observer-estimated flight height data is that observers estimated that flights are lower than their true height when flying at greater distances from the survey vessel.
- The data and analytical outputs are suitable for deriving flight heights proportions for use in the Band collision risk model, either Option 1 (proportion of birds at risk height), or Option 4 (site-specific flight height distribution).
- It is recommended that analyses of collision risk using flight height data derived from either the rangefinder or visual observer estimates are presented alongside Johnston et al. (2014) generic flight height data.
- There was no clear pattern indicating a relationship between seabird abundance and environmental data (surface temperature and salinity) collected during the surveys.
REFERENCES
Benaglia, T., Chauveau, D., Hunter, D.R., Young, D. (2009). mixtools : An R Package for Analyzing Finite Mixture Models. Journal of Statistical Software, 32: 1-29.
Buckland, S.T., Anderson, D.R., Burnham, K.P., Laake, J.L., Borchers, D.L. & Thomas, L. (2001). Introduction to Distance sampling, Estimating abundance of biological populations. Oxford University Press, Oxford: 432pp
Camphuysen, C.J., Fox, A.D. and Leopold, M.F. (2004). Towards Standardised Seabirds at Sea Census Techniques in Connection with Environmental Impact Assessments for Offshore Wind Farms in the U.K.: A Comparison of Ship and Aerial Sampling for Marine Birds, and their Applicability to Offshore Wind Farm Assessments. Report commissioned by COWRIE (Collaborative Offshore Wind Research into the Environment). Available at: www.offshorewindfarms.co.uk. Accessed June 2020.
Cleasby, I.R., Wakefield, E.D., Bearhop, S., Bodey, T.W., Votier, S.C. and Hamer, K.C. (2015). Three-dimensional tracking of a wide-ranging marine predator: flight heights and vulnerability to offshore wind farms. J. Appl. Ecol., 52, pp. 1474-1482, 10.1111/1365-2664.12529.
Cook, A.S.C.P., Ward, R.B., Hansen, W.S. & Larsen, L. (2018). Estimating Seabird Flight height using LiDAR. Scottish Marine and Freshwater Science Vol 9 No 14.
Corbeau, A., Collet, J., Fontenille, M. & Weimerskirch, H. (2019). How do seabirds modify their search behaviour when encountering fishing boats? PLoS ONE 14(9): e0222615. https://doi.org/10.1371/journal.pone.0222615
Coulson, J.C. (2011). The Kittiwake. T. & A.D. Poyser, London.
Cramp, S., Bourne, W.R.P. & Saunders, D. (1974). The Seabirds of Britain and Ireland. Collins, London.
Delignette-Muller, M.L., Dutang, C. (2015). fitdistrplus: An R Package for Fitting Distributions. Journal of Statistical Software, 64: 1-34.
Embling, C.B., Illian, J., Armstrong, E., Van der Kooij, J., Sharples, J., Camphuysen, C.J. and Scott, B.E. (2012). Investigating Fine-Scale Spatio-Temporal Predator-Prey Patterns in Dynamic Marine Ecosystems: A Functional Data Analysis Approach. J. Appl. Ecol., 49: 481-492.
Garthe, S. & Hüppop, O. (2004). Scaling Possible Adverse Effects of Marine Wind Farms on Seabirds: Developing and Applying a Vulnerability Index. J. Appl. Ecol., 41, pp724-734.
Harwood, A., Perrow, M. & Berridge, R. (2018). Use of an Optical Rangefinder to Assess the Reliability of Seabird Flight Heights from Boat-Based Surveyors: Implications for Collision Risk at Offshore Wind Farms. Journal Field Ornithology 89(4):372–383, 2018
Hill, S., Burrows, M.T. & Hughes, R.N. (2000). Increased turning per unit distance as an area-restricted search mechanism in a pause-travel predator, juvenile plaice, foraging for buried bivalves. J. Fish Biol. 2000;56: 1497–1508.
Johnston, A., Cook, A.S.C.P., Wright, L.J., Humphreys, E.M. & Burton, N.H.K. (2014). Modelling flight heights of marine birds to more accurately assess collision risk with offshore wind turbines. J. Appl. Ecol. 51: 31-41.
Lalli, C.M. & Parsons, T.R. (1997). Biological oceanography: An Introduction. Butterworth Heinemann, Oxford, pp. 265.
Miller, D.L. (2019). Distance: Distance Sampling Detection Function and Abundance Estimation. R package version 0.9.8
Miller, D.L., Rexstad, E., Thomas, L., Marshall, L. & Laake, J.L. (2019). Distance sampling in R. Journal of Statistical Software 89 (1).
Mitchell, P., Newton, S., Ratcliffe, N. and Dunn, T.E. (eds). (2004). Seabird Populations of Britain and Ireland. T & AD Poyser.
R Core Team (2020). R: A language and environment for statistical computing. R Foundation for Statistical Computing, Vienna, Austria
Seagreen Wind Energy (2012a). ES volume I. Chapter 10- Ornithology. Seagreen Wind Energy Ltd A4MR-SEAG-Z-DOC100-SPR-060: 137pp.
Seagreen Wind Energy (2012b). ES volume III (Appendices Part 2) F1- Ornithology Baseline Technical Report for Projects Alpha and Bravo & F2- Offshore Transmission Assets Project – Ornithological Technical Report & F3- Details of the risk matrix of displacement. Seagreen Wind Energy Ltd A4MR-SEAG-Z-DOC100-SPR-060: 338pp
Seagreen Wind Energy (2018). Ornithology Technical Report for Seagreen Alpha & Bravo Firth of Forth Offshore Wind Farm Development 2018. 171pp.
Tasker, M.L. Jones, P.H., Dixon, T.J. & Blake, B.F. (1984). Counting seabirds at sea from ships: a review of methods employed and a suggestion for a standardised approach. Auk, 101: 567-577.
Votier, S.C., Furness, R.W., Bearhop, S., Crane, J.E., Caldow, R.W.G. & Catry, P. (2004). Changes in fisheries discard rates and seabird communities. Nature. 2004;427: 727–730. pmid:14973483.
Wahl, T. R., & Heinemann, D. (1979). Seabirds and fishing vessels: Co-occurrence and attraction. Condor 81:390-396.
Webb, A. & Durinck, J. (1992). Counting birds from ship. In: Komdeur, J., Bertelsen, J. & Cracknell, G. (eds) Manual for aeroplane and ship surveys of waterfowl and seabirds. IWRB Special Publication No. 19, Natural Environmental Research Institute, Kalø, Denmark, pp.24-35.
Appendix 1 - Variation in fitted distributions for Gannet gannet and kittiwake rangefinder data
Appendix 1 - Variation in fitted distributions for Gannet gannet and kittiwake rangefinder data
Kittiwake
Gannet
Appendix 2 Monthly observations during the 2020-2021 boat-based surveys
Appendix 2 Monthly observations during the 2020-2021 boat-based surveys
Table 4.1 Raw observations per month of all bird in Bands A-D with repeat sightings excluded
| Site 1 | Site 2 | Site 3 | Site 4 |
| ||||||||||||||||
|---|---|---|---|---|---|---|---|---|---|---|---|---|---|---|---|---|---|---|---|---|---|
Species | Jul | Aug | Apr | May | Jun | Jul | Aug | Apr | May | Jun | Jul | Aug | Apr | May | Jun | Jul | Aug | Apr | May | Jun | Total |
Auk species | 7 |
|
| 1 |
| 14 |
|
|
|
| 49 | 45 |
|
|
| 1 | 69 |
|
|
| 186 |
Sabine's Gull |
|
|
|
|
|
|
|
|
|
|
| 1 |
|
|
|
|
|
|
|
| 1 |
Arctic Skua | 1 |
|
|
| 1 |
|
|
|
|
|
| 1 |
|
|
|
|
|
|
|
| 3 |
Arctic Tern |
| 113 |
|
| 1 | 2 | 335 |
| 23 | 1 | 4 | 484 |
| 1 |
|
| 2565 |
|
|
| 3529 |
Black-headed Gull |
|
|
|
|
|
|
|
|
|
|
| 1 |
|
|
|
|
|
|
|
| 1 |
Common Gull |
| 10 |
|
|
| 1 |
|
| 1 |
|
|
| 2 |
| 1 |
| 2 |
|
|
| 17 |
Little Gull |
|
|
|
|
|
|
|
|
|
|
|
|
|
|
|
|
|
|
| 1 | 1 |
Common Tern |
|
|
|
|
|
| 1 |
|
|
|
|
|
|
|
|
|
|
|
|
| 1 |
Tern Species |
|
|
|
|
|
|
|
|
|
|
|
|
| 1 |
|
|
|
|
|
| 1 |
Curlew |
|
|
|
|
|
|
|
|
|
| 5 |
|
|
|
|
|
|
|
| 5 | 10 |
Fulmar | 21 | 58 | 32 | 12 | 20 | 11 | 31 | 71 | 15 | 32 | 9 | 47 | 40 | 6 | 26 | 22 | 41 | 30 | 31 | 17 | 573 |
Great Black-backed Gull | 3 |
| 7 |
|
| 3 |
| 20 |
|
| 3 |
| 6 |
| 1 |
| 1 | 5 |
|
| 49 |
Golden Plover |
| 1 |
|
|
|
|
|
|
|
|
|
|
|
|
|
|
|
|
|
| 1 |
Guillemot | 1158 | 122 | 132 | 387 | 802 | 1303 | 520 | 599 | 1531 | 607 | 1104 | 720 | 241 | 852 | 416 | 119 | 3498 | 456 | 118 | 648 | 15333 |
Gannet | 712 | 275 | 45 | 174 | 364 | 660 | 292 | 171 | 134 | 227 | 871 | 583 | 136 | 245 | 311 | 661 | 857 | 172 | 124 | 690 | 7704 |
Herring Gull | 89 | 3 |
| 1 | 10 | 200 |
|
|
| 4 | 182 | 1 |
| 1 | 8 | 18 | 171 |
|
| 8 | 696 |
Black-legged Kittiwake | 628 | 122 | 96 | 179 | 209 | 861 | 293 | 344 | 1509 | 213 | 684 | 785 | 1313 | 732 | 227 | 208 | 1973 | 491 | 328 | 113 | 11308 |
Lesser Black-backed Gull | 22 | 4 |
|
| 17 | 25 | 5 |
|
| 8 | 43 | 2 | 1 | 2 | 9 | 4 | 28 |
|
| 9 | 179 |
Large Gull species |
|
|
|
|
|
|
|
|
|
| 1 |
|
|
|
|
|
|
|
|
| 1 |
Manx Shearwater | 1 | 2 |
|
|
|
| 2 |
|
| 2 | 1 | 3 |
| 2 | 1 |
| 2 |
|
| 6 | 22 |
Great Skua | 1 | 1 | 1 |
|
|
| 1 |
|
|
| 1 | 4 | 1 |
|
|
| 2 |
|
|
| 12 |
Sooty Shearwater |
|
|
|
|
|
|
|
|
|
|
| 1 |
|
|
|
| 1 |
|
|
| 2 |
Puffin | 307 | 76 | 21 | 40 | 162 | 544 | 96 | 127 | 14 | 54 | 952 | 160 | 98 | 14 | 52 | 304 | 192 | 126 | 4 | 126 | 3469 |
Razorbill | 195 | 220 | 123 | 49 | 45 | 106 | 331 | 60 | 47 | 29 | 329 | 574 | 89 | 46 | 29 | 11 | 1522 | 760 | 12 | 48 | 4625 |
Redshank |
|
|
|
|
|
|
|
|
|
| 11 |
|
|
|
|
|
|
|
|
| 11 |
Swift |
|
|
|
| 2 |
|
|
|
| 1 |
| 1 |
|
|
|
|
|
|
|
| 4 |
Swallow | 1 |
|
|
|
|
|
|
|
|
|
|
|
|
|
|
|
|
|
|
| 1 |
Sedge Warbler |
|
|
|
|
|
|
|
|
|
|
|
|
|
|
|
| 1 |
|
|
| 1 |
Teal |
|
|
|
|
|
|
|
|
|
|
| 14 |
|
|
|
|
|
|
|
| 14 |
Sandwich Tern |
| 1 |
|
|
|
|
|
|
|
|
|
|
|
|
|
|
|
|
|
| 1 |
Storm Petrel | 2 | 2 |
|
|
|
|
|
|
|
|
| 1 |
|
|
|
|
|
|
|
| 5 |
Tree Pipit |
|
|
|
|
|
|
|
|
|
|
| 1 |
|
|
|
|
|
|
|
| 1 |
Meadow Pipit |
|
|
|
|
|
|
|
|
|
|
|
|
|
|
|
|
|
| 2 |
| 2 |
Turnstone |
|
|
|
|
|
| 2 |
|
|
| 1 |
|
| 1 |
|
|
|
|
|
| 4 |
Whimbrel |
|
|
|
|
|
|
|
|
|
|
|
|
|
|
| 1 |
|
|
|
| 1 |
Skylark |
|
|
|
|
|
|
| 1 |
|
|
|
|
|
|
|
|
|
|
|
| 1 |
Common Scoter |
|
|
|
|
|
|
|
|
|
|
|
|
|
|
|
|
|
| 1 |
| 1 |
Red-breasted Merganser |
|
|
|
|
|
|
|
|
|
|
|
| 1 |
|
|
|
|
|
| 1 | 2 |
Collard Dove |
|
|
|
|
|
|
| 1 |
|
|
|
|
| 1 |
|
|
|
|
|
| 2 |
Pink-footed goose |
|
|
|
|
|
|
|
|
|
|
|
|
|
|
|
|
|
|
| 2 | 2 |
Grand Total | 3148 | 1011 | 457 | 843 | 1633 | 3730 | 1909 | 1394 | 3274 | 1178 | 4250 | 3429 | 1928 | 1904 | 1081 | 1349 | 10925 | 2040 | 620 | 1674 | 47777 |
Appendix 3 Monthly flight directions for the five key species observed during the 2020-2021 boat-based survey
4.1.1 Environmental Variables
4.1.1 Environmental Variables
Measurements of mean surface temperature and mean salinity were collected using the CTD tag and can be related to the seabird abundances. Figure 4.6 to Figure 4.9 show the differing environmental conditions per hour for the Berwick Bank site 2 project area, whereas Figure 4.9 Open ▸ shows the mean temperature and mean salinity for each hour for the Berwick Bank site 3 area. These are shown with the abundances of the five key seabird species in each figure. The second CTD tag was lost in June (Table 3.5) and so data for Berwick Bank site 2 in June could not be compared alongside the July, August and May Berwick Bank site 2 data.
Our results show no clear pattern between environmental variables and seabird presence within the survey area. It is understood that marine productivity relies on variables such as temperature and salinity (Lalli & Parsons, 1997), with pelagic shoaling fish (such as sandeels, sprat and herring) movements influenced by upwelling and frontal tides, and so as prey abundance near the surface decreases during times of reduced mixing, bird presence is also influenced. For example, Embling et al. (2012) showed that kittiwake abundance could be linked to changes in salinity (along with temperature, density and chlorophyll fluorescence).