

1 Introduction
1.1 Background
1.1 Background
Anatec was commissioned by SSE Renewables Developments (UK) Limited (“SSE Renewables” (SSER)) to undertake a Navigational Risk Assessment (NRA) for the proposed Berwick Bank Wind Farm (hereafter the ‘Project’). The NRA has been undertaken with respect to the offshore components of the Project (hereafter, the ‘Proposed Development’) comprising the Proposed Development array area and the Proposed Development export cable corridor. This NRA presents information on the Proposed Development relative to the existing and estimated future navigational activity and forms an annex to volume 2, chapter 13 of the offshore Environmental Impact Assessment (EIA) Report.
1.2 Navigational Risk Assessment
2 Guidance and Legislation
2.1 Legislation
2.1 Legislation
As part of the EIA Directive (2011/92/European Union (EU), as amended by Directive 2014/52/EU) (which remains applicable following EU Exit), an EIA Report is required to support the application for the Section 36 consent for the Project. The MCA require that, as part of the EIA Report, an NRA is undertaken to “inform the shipping and navigation chapter of the EIA Report” (MCA, 2021).
2.2 Primary Guidance
2.2 Primary Guidance
The primary guidance documents used during the assessment are the following:
- MGN 654 (Merchant and Fishing) Safety of Navigation: Offshore Renewable Energy Installations (OREIs) – Guidance on UK Navigational Practice, Safety and Emergency Response and its annexes (MCA, 2021); and
- Revised Guidelines for FSA for Use in the Rule-Making Process (International Maritime Organization (IMO), 2018).
MGN 654 highlights issues that shall be considered when assessing the potential effect on navigational safety from offshore renewable energy developments proposed in United Kingdom (UK) internal waters, territorial sea or Renewable Energy Zones (REZ).
MGN 654 includes several annexes including the Methodology for Assessing the Marine Navigational Safety & Emergency Response Risks of Offshore Renewable Energy Installations (OREI) which the MCA require to be used as a template for preparing NRAs. The methodology is centred on risk management and requires a submission that shows that sufficient controls are, or will be, in place for the assessed risk to be judged as broadly acceptable or tolerable with mitigation (see section 3.2). In both volume 2, chapter 13 and the NRA, the base and future case levels of risk have been identified as well as the mitigation measures required to ensure the future case remains broadly acceptable, or tolerable with mitigation.
2.3 Other Guidance
2.3 Other Guidance
Other guidance documents used during the assessment include:
- MGN 372 (Merchant and Fishing) Offshore Renewable Energy Installations (OREI): Guidance to Mariners Operating in the Vicinity of UK OREIs (MCA, 2008);
- International Association of Marine Aids to Navigation and Lighthouse Authorities (IALA) Recommendation O-139 on The Marking of Man-Made Offshore Structures (IALA, 2021 (a));
- IALA Guidance G1162 The Marking of Offshore Man-Made Structures (IALA, 2021 (b)); and
- The Royal Yachting Association’s (RYA) Position on Offshore Renewable Energy Developments: Paper 1 (of 4) – Wind Energy (RYA, 2019).
2.4 Lessons Learnt
2.4 Lessons Learnt
There is considerable benefit for the Applicant in the sharing of lessons learnt within the offshore industry. The NRA, and in particular the risk assessment undertaken in volume 2, chapter 13, includes general consideration for lessons learnt and expert opinion from previous offshore wind farm developments and other sea users, capitalising upon the UK’s position as a leading generator of offshore wind power.
Data sources for lessons learnt include the following:
- Sharing the Wind – Recreational Boating in the Offshore Wind Strategic Areas (RYA and CA, 2004);
- Results of the Electromagnetic Investigations (MCA and QinetiQ, 2004);
- Offshore Wind Farm Helicopter Search and Rescue Trials Undertaken at the North Hoyle Wind Farm (MCA, 2005);
- Interference to Radar Imagery from Offshore Wind Farms (Port of London Authority (PLA),2005);
- Navigational Risk Assessment Phase 1 Offshore Wind Farms Project Alpha and Project Bravo (Anatec, 2012);
- Regional Cumulative Shipping and Navigational Review – Outer Firth of Forth and Tay Wind Farm Developments (Anatec, 2012);
- Strategic Assessment of Impacts on Navigation of Shipping and Related Effects on Other Marine Activities Arising from the Development of Offshore Wind Farms in the UK Renewable Energy Zone (REZ) (Anatec and The Crown Estate (TCE), 2012);
- Offshore Wind and Marine Energy Health and Safety Guidelines (RenewableUK, 2014);
- Influence of UK Offshore Wind Farm Installation on Commercial Vessel Navigation: A Review of Evidence (Anatec, 2016);
- Navigational Risk Assessment Addendum (Appendix 12A) (Anatec, 2018); and
- G+ Global Offshore Wind Health & Safety Organisation 2020 Incident Data Report (G+, 2021).
3 Navigational Risk Assessment Methodology
3.1 Formal Safety Assessment Methodology
A shipping and navigation user can only be affected by a hazard if there is a pathway through which a hazard can be transmitted between the source activity (cause) and the user. In cases where a user is exposed to a hazard, the overall severity of consequence to the user is determined. This process incorporates a degree of subjectivity. The assessments presented herein for shipping and navigation users have considered the following criteria:
- Baseline data and assessment;
- Expert opinion;
- Outputs of the Hazard Workshop;
- Level of stakeholder concern;
- Time and/or distance of any deviation;
- Number of transits of specific vessel and/or vessel type; and
- Lessons learnt from existing offshore developments.
3.2 Formal Safety Assessment Process
3.2 Formal Safety Assessment Process
The IMO Formal Safety Assessment (FSA) process (IMO, 2018) (the FSA process) as approved by the IMO in 2018 under Maritime Safety Committee (MSC) – Marine Environment Protection Committee (MEPC).2/circ. 12/Rev.2 has been applied to the risk assessment in volume 2, chapter 13 and is considered in this NRA.
The FSA process is a structured and systematic methodology based upon risk analysis and Cost Benefit Analysis (CBA) (if applicable) to reduce risks to As Low as Reasonably Practicable (ALARP). There are five basic steps within this process as illustrated in Figure 3.1 Open ▸ and summarised in the following list:
- Step 1 – identification of hazards (a list is produced of hazards prioritised by risk level specific to the problem under review);
- Step 2 – risk analysis (investigation of the causes and initiating events and consequences of the more important hazards identified in Step 1);
- Step 3 – risk control options (identification of measures to control and reduce the identified hazards);
- Step 4 – CBA (identification and comparison of the benefits and costs associated with the risk control options identified in Step 3); and
- Step 5 – recommendations for decision-making (defining of recommendations based upon the outputs of Steps 1 to 4).
Figure 3.1 Flow Chart of the FSA Methodology (IMO, 2018)
3.2.1 Hazard Workshop Methodology
A key tool used when undertaking an NRA is the Hazard Workshop which ensures that all risks are identified and qualified in agreement with relevant consultees prior to assessment within the Offshore EIA Report. Risks (and the determined qualification) are recorded via the hazard log which is presented in full in Appendix B.
Table 3.1 Open ▸ and Table 3.2 identify how the severity of consequence and the frequency of occurrence has been defined within the hazard log, respectively.
Table 3.1 Severity of Consequence Ranking Definitions
Table 3.2 Frequency of Occurrence Ranking Definitions
An aggregate of the severity of consequence (Table 3.1) and frequency of occurrence (Table 3.2) provide the level of risk for each hazard; the method for undertaking this aggregation is through use of a tolerability matrix, as presented in Table 3.3 Open ▸ . The risk of a hazard is defined as Broadly Acceptable (low risk), Tolerable (intermediate risk), or Unacceptable (high risk).
Once identified, the risk of a hazard is assessed to ensure it is ALARP. Further risk control measures may be required to further mitigate a hazard in accordance with the ALARP principle. Unacceptable risks are not considered to be ALARP.
Outputs of the hazard log have been used as evidence to support and refine the assessment undertaken in volume 2, chapter 13.
Table 3.3 Tolerability Matrix and Risk Rankings
3.3 Cumulative Risk Assessment Methodology
3.3 Cumulative Risk Assessment Methodology
The hazards identified in the FSA are also assessed for cumulative risks with other projects and proposed developments within the cumulative risk assessment. Given the varying type, status and location of developments, different scenarios have been considered in the cumulative risk assessment, which allocates developments into the scenarios depending upon the following criterion:
- Development status;
- Distance from the Proposed Development;
- Level of interaction with baseline traffic relevant to the Proposed Development;
- Level of concern raised during consultation; and
- Data confidence.
The scenarios and associated level of assessment undertaken for each, are summarised in Table 3.4 Open ▸ . Given the level of interest during consultation in the cumulative scenario, a detailed qualitative and quantitative (where applicable) approach to the cumulative risk assessment has been applied for each scenarios.
The maximum distance within which developments are considered for the cumulative risk assessment is 50 nm from the Proposed Development array area on the basis that there is not considered to be a direct pathway between the Proposed Development and any development beyond 50 nm from the Proposed Development array area. This distance is standard within NRAs and provides a good overview of cumulative traffic patterns.
An aggregate of the criterion can determine the relevant scenario(s) for each development. For example, if a development is located within 50 nm of the Proposed Development array area but does not impact a main commercial route passing within 1 nm of the Proposed Development array area and has low data confidence it may still be screened out of the cumulative risk assessment.
For offshore wind farms and in the context of shipping and navigation, the term ‘under construction’ indicates that offshore construction was ongoing at the time of the baseline being established and a buoyed construction area is present. The term ‘pre-construction’ indicates that a development has been consented and has a Contract for Difference (CfD) secured. The term ‘consented’ indicates that a development has been consented but does not have a CfD secured.
Projects meeting the assessment criteria are detailed in section 14.1.
Table 3.4 Cumulative Risk Assessment Development Screening Scenarios
3.4 Study Areas
3.4 Study Areas
3.4.1 Proposed Development Array Area
A 10 nm buffer has been applied around the Proposed Development array area (hereafter the ‘Proposed Development array area shipping and navigation study area’) as shown in Figure 3.2 Open ▸ . This study area has been defined to provide local context to the analysis of risks by capturing the relevant routes and vessel traffic movements within, and in proximity to, the Proposed Development array area. A 10 nm study area has been used within the majority of UK offshore wind farm NRAs and is suitable for collection of radar data.
Figure 3.2 Overview of Shipping and Navigation Study Areas
3.4.2 Proposed Development Export Cable Corridor
A 2 nm buffer has been applied around the Proposed Development export cable corridor (hereafter the ‘Proposed Development export cable corridor shipping and navigation study area’) as shown in Figure 3.2 Open ▸ . As with the Proposed Development array area shipping and navigation study area, this study area has been defined to capture relevant users and their movements within, and near, the Proposed Development export cable corridor. The Proposed Development export cable corridor shipping and navigation study area covers the area between the Mean Low Water Springs (MLWS) – marked on Figure 3.2 Open ▸ – and the boundary of the Proposed Development array area.
4 Consultation
4 Consultation
4.1 Stakeholders Consulted in Navigational Risk Assessment Process
4.2 Consultation Responses
Various responses have been received from stakeholders during consultation undertaken in the NRA process including during the Hazard Workshop, other consultation meetings, via email correspondence and through the Scoping Opinion for the 2020 Berwick Bank (Marine Scotland – Licensing Operations Team (MS-LOT), 2021)[2]. The key points and where they have been addressed in the NRA or volume 2, chapter 13 are summarised in Table 4.1 Open ▸ .
Table 4.1 Summary of Key Points Raised During Consultation
4.3 Hazard Workshops
4.3 Hazard Workshops
A key element of the consultation undertaken was the Hazard Workshops, meetings of local and national marine stakeholders to identify and discuss potential shipping and navigation hazards. Using the information gathered from the first Hazard Workshop, a hazard log was produced to be used as input into the risk assessment undertaken in volume 2, chapter 13. Using the information gathered from the second Hazard Workshop – following changes to the extent of the Proposed Development array area – the hazard log was updated.
This ensured that expert opinion and local knowledge was incorporated into the hazard identification process and that the hazard log was site-specific.
4.3.1 Hazard Workshop Attendance
The first Hazard Workshop was held via teleconferencing (due to restrictions incurred by the COVID-19 pandemic) on 28 September 2021 and was attended by all of the organisations listed below:
- MCA;
- NLB;
- UK Chamber of Shipping;
- RYA Scotland;
- CA;
- Evergas;
- FMA including representation of SFF;
- RNLI;
- Forth Ports;
- INEOS; and
- Shell.
Other Regular Operators were also given the opportunity to attend the first Hazard Workshop.
The second Hazard Workshop was held via teleconferencing on 27 July 2022 and was attended by all of the organisations listed below:
- MCA;
- NLB;
- UK Chamber of Shipping;
- RYA Scotland;
- FMA including representation of SFF;
- RNLI;
- Forth Ports;
- Scottish Whitefish Producers Association;
- FIR for ‘Eyemouth to Cove’, ‘Port Seton’, and ‘Montrose and Arbroath’; and
- Royal Northumberland Yacht Club.
4.3.2 Hazard Workshop Process and Hazard Log
During the Hazard Workshops, key maritime hazards associated with the construction, operation and maintenance and decommissioning of the Proposed Development were identified and discussed. Where appropriate, hazards were considered by vessel type to ensure risk control options could be identified on a type-specific basis.
Following the first Hazard Workshop, the risks associated with the identified hazards were ranked in the hazard log based upon the discussions held during the workshop. Where appropriate, mitigation measures were identified, including any additional measures required to reduce the risks to ALARP. The hazard log was then provided to the Hazard Workshop attendees for comment.
Following the second Hazard Workshop, the hazard log was updated based on reconsideration of the previously identified hazards and associated risks during the workshop. The hazard log was again provided to the Hazard Workshop attendees for comment and their feedback incorporated into the NRA.
The hazard log has been used to inform the risk assessment undertaken in volume 2, chapter 13 and is presented in full in Appendix B.
5 Data Sources
5 Data Sources
This section summarises the main data sources used to characterise the shipping and navigation baseline relative to the Proposed Development.
5.1 Summary of Data Sources
5.1 Summary of Data Sources
The main data sources used in assessing the shipping and navigation baseline relative to the Proposed Development are outlined in Table 5.1 Open ▸ .
Table 5.1 Data Sources Used to Inform Shipping and Navigation Baseline
5.2 Vessel Traffic Surveys
5.2 Vessel Traffic Surveys
The vessel traffic surveys were undertaken in agreement with the MCA and NLB. Two 14-day AIS, radar, and visual observation surveys undertaken in summer 2022 (2 to 16 August 2022) and winter 2021 (11 to 24 January 2021) have been considered within the baseline for a total of 28 full days, with an earlier survey undertaken in summer 2020 and long-term dataset from 2019 used as validation (see Appendix E and Appendix F).
A number of vessel tracks recorded during the Proposed Development array area survey periods were classified as temporary (non-routine), such as the tracks of the survey vessel, other non-routeing survey vessels and vessels associated with the construction of Neart na Gaoithe (NnG) and Seagreen. These have therefore been excluded from the analysis.
The dataset is assessed in full in section 10.
5.3 Long-Term Vessel Traffic Data
5.3 Long-Term Vessel Traffic Data
Long-term vessel traffic data consisting of AIS covering 12 months in 2019 was collected from coastal receivers. Taking into account the distance offshore of the Proposed Development array area, the long-term vessel traffic data is considered to be comprehensive for the Proposed Development array area shipping and navigation study area. The assessment of this dataset allowed seasonal variations to be captured and any tangible effects of the COVID-19 pandemic to be observed.
The dataset is assessed in full in Appendix E.
5.4 Data Limitations
5.4 Data Limitations
5.4.1 Automatic Identification System Data
For the purposes of the NRA, it has been assumed that vessels under an obligation to broadcast information via AIS have done so, both in the vessel traffic surveys and long-term vessel traffic data. It has also been assumed that the details broadcast via AIS (such as vessel type and dimensions) are accurate unless clear evidence to the contrary was identified during Anatec’s thorough quality assurance of the data.
5.4.2 Vessel Traffic Data for Proposed Development Export Cable Corridor
The MCA and NLB were content with the methodology for vessel traffic data collection. This method used only the AIS dataset to characterise vessel movements within the Proposed Development export cable corridor shipping and navigation study area. Consequently, this dataset has limitations associated with non-AIS targets.
5.4.3 COVID-19 Pandemic
It is widely accepted that the COVID-19 pandemic has had a substantial effect on shipping movements globally. Therefore, the vessel traffic survey data collected in winter 2021 may be influenced by COVID-19 pandemic. However, in line with best practices the Applicant has agreed the approach to data collection with relevant stakeholders, including the MCA.
Additionally, long-term vessel traffic data predating the COVID-19 pandemic has been used as a secondary source for characterising vessel traffic movements. A 12-month dataset covering 2019 has been referenced where relevant in the characterisation of the vessel traffic baseline. Analysis of the dataset in full is presented in Appendix E.
5.4.4 Historical Incident Data
Although all UK commercial vessels are required to report accidents to the Marine Accident Investigation Branch (MAIB), this is not mandatory for non-UK vessels unless they are in a UK port, within 12 nm of territorial waters (noting that the Proposed Development array area is located approximately 18 nm offshore at the closest point), or carrying passengers to a UK port. There are also no requirements for non-commercial recreational craft to report accidents to the MAIB.
The RNLI incident data cannot be considered comprehensive of all Incidents in the shipping and navigation study areas. Although hoaxes and false alarms are excluded, any incident to which a RNLI resource was not mobilised has not been accounted for in this dataset.
5.4.5 United Kingdom Hydrographic Office Admiralty Charts
During consultation, input has been sought from relevant stakeholders regarding the navigational features baseline. Navigational features are based upon the most recently available UKHO Admiralty Charts and Sailing Directions at the time of writing.
6 Project Design Envelope Relevant to Shipping and Navigation
6.1 Proposed Development Boundaries
6.1.1 Proposed Development Array Area
The Proposed Development array area is located approximately 30 nm (56 km) east of the entrance to the Firth of Forth, largely covering the Marr Bank in the western half, and partially covering the Berwick Bank at the south-eastern extent. The total area covered by the Proposed Development array area is approximately 294 square nautical miles (nm2) (1,008 square kilometres (km2)) with water depths ranging between 34 and 64 m below Chart Datum (CD).
All surface piercing structures (wind turbines and offshore substation platforms) will be located entirely within the Proposed Development array area, inclusive of blade overfly. The coordinates defining the boundary of the Proposed Development array area are illustrated in Figure 6.1 Open ▸ and provided in Table 6.1 Open ▸ . During no phase of the development will the Proposed Development array area be designated as an Area to Be Avoided (ATBA), with navigation only restricted where Safety Zones are active (see section 17).
Figure 6.1 Proposed Development Array Area Coordinates
Table 6.1 Coordinates for the Proposed Development Array Area
6.1.1.1 Refinement of the Proposed Development Array Area
The Proposed Development array area has been refined from that considered in the Scoping Report for the 2020 Berwick Bank (RPS Energy, 2020), the 2021 Scoping Report (RPS Energy (2021) and at the time of the first Hazard Workshop in September 2021. These refinements are presented in Figure 6.2 Open ▸ .
Figure 6.2 Refinement of the Proposed Development Array Area
Following the Scoping Report for the 2020 Berwick Bank, the more pointed south-eastern corner was softened, primarily due to concerns raised by shipping and navigation stakeholders. Additionally, the north-western section of the Proposed Development array area – part of the original proposed Marr Bank Wind Farm development, which was combined with the 2020 Berwick Bank to form the current Berwick Bank Wind Farm – was amended to create a gap between the Proposed Development array area and Seagreen and increase the width of the gap between the Proposed Development array area and Inch Cape. This version of the Proposed Development array area was presented at the first Hazard Workshop.
Following the Scoping Report and the first Hazard Workshop, the north-western section of the Proposed Development array area was again amended to increase the width of the gap between the Proposed Development array area and Seagreen and the Proposed Development array area and Inch Cape. The south-western and south-eastern sections of the Proposed Development array area were also refined further. This version of the Proposed Development array area was presented at the second Hazard Workshop and is considered throughout this NRA.
The Proposed Development array area represents a 23% reduction in extent from that considered in the Scoping Report and a 30% reduction in extent from that considered in the Scoping Report for the 2020 Berwick Bank (when considering the Berwick Bank and Marr Bank developments combined).
6.1.2 Proposed Development Export Cable Corridor
The Proposed Development export cable corridor runs between the southern boundary of the Proposed Development array area and the landfall point at Skateraw. The total area is approximately 49 nm2 (168 km2) with water depths within the Proposed Development export cable corridor ranging between 3 and 64 m below CD.
The offshore export cables will be located fully within the Proposed Development export cable corridor. The key coordinates defining the boundary of the Proposed Development export cable corridor are illustrated in Figure 6.3 Open ▸ and provided in Table 6.2 Open ▸ .
Figure 6.3 Proposed Development Export Cable Corridor Key Coordinates
The Proposed Development export cable corridor has also been refined from that considered in the first Hazard Workshop, with a second landfall location at Thorntonloch removed. A secondary export cable option to Blyth (the Cambois connection) is also under consideration and is considered as part of the cumulative risk assessment (see section 14.1.3).
Table 6.2 Key Coordinates for the Proposed Development Export Cable Corridor
6.2 Surface Infrastructure
6.2 Surface Infrastructure
6.2.1 Indicative Array Layout
Up to 317 surface structures will be installed within the Proposed Development array area, consisting of up to 307 wind turbines and 10 offshore substation platforms. The final positions of surface structures have not yet been defined, but for the purposes of the NRA an indicative worst case array layout has been determined and is presented in Figure 6.4 Open ▸ .
Figure 6.4 Overview of Indicative Worst Case Array Layout for Shipping and Navigation
The indicative worst case array layout consists of a full build out of the Proposed Development array area to maximise the spatial extent of vessel deviations and the maximum possible number of surface structures to maximise exposure for passing (or adrift) vessels.
The minimum spacing within the PDE is 1,000 m, however with the indicative layout relevant for shipping and navigation this spacing varies as follows. The indicative array layout includes at least two lines of orientation[3] for wind turbines with a minimum spacing between wind turbines (measured centre-to-centre) of 1,265 m. The minimum spacing within the PDE is 1,000 m, with this spacing considered within the risk assessment where appropriate. The offshore substation platforms are evenly spaced between the wind turbine rows, giving an overall minimum spacing between structures for the indicative array layout (measured centre-to-centre) of 1,265 m, in the northeast-southwest direction. The minimum spacing between structures in a northwest-southeast orientation is 1,780 m.
6.2.2 Wind Turbines
The wind turbines within the indicative array layout each have a maximum rotor diameter of 222 m and maximum blade tip height (above LAT) of between 257 and 267 m. However, the maximum design scenario values for shipping and navigation are associated with the largest possible wind turbines (which would not be used for the indicative array layout). These are 310 m for rotor diameter and between 307 and 355 m for maximum blade tip height.
Piled jackets and suction caisson jackets foundations have been considered as the maximum design scenario for shipping and navigation as these foundation types provide the maximum structure dimension at the sea surface, and therefore maximise exposure for passing (or adrift) vessels. The maximum design scenario for the wind turbines, which assume use of a piled jacket or suction caisson jacket foundation design, are provided in Table 6.3 Open ▸ .
Table 6.3 Wind Turbines Maximum Design Scenario for Shipping and Navigation
Floating foundations are not included in the PDE. Further descriptions of the foundation types under consideration are provided in volume 2, chapter 3.
6.2.3 Offshore Substation Platforms
The offshore substation platforms will be installed on piled jackets or suction caisson jacket foundations, with two types of substation under consideration – High Voltage Alternating Current (HVAC) and High Voltage Direct Current (HVDC). For HVAC offshore substation platforms the maximum topside dimensions are 39×39 m and for HVDC offshore substation platforms are 100×85 m.
6.3 Subsea Infrastructure
6.3 Subsea Infrastructure
Three types of subsea cables will be installed: inter-array cables, interconnector cables and offshore export cables. Each category of subsea cables is summarised in the following subsections.
6.3.1 Inter-Array Cables
The inter-array cables will be fully installed within the Proposed Development array area to connect individual wind turbines to each other and to the offshore substation platforms. Up to 661 nm (1,225 km) of inter-array cables will be required with up to 78 crossings, although the final length and number of crossings will depend upon the final array layout. The maximum height of inter-array cable crossings will be 3.5 m.
6.3.2 Interconnector Cables
The interconnector cables will be fully installed within the Proposed Development array area to provide interlink connections between the offshore substation platforms. Up to 46 nm (85 km) of interconnector cables will be required, although the final length will depend upon the final array layout.
6.3.3 Offshore Export Cables
The offshore export cables will be installed within the Proposed Development export cable corridor to carry the electricity generated by the wind turbines to the landfall location (Skateraw). Up to eight offshore export cables and 471 nm (872 km) of offshore export cables will be required with up to 16 crossings. The maximum height of offshore export cables crossings will be 3.5 m.
6.3.4 Cable Burial and Protection
Where available, the primary means of cable protection will be by seabed burial. The extent and method by which the subsea cables will be buried will depend on the results of a detailed seabed survey of the final subsea cable routes and associated cable burial risk assessment. However, a minimum burial depth of 0.5 m for all subsea cables associated with the Proposed Development is assumed as part of the maximum design scenario.
Where cable burial is not possible, alternative cable protection methods may be deployed which will be determined within the cable burial risk assessment. These methods may include a combination of rock installation, concrete mattresses, rock bags, cast iron shells, sleeving and Cable Protection Systems (CPS). It is assumed that up to 15% of all subsea cables may require cable protection as part of the maximum design scenario with a maximum cable protection height of 3 m and width of 20 m (excluding crossings).
6.4 Timescales
6.4 Timescales
6.4.1 Construction Phase
The offshore construction phase will indicatively commence in December 2025, last for up to eight years, and be undertaken in up to three phases.
6.4.2 Operation and Maintenance Phase
The operation and maintenance phase will last for up to 35 years.
6.4.3 Decommissioning Phase
The decommissioning phase will generally be the reverse of the construction phase in terms of duration, vessel types and vessel numbers. It is anticipated that all sea surface structures will be completely removed above the seabed and all subsea cables will be left in situ (although best practice will be followed at the time of decommissioning).
6.5 Vessel and Helicopter Numbers
6.5 Vessel and Helicopter Numbers
This subsection provides an overview of maximum vessel numbers for each activity and phase of the Proposed Development. Details relating to the routes to be undertaken by vessels associated with the Proposed Development are not available at this stage but will be defined as part of marine coordination (see section 6.5.2). Return trips may not occur uniformly throughout each phase depending on factors such as relevant activities and crew transfer times.
6.5.1 Construction Phase
Up to 10,964 return trips by construction vessels (excluding site preparation activities) may be made throughout the construction phase. The maximum number of vessel types associated with construction phase activities are summarised in Table 6.4 Open ▸ .
Table 6.4 Maximum Vessel Numbers per Vessel Type for Construction Phase
Additionally, up to 3,214 return trips by up to 13 helicopters may be made during the construction phase.
6.5.2 Operation and Maintenance Phase
Up to 2,323 return trips per year by operation and maintenance vessels may be made throughout the operation and maintenance phase.[4] The maximum number of vessel types associated with the operation and maintenance phase are summarised in Table 6.5 Open ▸ .
Table 6.5 Maximum Vessel Numbers per Vessel Type for Operation and Maintenance Phase
During both the construction and operation and maintenance phases, logistics will be managed by a marine coordination team. An integrated Health, Safety and Environment (HSE) management system will be in place to ensure control of all vessels and their respective works. The Project will be operational 24/7.
6.5.3 Decommissioning Phase
As noted in section 6.4.3, the decommissioning phase will generally be the reverse of the construction phase including in terms of vessel types and vessel numbers.
6.6 Maximum Design Scenario
6.6 Maximum Design Scenario
The maximum design scenario for each shipping and navigation hazard is provided in Table 6.6 Open ▸ and is based on the parameters described in the previous subsections.
Table 6.6 Maximum Design Scenario by Hazard for Shipping and Navigation
7 Navigational Features
7 Navigational Features
A plot of navigational features in proximity to the Proposed Development array area and export cable corridor is presented in Figure 7.1 Open ▸ . Each of the features shown is discussed in the following subsections and has been identified using the most detailed UKHO Admiralty Charts available.
Figure 7.1 General Overview of Navigational Features in Proximity to the Proposed Development
7.1 Other Offshore Wind Farm Developments
7.1 Other Offshore Wind Farm Developments
A plot of nearby other offshore wind farm developments in proximity to the Proposed Development is presented in Figure 7.2 Open ▸ , colour-coded by development status.
Figure 7.2 Offshore Wind Farm Developments in Proximity to the Proposed Development
The closest offshore wind farm developments to the Proposed Development array area are Seagreen Offshore Wind Farm (hereafter referred to as ‘Seagreen’) located approximately 2.7 nm to the north, and Inch Cape Offshore Wind Farm (hereafter referred to as ‘Inch Cape’) located approximately 4.1 nm to the west. It is noted that these distances are measured between the consented boundaries of the respective developments[5].
Seagreen is under construction with the construction buoyage deployed in September 2021 and the development expected to be fully commissioned in November 2023 (Seagreen Wind Energy Ltd., 2020). A variation to development parameters for Inch Cape was consented in June 2019, with CfD secured in July 2022 (Department for Business, Energy and Industrial Strategy (BEIS), 2022).
NnG is also located in the region, approximately 8.8 nm to the west of the Proposed Development array area. NnG is under construction with the construction buoyage deployed in May 2020 and the development expected to be fully commissioned in November 2022 (EDF, 2020).
Other offshore wind farm developments in the region include Kincardine (operational), European Offshore Wind Deployment Centre (EOWDC) (operational), Forthwind (scoped) and ScotWind sites Cluaran Deas Ear, Morven, Bellrock, Campion, Mara Mhor, and Ossian (all areas of search). Further details are included in section 14.1.
7.2 Ports and Related Services
7.2 Ports and Related Services
A plot of nearby ports and harbours is presented in Figure 7.3 Open ▸ . It is noted that there are other ports and harbours within the Firth of Forth not labelled in Figure 7.3 Open ▸ , but for clarity only the more prominent ports and harbours are shown. Ports and harbours within the Firth of Forth are considered collectively throughout the NRA.
Figure 7.3 Ports and Harbours in Proximity to the Proposed Development
The closest port or harbour to the Proposed Development array area is Arbroath Harbour, located approximately 23 nm to the north-west, on the Angus coast. The Admiralty Sailing Directions describe Arbroath as “mainly a fishing port used by small and medium-sized fishing vessels” which is also occupied by a yacht marina (UKHO, 2021).
Montrose Port is located approximately 24 nm to the north-west on the Angus coast and is described by the Admiralty Sailing Directions as “a commercial port and a supply base for the offshore oil industry” (UKHO, 2021).
7.2.1 Ports and Harbours within the Firth of Forth
The Firth of Forth contains many ports and harbours of varying sizes, including:
- Aberdour;
- Anstruther;
- Braefoot Bay;
- Burntisland;
- Cockenzie;
- Crail;
- Grangemouth;
- Granton;
- Leith;
- Methil;
- North Berwick;
- North Queensferry;
- Pettycur Pier;
- Pittenweem;
- Rosyth; and
- St. Monans.
Grangemouth is “the largest port in Scotland” and handles “all types of vessels, including container vessels, tankers and LPG carriers” (UKHO, 2021). Rosyth, Leith and Braefoot Bay are also prominent ports which handle a range of vessel types.
A VTS – the Forth and Tay Navigation Service – is operated from Grangemouth with “all vessels of 50 GT and over required to report on passing the eastern limit and at all subsequent reporting points” (UKHO, 2021). Forth Ports have confirmed during consultation that the VTS does not extend as far out as the Firth of Forth offshore wind farm developments, including the Proposed Development array area. Forth Ports do not advise vessel traffic as far offshore as the Proposed Development array area.
7.2.2 Vessel Arrivals
The number of vessel arrivals at ports in the region, as reported by the Department for Transport (DfT), is presented in Figure 7.4 Open ▸ . These statistics exclude some vessel movements which occur within port or harbour limits, but nevertheless give a clear indication of the relative traffic levels and trends.
Figure 7.4 Vessel Arrivals to Commercial Ports in Proximity to the Proposed Development
As a collective, ports in the Forth are the most frequented commercial ports in the area followed by Aberdeen, although both ports have experienced a slight downward trend in vessel arrivals in recent years. In the case of Aberdeen, this may be partially related to the effects of COVID-19 pandemic.
7.3 Aids to Navigation
7.3 Aids to Navigation
A plot of nearby aids to navigation is presented in Figure 7.5 Open ▸ . The information provided in Figure 7.5 Open ▸ and the following text is current as of August 2022.
Figure 7.5 Aids to Navigation in Proximity to the Proposed Development
There are no aids to navigation located within the Proposed Development array area – there are, however, scientific buoys and Light Detection and Ranging (Lidar) equipment present to gauge readings.
There is one aid to navigation located within the Proposed Development export cable corridor, a special mark situated in the approaches to Torness Power Station at the Skateraw landfall location.
There is a group of nine aids to navigation located west of the Proposed Development array area. These form the construction buoyage for NnG, and were deployed in May 2020, as confirmed by NLB during consultation. They are expected to be removed following the commissioning of the development, anticipated in November 2022 (EDF, 2020). Similarly, there is a group of 13 aids to navigation north of the Proposed Development array area that form the construction buoyage for Seagreen that were deployed in September 2021 and expected to be removed in September 2023 post-commissioning of the development.
The Inch Cape Met Mast and Bell Rock Lighthouse, both located west of the Proposed Development array area, also serve as aids to navigation.
7.4 Anchorage Locations
7.4 Anchorage Locations
The majority of anchorage locations in the region are located within the Firth of Forth, where there are numerous designated anchorages and small vessel anchorages. Outside the Forth, there are designated anchorage points in close proximity to various coastal ports and harbours including off Dunbar, between St. Abbs and Eyemouth, off St. Andrews and in Lunan Bay to the south of Montrose.
The closest anchorage location to the Proposed Development array area is the designated anchorage point between St. Abbs and Eyemouth located approximately 19 nm to the south-west. The closest anchorage location to the Proposed Development export cable corridor is the designated anchorage off Dunbar located approximately 3.5 nm to the west of the Skateraw landfall location.
7.5 Military Practice and Exercise Areas
7.5 Military Practice and Exercise Areas
Military Practice and Exercise Areas (PEXA) close to the Proposed Development array area are presented in Figure 7.6 Open ▸ .
Figure 7.6 MoD Practice Areas in Proximity to the Proposed Development (Marine Scotland, 2019)
There are two MoD naval PEXAs located within the Outer Firth of Forth (X5641 and X5642), with area X5642 overlapping the Proposed Development array area. There is also a firing practice area off the Northumberland coast (Druridge Bay) located approximately 19 nm to the south of the Proposed Development array area, covering an area of approximately 2,300 nm2.
In addition, there is a smaller firing range (Barry Buddo) located approximately 24 nm to the west of the Proposed Development array area, at the mouth of the River Tay.
No restrictions are placed on the right to transit a military PEXA at any time, although mariners are advised to exercise caution. Exercises and firing only occur when the area is considered to be clear of all shipping.
There are not anticipated to be any hazards to shipping and navigation users associated with military PEXAs, although military vessels are considered as part of the baseline characterisation of vessel traffic movements in section 10.
7.6 Charted Wrecks
7.6 Charted Wrecks
A plot of charted wrecks is presented in Figure 7.7 Open ▸ . Charted wrecks are those detailed on UKHO Admiralty Charts and are considered to pose a risk to surface navigation or subsea operations. Further details relating to wrecks are provided in volume 4, appendix 22 and the Marine Archaeology Technical Report which accompanies the Application.
Figure 7.7 Wrecks and Obstructions in Proximity to the Proposed Development
There are 10 charted wrecks located within the Proposed Development array area, with the shallowest at 35 m below CD, in the north-west of the Proposed Development array area. There are three charted wrecks located within the Proposed Development export cable corridor, all in the nearshore area.
7.7 Other Features
7.7 Other Features
7.7.1 International Maritime Organization Routeing Measures
There are no IMO routeing measures in the region.
7.7.2 Oil and Gas Infrastructure
There is no surface oil and gas infrastructure in the region, with the closest surface infrastructure the BW Catcher Floating Production Storage and Offloading (FPSO) at the Catcher Area Development, located approximately 73 nm to the east of the Proposed Development array area.
There are some wellheads located in the region, with the closest an abandoned well located approximately 5.9 nm to the north of the Proposed Development array area. All other wells in the region are also abandoned.
7.7.3 Marine Aggregate Dredging Areas
There are no marine aggregate dredging areas in the region, noting that there are no marine aggregate dredging areas currently licensed in Scotland.
7.7.4 Spoil Grounds
There are two areas of spoil ground located approximately 20 nm west of the Proposed Development array area in the approaches to the Firth of Tay. There is also an area of spoil ground located approximately 1.5 nm from the Proposed Development export cable corridor, close to the Skateraw landfall location.
7.7.5 Ammunition Disposal Grounds
There are two ammunition disposal grounds (disused) located approximately 11 nm west of the Proposed Development array area immediately east of the Isle of May.
7.7.6 Submarine Cables and Pipelines
There are no existing submarine cables or pipelines in the region. The export cable associated with NnG is currently being installed and runs between the south-west of the Proposed Development array area and Thorntonloch, on the East Lothian coast. Likewise, the export cable associated with Seagreen is currently being installed and runs between the west of the Proposed Development array area and Carnoustie, on the Angus coast.
7.7.7 Marine Environment High Risk Areas
There is a Marine Environment High Risk Areas (MEHRA) for the Isle of May, located approximately 21 nm west of the Proposed Development at the entrance to the Firth of Forth. MEHRAs are areas along the UK coast designed to “inform [ships’] Masters of areas where there is a real prospect of a problem arising. This prime purpose stands alone and regardless of any consequential defensive measures” (Lord Donaldson, 1994).
8 Meteorological Ocean Data
8 Meteorological Ocean Data
This section presents meteorological and oceanographic statistics local to the Proposed Development. The data presented in this section had been used as input to the collision and allision risk modelling (see section 16).
8.1 Wind
8.1 Wind
Based on wind direction data modelled by Vortex at a nearby location and at 10 m height, the proportion of the wind direction within each 30-degree interval is presented in Figure 8.1 Open ▸ in the form of a wind rose. It can be seen that winds are predominantly from the west to the south.
Figure 8.1 Wind Direction Distribution for Proposed Development
8.2 Wave
8.2 Wave
Based on significant wave height data recorded by Fugro between December 2010 and May 2012 at a location within the Proposed Development array area, the proportion of the sea state within each of three defined ranges, where the sea state is based upon significant wave height, is presented in Table 8.1 Open ▸ . It should be noted that the percentages presented are rounded to one decimal place.
Table 8.1 Sea State Distribution for Proposed Development
8.3 Visibility
8.3 Visibility
Based on information provided in the Admiralty Sailing Directions (UKHO, 2021), the proportion of poor visibility (defined as the proportion of a year where the visibility can be expected to be less than 1 km) is 3%.
8.4 Tide
8.4 Tide
From UKHO Admiralty Chart 1407, currents within and in proximity to the Proposed Development are set in a generally north to south direction on the flood tide and north to south direction on the ebb tide. The greatest peak flood tidal rate is 1.4 knots (kt) and the greatest peak ebb tidal rate is also 1.4 kt. The peak speed and corresponding direction data for the flood and ebb tides for the relevant tidal diamonds on UKHO Admiralty Chart 1407 are presented in Table 8.2 Open ▸
Table 8.2 Peak Flood and Ebb Tidal Data in Proximity to Proposed Development
Based upon the available data, no hazards are expected at high water that would not also be expected at low water, and vice versa. The wind farm structures are not expected to result in any additional risk on the existing tidal streams in relation to their effect on existing shipping and navigation users.
9 Emergency Response
9 Emergency Response
This section summarises the existing Search and Rescue (SAR) resources in the region, and issues being considered in relation to the Proposed Development.
9.1 Search and Rescue Helicopters
9.1 Search and Rescue Helicopters
In July 2022, the Bristow Group were awarded a new 10-year contract by the MCA (as an executive agency of the DfT) beginning in September 2024 to provide helicopter SAR operations in the UK. Bristow have been operating the service since April 2015.
The SAR helicopter service is currently operated out of 10 base locations around the UK, with the closest to the Proposed Development located at Inverness Airport, approximately 94 nm to the north-west. This base operates two AgustaWestland 189 (AW189) helicopters. As part of the new MCA contract, Bristow will also launch two new seasonal bases in Fort William and Carlisle, with the latter likely to be relevant to the Proposed Development.
Of particular note to the Proposed Development array area and export cable corridor is the Prestwick SAR helicopter base 100 nm west of the Proposed Development array area, from which all SAR helicopter taskings in the Proposed Development export cable corridor departed from (see section 9.1.2).
The DfT has produced data on civilian SAR helicopter activity in the UK by the Bristow Group on behalf of the MCA between April 2015 and March 2021.
9.1.1 Proposed Development Array Area
The locations of SAR helicopter taskings within the Proposed Development array area shipping and navigation study area is presented in Figure 9.1 Open ▸ , colour-coded by tasking type.
Figure 9.1 DfT SAR Helicopter Taskings Data within Proposed Development Array Area Shipping and Navigation Study Area by Type (2015 to 2021)
There were two unique SAR incidents in the Proposed Development array area shipping and navigation study area between April 2015 and March 2021. Both taskings originated from the Inverness base with one involving a rescue/recovery and one involving a search only. The rescue/recovery tasking was supported and completed. The search-only tasking was complete with no casualties found. No SAR incidents were recorded within the Proposed Development array area itself.
9.1.2 Proposed Development Export Cable Corridor
The locations of SAR helicopter taskings within the Proposed Development export cable corridor shipping and navigation study area is presented in Figure 9.2 Open ▸ , colour-coded by tasking type.
Figure 9.2 DfT SAR Helicopter Taskings Data within Proposed Development Export Cable Corridor Shipping and Navigation Study Area by Type (2015 to 2021)
There were six SAR incidents in the Proposed Development export cable corridor shipping and navigation study area between April 2015 and March 2021. All six taskings originated from the Prestwick base. Only one incident was maritime, with three being coastal, and the other two being land-based. The maritime tasking involved a rescue/recovery and was terminated on scene.
9.2 Royal National Lifeboat Institution
9.2 Royal National Lifeboat Institution
The RNLI is organised into six divisions, with the relevant region for the Proposed Development being ‘Scotland’. Based out of more than 230 stations around the UK, there are over 400 active lifeboats across the RNLI fleet, including both all-weather lifeboats (ALB) and inshore lifeboats (ILB). RNLI lifeboats are available on a 24-hour basis throughout the year.
The closest RNLI station to the Proposed Development array area is at Eyemouth, located approximately 19 nm to the south-west, where both an ALB and ILB are in use. It is noted that the RNLI have a strategic performance standard of reaching casualties up to a maximum of 100 nm offshore.
As noted in section 9.2, the RNLI have a strategic performance standard of reaching casualties up to a maximum of 100 nm offshore.
The locations of incidents responded to by the RNLI within the Proposed Development array area shipping and navigation and export cable corridor study areas between 2010 and 2019 are presented in Figure 9.3 Open ▸ , colour-coded by incident type. The same data is presented in Figure 9.4 Open ▸ , colour-coded by casualty type. It is noted that hoaxes and false alarms have been excluded from the analysis.
Figure 9.3 RNLI Incident Data within Proposed Development Array Area Shipping and Navigation and Export Cable Corridor Study Areas by Incident Type (2010 to 2019)
Figure 9.4 RNLI Incident Data within Proposed Development Array Area Shipping and Navigation and Export Cable Corridor Study Areas by Casualty Type (2010 to 2019)
A total of 14 RNLI lifeboat launches to 11 unique incidents were reported within the Proposed Development array area shipping and navigation study area, corresponding to an average of one unique incident per year. Incidents were primarily located inshore of the Proposed Development array area.
Of the 14 unique incidents in the Proposed Development array area shipping and navigation study area, the most frequently recorded incident types were flooding/foundering and vessel may be in trouble (27% each). The other incident types recorded were machinery failure (18%), other (9%), person in danger (9%), and steering failure (9%).
Of the 14 unique vessels related to the recorded incidents in the Proposed Development array area shipping and navigation study area, the most frequently recorded casualties were recreational sailing vessels (45%) and fishing vessels (36%).
There was one incident recorded within the Proposed Development array area itself, involving an ‘other recreational’ vessel which may be in trouble.
The most common base stations recorded for lifeboat launches for incidents in the Proposed Development array area shipping and navigation study area was Eyemouth (45%) followed by Dunbar (18%) and Montrose (18%). Lifeboat launches were also reported out of the stations at Arbroath and Stonehaven.
A total of 65 RNLI lifeboat launches to 48 unique incidents were reported within the Proposed Development export cable corridor shipping and navigation study area, corresponding to an average of approximately five unique incidents per year. Incidents were primarily located close to the shoreline.
Of the 48 unique incidents in the Proposed Development export cable corridor shipping and navigation study area, the most frequently recorded incident types were machinery failure (36%) and person in danger (20%). Other recorded incident types included vessel may be in trouble (18%), collision (4%), steering failure (4%), capsize (2%), and flooding/foundering (2%). Incidents classed as ‘other’ comprised 13% of all unique incidents in the Proposed Development export cable corridor shipping and navigation study area. Incidents where the type was unspecified were not included in this analysis.
Of the 48 unique incidents in the Proposed Development export cable corridor shipping and navigation study area, recorded casualty types included fishing vessels (25%), powered recreational vessels (21%), person in danger (17%), personal craft (17%), sailing recreational vessels (10%), other recreational vessels (6%), other (non-vessel based) (2%), and other (vessel based) (2%).
There were nine incidents recorded within the Proposed Development export cable corridor itself, corresponding to approximately one incident per year. Of these incidents, the most frequently recorded incident types were machinery failure and vessel may be in trouble (22% each). Incidents where the type was unspecified were not included in this analysis. The most frequently recorded casualty types were personal craft (33%), fishing vessels (22%), and powered recreational vessels (22%).
The base station recorded for lifeboat launches for incidents in the Proposed Development export cable corridor shipping and navigation study area was Dunbar.
9.3 Maritime Rescue Coordination Centres and Joint Rescue Coordination Centres
9.3 Maritime Rescue Coordination Centres and Joint Rescue Coordination Centres
Her Majesty’s Coastguard (HMCG), a division of the MCA, is responsible for requesting and tasking SAR resources made available to other authorities and for coordinating the subsequent SAR operations (unless they fall within military jurisdiction).
The HMCG coordinates SAR operations through a network of 11 Maritime Rescue Coordination Centres (MRCC), including a Joint Rescue Coordination Centre (JRCC) based in Hampshire.
All of the MCA’s operations, including SAR, are divided into three geographical regions. The ‘Scotland’ region covers the area encompassing the Proposed Development.
Each region is divided into six districts with its own MRCC, which coordinates the SAR response for maritime and coastal emergencies within its own district boundaries. The closest MRCC to the Proposed Development is at Aberdeen, located approximately 40 nm north of the Proposed Development array area.
9.4 Global Maritime Distress and Safety System
9.4 Global Maritime Distress and Safety System
The Global Maritime Distress and Safety System (GMDSS) is a maritime communications system used for emergency and distress messages, vessel to vessel routeing communications and vessel to shore routine communications. It is implemented globally and vessels engaged in international voyages are obliged to carry GMDSS certified communication equipment.
There are four GMDSS sea areas, and in the UK, it is the responsibility of the MCA to ensure Very High Frequency (VHF) coverage from coastal stations within sea area A1. the Proposed Development is located within an A1 sea area, as shown in Figure 9.5 Open ▸ , and therefore in the event of an emergency any vessel located in proximity to the Proposed Development would be able to contact HMCG via VHF.
Figure 9.5 GMDSS Sea Areas (MCA, 2021)
9.5 Marine Accident Investigation Branch
9.5 Marine Accident Investigation Branch
All UK flagged vessels and non-UK flagged vessels in UK territorial waters (12 nm), a UK port, or carrying passengers to a UK port are required to report incidents to the MAIB.
The locations of accidents, injuries and hazardous incidents reported to the MAIB within the Proposed Development array area shipping and navigation and export cable corridor study areas between 2010 and 2019 are presented in Figure 9.6 Open ▸ , colour-coded by incident type. The same data is presented in Figure 9.7 Open ▸ , colour-coded by vessel type.
Figure 9.6 MAIB Incident Data within Proposed Development Array Area Shipping and Navigation and Export Cable Corridor Study Areas by Incident Type (2010 to 2019)
Figure 9.7 MAIB Incident Data within Proposed Development Array Area Shipping and Navigation and Export Cable Corridor Study Areas by Vessel Type (2010 to 2019)
A total of three unique incidents were reported to the MAIB within the Proposed Development array area shipping and navigation study area, corresponding to an average of approximately one incident every three years. Two of these incidents occurred inshore of the Proposed Development array area with the other occurring north of the Proposed Development array area. No incidents were reported to the MAIB within or offshore of the Proposed Development array area, with the closest reported approximately 5 nm west of the Proposed Development array area.
Of the three incidents, there was one instance each of machinery failure, loss of control, and accident to person. All three incidents involved a fishing vessel. None of the incidents required the incident vessel to be towed or salvaged. There was one injury recorded, but no fatalities occurred.
A review of older MAIB incident data within the Proposed Development array area shipping and navigation study area between 2000 and 2009 indicates that the number of incidents has decreased over time, with four unique incidents recorded in the ten-year period, corresponding to an average of one incident every two to three years. Of the recorded incidents, all four incident types were machinery failure. Three of the vessels involved were fish catching/processing, with the other being a tanker.
A total of 14 unique incidents were reported to the MAIB within the Proposed Development export cable corridor shipping and navigation study area, corresponding to an average of approximately one to two incidents every year. Two of these incidents involved two vessels, resulting in a total of 16 vessels involved in incidents. Incidents were primarily located close to the shoreline.
Of the 14 unique incidents in the Proposed Development export cable corridor shipping and navigation study area, the most frequently recorded incident type was machinery failure (79%). The other two incident types recorded were hazardous incidents (14%) and flooding/foundering (7%).
Of the 16 vessels involved in the incidents in the Proposed Development export cable corridor shipping and navigation study area, the most frequently recorded vessel type was fishing vessels (81%).
There were four incidents recorded within the Proposed Development export cable corridor itself, all of which occurred close to the shoreline. Three of these incidents related to machinery failure for a fishing vessel with the other related to a hazardous incident between a tanker and a fishing vessel. None of the incidents required the incident vessel to be towed or salvaged. There were no injuries or fatalities noted for any of the recorded incidents.
A review of older MAIB incident data within the Proposed Development export cable corridor shipping and navigation study area between 2000 and 2009 indicates that the number of incidents has also decreased over time, with 18 unique incidents recorded in the ten-year period, corresponding to an average of just under two incidents every year. There were two instances of hazardous incidents between two vessels – one between a dry cargo vessel and fish catching/processing vessel, and another between a passenger cargo vessel and fish catching/processing vessel. Of the total recorded incidents in the Proposed Development export cable corridor, incident types were primarily machinery failure (72%), with hazardous incidents (22%) and accident to person (6%) also noted. Vessel types primarily involved included fish catching/processing (70%) and dry cargo (10%).
9.6 Historical Offshore Wind Farm Incidents
9.6 Historical Offshore Wind Farm Incidents
As of August 2022, there are 41 fully commissioned and generating offshore wind farms in the UK, ranging from the North Hoyle Offshore Wind Farm (fully commissioned in 2003) to Triton Knoll Offshore Wind Farm (fully commissioned in 2022). These developments consist of approximately 18,850 fully operational wind turbine years.
9.6.1 Incidents Involving UK Offshore Wind Farm Developments
MAIB incident data has been used to collate a list of historical collision and allision incidents involving UK offshore wind farm developments, which are summarised in Table 9.1 Open ▸ . Other sources have also been used to produce this list including the UK Confidential Human Factors Incident Reporting Programme (CHIRP) for Aviation and Maritime, International Marine Contractors Association (IMCA) and basic web searches. This list is limited to collision and allision incidents given their specific relevance to shipping and navigation. Only incidents that have been formally reported are captured.
The worst consequences reported for vessels involved in a collision or allision incident involving a UK offshore wind farm development have been related to minor flooding, with no life-threatening injuries to persons reported.
As of August 2022, there have been no collisions as a result of the presence of an offshore wind farm in the UK. The only reported collision incident in relation to a UK offshore wind farm involved a project vessel hitting a third-party vessel whilst in harbour.
As of August 2022, there have been 13 reported[6] cases of an allision between a vessel and a wind turbine (under construction, operational or disused) in the UK, with all but two involving a support vessel for the development and the errant vessel in each case under power rather than drifting. Therefore, there has been an average of 1,570 years of wind turbine operation per wind turbine allision incident in the UK. This is a conservative calculation given that only operational wind turbine years have been included (whereas allision incidents counted include non-operational wind turbines).
Table 9.1 Summary of Historical Collision and Allision Incidents Involving UK Offshore Wind Farm Developments
9.6.2 Incidents Involving Non-UK Offshore Wind Farms
It is acknowledged that collision and allision incidents involving non-UK offshore wind farm developments have also occurred. However, it is not possible to maintain a comprehensive list of such incidents.
One high profile non-UK incident which is noted is that involving a bulk carrier in January 2022 which dragged anchor during a storm in Dutch waters and collided with another anchored vessel. The vessel began to take on water, leading to all crew members being evacuated by helicopter. The vessel then continued to drift towards shore including though an under construction offshore wind farm where it allided with a WTG foundation and a platform foundation before being taken under tow.
9.6.3 Incidents Responded to by Vessels Associated with UK Offshore Wind Farm Developments
A list has been collated from news reports, basic web searches and experience of working with existing offshore wind farm developments, of historical incidents responded to by vessels associated with UK offshore wind farm developments. This list is summarised in Table 9.2 Open ▸ . It is noted that the initial causes of these incidents were not related to the associated offshore wind farms.
Table 9.2 Open ▸ comprises known incidents that were responded to by a wind farm vessel. Additional incidents associated with wind farms themselves are also known to have occurred. These incidents typically involve an accident to person which requires medical attention (including emergency response) but does not affect the operation of the vessel involved.
Table 9.2 Historical Incidents Responded to by Vessels Associated with UK Offshore Wind Farm Developments
10 Vessel Traffic Movements
10 Vessel Traffic Movements
This section presents an analysis of vessel traffic movements in relation to the Proposed Development array area and export cable corridor. The methodology for vessel traffic data collection, including details of the on-site vessel traffic surveys, is provided in section 5.2.
10.1 Proposed Development Array Area
10.1 Proposed Development Array Area
A number of vessel tracks recorded during the Proposed Development array area survey periods were classified as temporary (non-routine), such as the tracks of the survey vessel, other non-routeing survey vessels and vessels associated with the construction of NnG and Seagreen. These have therefore been excluded from the analysis.
A plot of the vessel tracks recorded during a 14-day survey period in August 2022, colour-coded by vessel type and excluding temporary traffic, is presented in Figure 10.1 Open ▸ . A plot of the vessel tracks recorded during a further 14-day survey period in January 2021, colour-coded by vessel type and excluding temporary traffic, is presented in Figure 10.2 Open ▸ .
Figure 10.1 Vessel Traffic Movements within Proposed Development Array Area Shipping and Navigation Study Area by Vessel Type (14 Days Summer 2022)
Figure 10.2 Vessel Traffic Movements within Proposed Development Array Area Shipping and Navigation Study Area by Vessel Type (14 Days Winter 2021)
Plots of the vessel tracks for the summer and winter survey periods converted to a density heat map are presented in Figure 10.3 Open ▸ and Figure 10.4 Open ▸ , respectively. It can be seen that, during the summer period there is negligible vessel density where the Proposed Development array area overlaps Seagreen. In contrast, during the winter period (which predates the start of Seagreen construction) some vessel density was observed where the Proposed Development array area overlaps Seagreen.
Figure 10.3 Vessel Density Heat Map within Proposed Development Array Area Shipping and Navigation Study Area (14 Days Summer 2022)
Figure 10.4 Vessel Density Heat Map within Proposed Development Array Area Shipping and Navigation Study Area (14 Days Winter 2021)
10.1.1 Vessel Counts
For the 14 days analysed in the summer survey period, there was an average of 14 unique vessels per day recorded within the Proposed Development array area shipping and navigation study area. In terms of vessels intersecting the Proposed Development array area itself, there was an average of three to four unique vessels per day.
The daily number of unique vessels recorded within the Proposed Development array area shipping and navigation study area and the Proposed Development array area itself during the summer survey period are presented in Figure 10.5 Open ▸ . Since the survey commenced and concluded midway through the first and last days of the summer survey period (as described in section 5.2), the first and last days are partial.
Figure 10.5 Unique Vessels per Day within the Proposed Development Array Area and Shipping and Navigation Study Area (14 Days Summer 2022)
Throughout the summer survey period, approximately 25% of unique vessel tracks recorded within the Proposed Development array area shipping and navigation study area intersected the Proposed Development array area itself.
The busiest day recorded within the Proposed Development array area shipping and navigation study area throughout the summer survey period was 12 August when 25 unique vessels were recorded. The busiest days recorded within the Proposed Development array area itself throughout the summer survey period was 11 August when eight unique vessels were recorded.
The quietest full days recorded within the Proposed Development array area shipping and navigation study area throughout the summer survey period were 7 August and 1 August when nine unique vessels were recorded each. The quietest full days recorded within the Proposed Development array area itself throughout the summer survey period were 7 August and 15 August when one unique vessel was recorded each.
For the 14 days analysed in the winter survey period, there was an average of 14 unique vessels per day recorded within the Proposed Development array area shipping and navigation study area. In terms of vessels intersecting the Proposed Development array area itself, there was an average of five unique vessels per day.
The daily number of unique vessels recorded within the Proposed Development array area shipping and navigation study area and the Proposed Development array area itself during the winter survey period are presented in Figure 10.6 Open ▸ .
Figure 10.6 Unique Vessels per Day within Proposed Development Array Area and Shipping and Navigation Study Area (14 Days Winter 2021)
Throughout the winter survey period approximately 36% of unique vessel tracks recorded within the Proposed Development array area shipping and navigation study area intersected the Proposed Development array area itself.
The busiest day recorded within the Proposed Development array area shipping and navigation study area throughout the winter survey period was 23 January when 24 unique vessels were recorded. The busiest day recorded within the Proposed Development array area itself throughout the winter survey period was also 23 January when nine unique vessels were recorded.
The quietest day recorded within the Proposed Development array area shipping and navigation study area throughout the winter survey period was 12 January when nine unique vessels were recorded. The quietist day recorded within the Proposed Development array area itself throughout the winter survey period was 17 January when one unique vessel was recorded.
10.1.2 Vessel Types
The percentage distribution of the main vessel types recorded within the Proposed Development array area shipping and navigation study area and the Proposed Development array area itself is presented in Figure 10.7 Open ▸ .
Figure 10.7 Vessel Type Distribution within Proposed Development Array Area and Shipping and Navigation Study Area (28 Days Summer 2022 and Winter 2021)
Throughout the summer period, the most common vessel types in the Proposed Development array area shipping and navigation study area were tankers (30%), cargo vessels (23%), and passenger vessels (12%). Throughout the winter period, the most common vessel types were cargo vessels (37%), tankers (32%), and fishing vessels (13%).
It is noted that no commercial ferries were identified in the winter vessel traffic survey data, which aligns with feedback provided by Forth Ports during consultation (see 10 June 2020 entry in Table 4.1 Open ▸ ).
10.1.2.1 Cargo Vessels
The tracks of cargo vessels recorded within the Proposed Development array area shipping and navigation study area throughout the summer 2022 survey period are presented in Figure 10.8 Open ▸ . Following this, the tracks of cargo vessels recorded within the Proposed Development array area shipping and navigation study area throughout the winter 2021 survey period are presented in Figure 10.9 Open ▸ .
Figure 10.8 Cargo Vessel Traffic within Proposed Development Array Area Shipping and Navigation Study Area (14 Days Summer 2022)
Figure 10.9 Cargo Vessel Traffic within Proposed Development Array Area Shipping and Navigation Study Area (14 Days Winter 2021)
Throughout the survey periods an average of four unique cargo vessels per day were recorded within the Proposed Development array area shipping and navigation study area. Regular cargo vessel routeing included north-south following the UK east coast, north-west-south-east out of Montrose and east-west out of the Firth of Forth. Cargo vessels avoided the Seagreen buoyed construction area during the summer period.
The majority of cargo vessels recorded within the Proposed Development array area shipping and navigation study area were general cargo (79%). Other subtypes included bulk carriers (10%) and containerships (8%).
10.1.2.2 Tankers
The tracks of tankers recorded within the Proposed Development array area shipping and navigation study area throughout the summer 2022 survey period are presented in Figure 10.10 Open ▸ . Following this, the tracks of tankers recorded within the Proposed Development array area shipping and navigation study area throughout the winter 2021 survey period are presented in Figure 10.11 Open ▸ .
Figure 10.10 Tanker Traffic within Proposed Development Array Area Shipping and Navigation Study Area (14 Days Summer 2022)
Figure 10.11 Tanker Traffic within Proposed Development Array Area Shipping and Navigation Study Area (14 Days Winter 2021)
Throughout the survey periods an average of four unique tankers per day were recorded within the Proposed Development array area shipping and navigation study area. Regular tanker routeing included east-west out of the Firth of Forth and north-south following the UK east coast. Tankers avoided the Seagreen buoyed construction area during the summer period.
Tanker subtypes recorded within the Proposed Development array area shipping and navigation study area included oil/chemical tankers (30%), oil products tankers (20%) and Liquid Petroleum Gas (LPG) tankers (18%).
10.1.2.3 Commercial Fishing Vessels
Vessel Traffic Survey Data
Commercial fishing vessel data was extracted from the vessel tracks recorded during the vessel traffic surveys. It is noted that the term ‘fishing vessel’ as used throughout this NRA refers to commercial fishing vessels, and any non-commercial fishing activity (such as rod and line angling) is categorised under recreational vessel activity. On this basis the tracks of commercial fishing vessels recorded within the Proposed Development array area shipping and navigation study area throughout both survey periods are presented in Figure 10.12 Open ▸ .
Figure 10.12 Commercial Fishing Vessel Traffic within Proposed Development Array Area Shipping and Navigation Study Area (28 Days Summer 2022 and Winter 2021)
Throughout the survey periods an average of one to two unique commercial fishing vessels per day passed within the Proposed Development array area shipping and navigation study area. Of the commercial fishing vessels recorded, 84% were recorded via AIS with 14% recorded via radar and 2% recoded via visual observations. Although AIS is only mandatory for commercial fishing vessels greater than 15 m LOA, 81% of the commercial fishing vessels recorded using AIS were under 15 m LOA.
Those commercial fishing vessels observed within the Seagreen buoyed construction area were recorded during the winter period, prior to the start of Seagreen construction.
Based on the average speed and behaviour of vessel tracks, there is a substantial volume of the fishing vessel activity in the Proposed Development array area shipping and navigation study area that is characteristic of active fishing rather than transits.
Fishing gear type could only be identified for 28% of the commercial fishing vessels recorded. The most common fishing gear types recorded in the Proposed Development array area shipping and navigation study area throughout the survey periods were potter/whelkers (62%) and demersal trawlers (15%).
Nationality could be identified for 87% of the commercial fishing vessels recorded, with the remaining 13% consisting of the commercial fishing vessels recorded via radar/visual observation. The nationality of all commercial fishing vessels able to be recorded was British.
Vessel Monitoring System Data
In addition to the vessel traffic survey data, Vessel Monitoring System (VMS) data recorded between July 2018 and June 2021 has also been analysed within the Proposed Development array area shipping and navigation study area (noting that this period predates the start of Seagreen construction – Seagreen is included in Figure 10.13 Open ▸ for context). A density grid, using the VMS data during this period as input, is presented in Figure 10.13 Open ▸ .
Figure 10.13 VMS Fishing Vessel Density (July 2018 – June 2021)
The highest density areas were to the north of the Proposed Development array area and within the northern part of Proposed Development array area. This correlates well with the long-term AIS data for fishing vessels during 2019 presented in Appendix E, noting that this also predates the start of Seagreen construction.
Comparison with volume 2, chapter 12
The baseline established in volume 2, chapter 12 indicates that overall commercial fishing activity is most prominent in coastal areas, particularly in the approaches to the Firth of Forth and much further north, south of Stonehaven. Activities around the Firth of Forth are dominated by demersal stern trawlers with activity further north dominated by scallop dredgers, with some contribution from whelkers/potters. The nationality of almost all fishing vessels observed was British.
This shows good agreement with the baseline established in this section, in terms of the fishing gear types and nationalities identified. In terms of the distribution of commercial fishing vessel activity, there is also reasonable agreement, noting that the extent of the Proposed Development array area shipping and navigation study area does not allow for detailed comparison in relation to coastal activities.
10.1.2.4 Oil and Gas Vessels
Vessel Traffic Survey Data
The tracks of oil and gas vessels recorded within the Proposed Development array area shipping and navigation study area throughout both survey periods are presented in Figure 10.14 Open ▸ .
Figure 10.14 Oil and Gas Vessel Traffic within Proposed Development Array Area Shipping and Navigation Study Area (28 Days Summer 2022 and Winter 2021)
Throughout the survey periods an average of one unique oil and gas vessel per day passed through the Proposed Development array area shipping and navigation study area. The majority of these vessels were on passage north-south between Aberdeen and gas fields in the Southern North Sea.
Those oil and gas vessels observed within the Seagreen buoyed construction area were recorded during the winter period, prior to the start of Seagreen construction.
Long-Term Vessel Traffic Data
Following consultation with the UK Chamber of Shipping and Forth Ports, it was confirmed that occasional vessel traffic movements associated with jack-ups, semi-submersibles and other platforms occur in the region.
Although no such activities were identified in the vessel traffic survey data, one such instance was identified in the long-term vessel traffic data; this involved an FPSO being towed by two tugs and supported by two other vessels east-west into Dundee, passing the Proposed Development array area at a minimum distance of approximately 1.8 nm. A plot showing this activity is presented in Appendix E, with Forth Ports confirming in consultation that such activities occur infrequently; based on arrivals data provided by Forth Ports there have been an average of eight rig callings per year at ports in the Forth and Tay in the seven-year period between 2015 and 2021.
10.1.2.5 Recreational Vessels
Vessel Traffic Survey Data
For the purposes of the NRA, recreational activity includes sailing and motor craft of between 2.4 and 24 m LOA. The tracks of recreational vessels recorded within the Proposed Development array area shipping and navigation study area throughout both survey periods are presented in Figure 10.15 Open ▸ .
Figure 10.15 Recreational Vessel Traffic within Proposed Development Array Area Shipping and Navigation Study Area (28 Days Summer 2022 and Winter 2021)
One recreational vessel per day was recorded within the Proposed Development array area shipping and navigation study area during the summer survey period, with none recorded during the winter survey period. All recreational vessels were recorded via AIS, with no recreational vessels recorded via radar.
RYA Coastal Atlas of Recreational Boating
In addition to the vessel traffic survey data, the RYA Coastal Atlas of Recreational Boating (RYA, 2019) has been reviewed for the region. The RYA Coastal Atlas may be used to “help identify and protect areas of importance to recreational boaters, to advise on new development proposals and in discussions over navigational safety”. The RYA Coastal Atlas includes a heat map indicating the density of recreational activity around the UK coast as well as features relevant to recreational boating such as general boating areas, clubs, training centres and marinas.
Figure 10.16 Open ▸ presents a plot of the RYA Coastal Atlas heat map relative to the Proposed Development array area. Following this, Figure 10.17 Open ▸ presents a plot of features relevant to recreational boating.
Figure 10.16 RYA Coastal Atlas Heat Map in Proximity to Proposed Development
Figure 10.17 RYA Coastal Atlas Features in Proximity to Proposed Development
Higher density recreational traffic is observed towards the coast and the Firth of Forth, with a gradual decrease culminating in sparse activity within the Proposed Development array area. There are a number of RYA facilities along the coast in the vicinity, with the nearest general boating area located approximately 13 nm west of the Proposed Development array area.
Consultation Feedback
During consultation, RYA Scotland stated that only around 20% to 25% of cruising vessels in the region transmit an AIS signal (see 9 March and 28 September 2021 entries in Table 4.1 Open ▸ ) and numbers should be multiplied by five to obtain a more accurate estimate of recreational activity. On this basis, from the long-term vessel traffic data (which consists of AIS only) there are estimated to be an average of two to three unique vessels per day.
The Forth Yacht Clubs Association indicated that smaller recreational vessels – which are less likely to carry AIS – generally route inshore of the Proposed Development array area (see 28 September 2021 entry in Table 4.1 Open ▸ ). This correlates with the density heat map and general boating areas from the RYA Coastal Atlas which highlight more coastal areas as popular for recreational vessels.
10.1.2.6 Passenger Vessels
Vessel Traffic Survey Data
Figure 10.18 Open ▸ presents the passenger vessels recorded within the Proposed Development array area study area during the summer survey period.
Figure 10.18 Passenger Vessel Traffic within Proposed Development Array Area Shipping and Navigation Study Area (14 Days Summer 2022)
An average of one to two unique passenger vessels per day were recorded within the Proposed Development shipping and navigation study area during the summer survey period, with all passenger vessels recorded being cruise liners on destinations to/from ports in the Firth of Forth. No passenger vessels were recorded within the Proposed Development array area shipping and navigation study area throughout the winter survey period, however. Following an assessment of long-term vessel traffic data (see Appendix E), it is concluded that this, as well as the lack of regularly scheduled passenger vessels, is likely a result of the COVID-19 pandemic which has had a substantial effect on shipping movements globally (see section 5.4.3).
Consultation Feedback
During consultation, Forth Ports confirmed that during the COVID-19 pandemic there were no visits by cruise ships to the Firth of Forth, but under normal circumstances there are around 125 visits per year by cruise ships. An estimated 170 passenger vessel transits were observed within the long-term vessel traffic data in and out of the Firth of Forth. However it is noted that the Proposed Development array area shipping and navigation study area does not capture all passenger vessel movements in and out of the Firth of Forth, and due to cruise schedules numbers are subject to fluctuation season on season.
10.1.3 Vessel Sizes
10.1.3.1 Vessel Length Overall
A plot of all vessel tracks (excluding temporary traffic) recorded within the Proposed Development array area shipping and navigation study area throughout the survey periods, colour-coded by length overall (LOA), is presented in Figure 10.19 Open ▸ . Following this, the distribution of these LOA classes by survey period is presented in Figure 10.20 Open ▸ .
Figure 10.19 Vessel Traffic Movements within Proposed Development Array Area Shipping and Navigation Study Area by Vessel LOA (28 Days Summer 2022 and Winter 2021)
Figure 10.20 Vessel LOA Distribution within Proposed Development Array Area and Shipping and Navigation Study Area (28-Days Summer 2022 and Winter 2021)
Vessel LOA was available for approximately 98% of vessels recorded in the Proposed Development array area shipping and navigation study area throughout both survey periods and ranged from 8 m for a potter fishing vessel to 330 m for three crude oil tankers.
Excluding the vessels for which an LOA was not available, the average LOA of all vessels within the Proposed Development array area shipping and navigation study area throughout the summer and winter survey periods was 89 m and 94 m, respectively.
10.1.3.2 Vessel Draught
A plot of all vessel tracks (excluding temporary traffic) recorded within the Proposed Development array area shipping and navigation study area throughout the survey periods, colour-coded by draught, is presented in Figure 10.21 Open ▸ . Following this, the distribution of these draught classes by survey period is presented in Figure 10.22 Open ▸ .
Figure 10.21 Vessel Traffic Movements within Proposed Development Array Area Shipping and Navigation Study Area by Vessel Draught (28 Days Summer 2022 and Winter 2021)
Figure 10.22 Vessel Draught Distribution within Proposed Development Array Area and Shipping and Navigation Study Area (28-Days Summer 2022 and Winter 2021)
Vessel draught was available for approximately 67% of vessels recorded in the Proposed Development array area shipping and navigation study area throughout both survey periods and ranged from 1.2 m for a wind farm support vessel to 20 m for a crude oil tanker.
Excluding the vessels for which a draught was not available, the average draught of all vessels within the Proposed Development array area shipping and navigation study area throughout the summer and winter survey periods was 5.2 m and 5.8 m, respectively.
10.1.4 Anchoring Activity
Anchored vessels can be identified based upon the AIS navigational status which is programmed on the AIS transmitter on board a vessel. However, information is manually entered into the AIS, and therefore it is common for vessels not to update their navigational status if only at anchor for a short period of time.
For this reason, those vessels which travelled at a speed of less than 1 kt for more than 30 minutes had their corresponding vessel tracks individually checked for patterns characteristic of anchoring activity. After applying these criteria, no vessels were deemed to be at anchor within the Proposed Development array area shipping and navigation study area.
10.2 Proposed Development Export Cable Corridor
10.2 Proposed Development Export Cable Corridor
A number of tracks recorded during the Proposed Development export cable corridor survey periods were classified as temporary (non-routine), such as the tracks of non-routine survey vessels and vessels associated with the construction of NnG. These have therefore been excluded from the analysis.
A plot of the vessel tracks recorded during a 14-day survey period in July 2020, colour-coded by vessel type and excluding temporary traffic, is presented in Figure 10.23 Open ▸ . A plot of the vessel tracks recorded during a further 14-day survey period in January 2021, colour-coded by vessel type and excluding temporary traffic, is presented in Figure 10.24 Open ▸ .
Figure 10.23 Vessel Traffic Movements within Proposed Development Export Cable Corridor Shipping and Navigation Study Area by Vessel Type (14 Days Summer 2022)
Figure 10.24 Vessel Traffic Movements within Proposed Development Export Cable Corridor Shipping and Navigation Study Area by Vessel Type (14 Days Winter 2021)
Plots of the vessel tracks for the summer and winter survey periods converted to a density heat map are presented in Figure 10.25 Open ▸ and Figure 10.26 Open ▸ , respectively.
Figure 10.25 Vessel Density Heat Map within Proposed Development Export Cable Corridor Shipping and Navigation Study Area (14 Days Summer 2022)
Figure 10.26 Vessel Density Heat Map within Proposed Development Export Cable Corridor Shipping and Navigation Study Area (14 Days Winter 2021)
10.2.1 Vessel Counts
For the 14 days analysed in the summer survey period, there was an average of 29 unique vessels per day recorded within the Proposed Development export cable corridor shipping and navigation study area. In terms of vessels intersecting the Proposed Development export cable corridor itself, there was an average of 25 unique vessels per day.
The daily number of unique vessels recorded within the Proposed Development export cable corridor shipping and navigation study area and the Proposed Development export cable corridor itself during the summer survey period are presented in Figure 10.27 Open ▸ . Since the survey commenced and concluded midway through the first and last days of the summer survey period (as described in section 5.2), the first and last days are partial.
Figure 10.27 Unique Vessels per Day within the Proposed Development Export Cable Corridor Area and Shipping and Navigation Area (14 Days Summer 2022)
Throughout the summer survey period approximately 87% of unique vessel tracks recorded within the Proposed Development export cable corridor shipping and navigation study area intersected the Proposed Development export cable corridor itself.
The busiest day recorded within the Proposed Development export cable corridor shipping and navigation study area throughout the summer survey period was 4 August when 39 unique vessels were recorded. The busiest day recorded within the Proposed Development export cable corridor itself throughout the summer survey period was 5 August when 34 unique vessels were recorded.
The quietest full day recorded within the Proposed Development export cable corridor shipping and navigation study area throughout the summer survey period was 7 August when 18 unique vessels were recorded. The quietest full day recorded within the Proposed Development export cable corridor itself throughout the summer survey period was also 7 August when 15 unique vessels were recorded.
For the 14 days analysed in the winter survey period, there was an average of 19 unique vessels per day recorded within the Proposed Development export cable corridor shipping and navigation study area. In terms of vessels intersecting the Proposed Development export cable corridor itself, there was an average of 18 unique vessels per day.
The daily number of unique vessels recorded within the Proposed Development export cable corridor shipping and navigation study area and the Proposed Development export cable corridor itself are presented in Figure 10.28 Open ▸ .
Figure 10.28 Unique Vessels per Day within the Proposed Development Export Cable Corridor Area and Shipping and Navigation Study Area (14 Days Winter 2021)
Throughout the winter survey period approximately 92% of unique vessel tracks recorded within the Proposed Development export cable corridor shipping and navigation study area intersected the Proposed Development export cable corridor itself.
The busiest day recorded within the Proposed Development export cable corridor shipping and navigation study area throughout the winter survey period was 19 January when 27 unique vessels were recorded. The busiest days recorded within the Proposed Development export cable corridor itself throughout the winter survey period was 24 January when 24 unique vessels were recorded.
The quietest days recorded within the Proposed Development export cable corridor shipping and navigation study area throughout the winter survey period were 14 January and 16 January when 13 unique vessels were recorded each. The quietest day recorded within the Proposed Development export cable corridor itself throughout the winter survey period was 11 January when 11 unique vessels were recorded.
10.2.2 Vessel Types
The percentage distribution of the main vessel types recorded within the Proposed Development export cable corridor shipping and navigation study area is presented in Figure 10.29 Open ▸ .
Figure 10.29 Vessel Type Distribution within Proposed Development Export Cable Corridor Area and Shipping and Navigation Study Area (28 Days Summer 2022 and Winter 2021)
Throughout the summer period, the most common vessel types in the Proposed Development export cable corridor shipping and navigation study area were fishing vessels (31%), tankers (22%), cargo vessels (16%), and recreational vessels (16%). Throughout the winter period, the most common vessel types were tankers (36%), cargo vessels (33%), and fishing vessels (20%).
Although cruise liners were recorded within the Proposed Development export cable corridor study area during the summer period, no commercial ferries were identified in the winter period, which aligns with feedback provided by Forth Ports during consultation (see 10 June 2020 entry in Table 4.1 Open ▸ ).
10.2.2.1 Tankers
The tracks of tankers recorded within the Proposed Development export cable corridor shipping and navigation study area throughout both survey periods are presented in Figure 10.30 Open ▸ .
Figure 10.30 Tanker Traffic within Proposed Development Export Cable Corridor Shipping and Navigation Study Area (28 Days Summer 2022 and Winter 2021)
Throughout the survey periods, an average of between six and seven tankers per day were recorded within the Proposed Development export cable corridor shipping and navigation study area. Regular tanker routeing included coastal transits out of the Firth of Forth.
Tanker subtypes recorded in the Proposed Development export cable corridor shipping and navigation study area included oil/chemical tankers (31%), LPG tankers (27%), and oil product tankers (22%).
10.2.2.2 Commercial Fishing Vessels
Vessel Traffic Data
The tracks of commercial fishing vessels recorded within the Proposed Development export cable corridor shipping and navigation study area throughout both survey periods, are presented in Figure 10.31 Open ▸ .
Figure 10.31 Commercial Fishing Vessel Traffic within Proposed Development Export Cable Corridor Shipping and Navigation Study Area (28 Days Summer 2022 and Winter 2021)
Throughout the survey periods an average of six commercial fishing vessels per day were recorded within the Proposed Development export cable corridor shipping and navigation study area. All the commercial fishing vessels were recorded via AIS with no recreational vessels recorded via radar. Although AIS is only mandatory for fishing vessels greater than 15 m LOA, 46% of the commercial fishing vessels recorded using AIS were under 15 m LOA.
Fishing gear type could not be identified for 52% of the commercial fishing vessels recorded. The most common fishing gear types recorded in the Proposed Development export cable corridor shipping and navigation study area during the survey periods were demersal trawlers (70%), twin trawlers (13%), and potters (11%).
The nationality of all commercial fishing vessels recorded was British.
Vessel Monitoring System Data
In addition to the vessel traffic survey data, VMS data recorded between July 2018 and June 2021 has also been analysed within the Proposed Development export cable corridor shipping and navigation study area. A density grid, using the VMS data during this period as input, is presented in Figure 10.32 Open ▸ .
Figure 10.32 VMS Fishing Density within Proposed Development Export Cable Corridor Shipping and Navigation Study Area (July 2018 – June 2021)
Similarly to the AIS data, the nearshore areas recorded the highest density of VMS fishing activity, with moderate density recorded on the eastern edge of the Proposed Development export cable corridor shipping and navigation study area.
Comparison with volume 2, chapter 12
The baseline established in volume 2, chapter 12 indicates that overall commercial fishing activity is most prominent in coastal areas, particularly in the approaches to the Firth of Forth, where the Proposed Development export cable corridor makes landfall. Activities around the Proposed Development export cable corridor are dominated by trawlers and the nationality of almost all fishing vessels observed was British.
This shows good agreement with the baseline established in this section, in terms of the fishing gear types and nationalities identified. In terms of the distribution of commercial fishing vessel activity, there is also reasonable agreement, with the majority of activity occurring in coastal areas rather than the portion of the Proposed Development export cable corridor further offshore.
10.2.2.3 Cargo Vessels
The tracks of cargo vessels recorded within the Proposed Development export cable corridor shipping and navigation study area throughout both survey periods are presented in Figure 10.33 Open ▸ .
Figure 10.33 Cargo Vessel Traffic within Proposed Development Export Cable Corridor Shipping and Navigation Study Area (28 Days Summer 2022 and Winter 2021)
Throughout the survey periods an average of five unique cargo vessels per day were recorded within the Proposed Development export cable corridor shipping and navigation study area. Regular cargo vessel routeing included coastal transits out of the Firth of Forth.
Cargo vessel subtypes recorded in the Proposed Development export cable corridor shipping and navigation study area included general cargo (64%) and container vessels (29%).
10.2.2.4 Recreational Vessels
Vessel Traffic Data
The tracks of recreational vessels recorded within the Proposed Development export cable corridor shipping and navigation study area throughout both survey periods are presented in Figure 10.34 Open ▸ .
Figure 10.34 Recreational Vessel Traffic within Proposed Development Export Cable Corridor Shipping and Navigation Study Area (28 Days Summer 2022 and Winter 2021)
An average of approximately four to five recreational vessels per day were recorded within the Proposed Development export cable corridor shipping and navigation study area during the summer survey period, with none recorded during the winter survey period. All recreational vessels were recorded via AIS, with no recreational craft recorded on radar.
RYA Coastal Atlas of Recreational Boating
Figure 10.16 Open ▸ presents a plot of the RYA Coastal Atlas heat map relative to the Proposed Development export cable corridor. Following this, Figure 10.17 Open ▸ presents a plot of features relevant to recreational boating.
The RYA Coastal Atlas shows good correlation with the AIS data, in that the majority of recreational activity is coastal.
10.2.2.5 Oil and Gas Vessels
The tracks of oil and gas vessels recorded within the Proposed Development export cable corridor shipping and navigation study area throughout both survey periods, are presented in Figure 10.35 Open ▸ .
Figure 10.35 Oil and Gas Vessel Traffic within Proposed Development Export Cable Corridor Shipping and Navigation Study Area (28 Days Summer 2022 and Winter 2021)
Throughout the survey periods, an average of approximately one oil and gas vessel per day passed within the Proposed Development export cable corridor shipping and navigation study area. The majority of these vessels were on passage north-south between Aberdeen and gas fields in the Southern North Sea.
10.2.2.6 Passenger Vessels
Vessel Traffic Data
Throughout the survey periods, an average of approximately one passenger vessel per day passed within the Proposed Development export cable corridor shipping and navigation study area during the summer survey period, with none recorded during the winter survey period. Following an assessment of Anatec’s in-house ShipRoutes database, it is concluded that this is a result of the COVID-19 pandemic which has had a substantial effect on shipping movements globally (see section 5.4.3).
Anatec ShipRoutes Database
ShipRoutes includes one notable route featuring passenger vessels that passes through the Proposed Development export cable corridor, on a similar course to the main tanker route shown in Figure 10.30 Open ▸ . This route crosses the North Sea between the Firth of Forth and Hamburg[7] and constitutes approximately 110 transits per year (one vessel every three to four days).
This correlates with feedback received from Forth Ports during consultation indicating that under normal circumstances, when the effects of the COVID-19 pandemic are not present, there are around 125 visits per year by cruise ships to the Forth. It should be noted that the Proposed Development export cable corridor only covers one approach to the Forth and cruise schedules and numbers are subject to fluctuation season on season.
10.2.3 Vessel Sizes
10.2.3.1 Vessel Length
A plot of all vessel tracks (excluding temporary traffic) recorded within the Proposed Development export cable corridor shipping and navigation study area throughout the survey periods, colour-coded by LOA, is presented in Figure 10.36 Open ▸ . Following this, the distribution of these LOA classes by survey period is presented in Figure 10.37 Open ▸ .
Figure 10.36 Vessel Traffic Movements within Proposed Development Export Cable Corridor Shipping and Navigation Study Area by Vessel LOA (28 Days Summer 2022 and Winter 2021)
Figure 10.37 Vessel LOA Distribution within Proposed Development Export Cable Corridor and Shipping and Navigation Study Area (28 Days Summer 2022 and Winter 2021)
Vessel LOA was available for approximately 89% of vessels recorded in the Proposed Development export cable corridor shipping and navigation study area throughout both survey periods and ranged from 5 m for a RNLI lifeboat to 330 m for two crude oil tankers.
Excluding the vessels for which an LOA was not available, the average LOA of all vessels within the Proposed Development export cable corridor shipping and navigation study area throughout the summer and winter survey periods was 69 m and 98 m, respectively.
10.2.3.2 Vessel Draught
A plot of all vessel tracks (excluding temporary traffic) recorded within Proposed Development export cable corridor shipping and navigation study area throughout the survey periods, colour-coded by draught, is presented in Figure 10.38 Open ▸ . Following this, the distribution of these draught classes by survey period is presented in Figure 10.39 Open ▸ .
Figure 10.38 Vessel Traffic Movements within Proposed Development Export Cable Corridor Shipping and Navigation Study Area by Vessel Draught (28 Days Summer 2022 and Winter 2021)
Figure 10.39 Vessel Draught Distribution within Berwick Bank Export Cable Corridor and Shipping and Navigation Study Area (28 Days Summer 2022 and Winter 2021)
Vessel draught was available for approximately 50% of vessels recorded in the Proposed Development export cable corridor shipping and navigation study area throughout both survey periods and ranged from 0.9 m for a fishing vessel to 20 m for a crude oil tanker.
Excluding the vessels for which a draught was not available, the average draught of all vessels within the Proposed Development export cable corridor shipping and navigation study area throughout the summer and winter survey periods was 4.6 m and 5.3 m respectively.
10.2.4 Anchoring Activity
The same criteria outlined in section 10.1.4 for identifying anchored vessels bas been applied to the vessel traffic data for the Proposed Development export cable corridor shipping and navigation study area.
After applying these criteria, no vessels were deemed to be at anchor within the Proposed Development export cable corridor shipping and navigation study area.
11 Base Case Vessel Routeing
11 Base Case Vessel Routeing
11.1 Definition of a Main Commercial Route
11.1 Definition of a Main Commercial Route
Main commercial routes have been identified using the principles set out in MGN 654 (MCA, 2021). Vessel traffic data are assessed and vessels transiting at similar headings and locations are identified as a main route. To help identify main routes, vessel traffic data can also be interrogated to show vessels (by name and/or operator) that frequently transit those routes. The route width is then calculated using the 90th percentile rule from the median line of the potential shipping route as shown in Figure 11.1 Open ▸ . Additionally, the outputs of consultation undertaken with local stakeholders assisted in the identification of the main commercial routes.
Figure 11.1 Illustration of Main Route Calculation (MCA, 2021)
11.2 Pre Wind Farm Main Commercial Routes
11.2 Pre Wind Farm Main Commercial Routes
A total of 15 main commercial routes were identified within the Proposed Development array area shipping and navigation study area from the vessel traffic survey data[8] and consultation. These main commercial routes and corresponding 90th percentiles within the Proposed Development array area shipping and navigation study area are shown relative to the Proposed Development array area in Figure 11.2 Open ▸ . Following this, a description of each route is provided in Table 11.1 Open ▸ , including the average number of vessels per day, start and end locations and main vessel types. It is noted that the start and end locations are based on the most common destinations transmitted via AIS by vessels on those routes.
To ensure all main commercial routes are captured, the long-term vessel traffic data has been used to validate the main commercial routes identified from the vessel traffic survey data, with consideration given to the change in vessel traffic movements due to the presence of Seagreen.
Figure 11.2 Main Commercial Routes and 90th Percentiles within Proposed Development Array Area Shipping and Navigation Study Area (Pre Wind Farm)
Table 11.1 Description of Main Commercial Routes
There is likely additional routeing in and out of the Firth of Forth which falls outside of the Proposed Development array area shipping and navigation study area. This includes tankers headed for Braefoot Bay which may be located further inshore, as noted by Forth Ports during consultation (see 12 June 2020 entry in Table 4.1 Open ▸ ) and passenger vessels (as noted in section 10.1.2.6). Given the distance from the Proposed Development array area, it is not anticipated that such routeing will be affected by the presence of the Proposed Development in isolation. However, such routeing is considered in the assessment of cumulative deviations where appropriate (see section 15.6.2).
12 Adverse Weather Vessel Traffic Movements
12 Adverse Weather Vessel Traffic Movements
Some vessels and vessel operators may operate alternative routes during periods of adverse weather. This section focuses on vessel movements in adverse weather. Consideration is given to the implications of the presence of, or activities associated with, the Proposed Development during adverse weather. For example, if a commercial vessel is unable to make passage, or a small craft is unable to access safe havens.
Adverse weather includes wind, wave and tidal conditions as well as reduced visibility due to fog. Adverse weather can hinder a vessel’s standard route, its speed of navigation and/or its ability to enter the destination port. Adverse weather routes are assessed to be significant course adjustments to mitigate vessel motion in adverse weather conditions. When transiting in adverse weather conditions, a vessel is likely to encounter various types of weather and tidal phenomena, which may lead to severe roll motions, potentially causing damage to cargo, equipment and/or discomfort and danger to persons on board. The sensitivity of a vessel to these phenomena will depend on the actual stability parameters, hull geometry, vessel type, vessel size and speed.
12.1 Identification of Periods with Adverse Weather
12.1 Identification of Periods with Adverse Weather
Historical weather information provided by the Met Office (Met Office, 2019) has been used to identify periods of adverse weather during 2019 (the year covered by the long-term vessel traffic data) when routes within or in proximity to the Proposed Development could be considered most likely to be altered or cancelled. The key weather events identified are detailed in Table 12.1 Open ▸ .
Table 12.1 Key Weather Events During 2019 Relevant to the Proposed Development (Met Office)
12.2 Commercial Routeing Changes
12.2 Commercial Routeing Changes
The long-term vessel traffic data has been used to identify potential commercial routeing activity related to adverse weather conditions within and in proximity to the Proposed Development, with the periods outlined in Table 12.1 Open ▸ studied most closely.
No substantial alternative routeing was observed. However, during consultation adverse weather routeing was raised by the MCA as a topic that requires attention (see 9 March 2021 entry in Table 4.1 Open ▸ ). This was reflected in feedback received during the second Hazard Workshop, including from Forth Ports indicating that the region is known to experience significant bad weather. The FMA highlighted the Marr Bank as a particular hazard of note for larger tankers navigating coastally in adverse weather (see 27 July 2022 entries in Table 4.1 Open ▸ ).
Given the coastal nature of vessel routeing in the region, it is highly likely that many vessels choose to navigate a course that minimises exposure to any adverse weather, whilst also accounting for other factors, such as journey time. Route 1 in Figure 11.2 Open ▸ is such an example of a route where the optimal passage for minimising journey time has been conceded in favour of a passage which keeps a closer distance to the UK east coast where there is greater shelter from adverse weather. This also aligns with feedback from Intrada Ship Management during consultation (see 15 December 2021 entry in Table 4.1 Open ▸ ).
Therefore, the potential for adverse weather hazards due to deviations of main commercial routes has been considered when determining deviations for both the Proposed Development in isolation (see section 15.5) and cumulative scenarios (see section 15.6).
In consultation feedback Intrada Ship Management noted that given their vessels carry deck cargoes they are particularly sensitive to rolling and pitching and will need adequate sea room in order to select headings that mitigate the risks associated with weather/tidal direction.
12.3 Small Craft Use of Safe Havens
12.3 Small Craft Use of Safe Havens
As indicated by the long-term vessel traffic data, RYA Coastal Atlas of Recreational Boating (RYA, 2019) and consultation feedback, recreational vessel activity predominantly occurs inshore of the Proposed Development array area (and the other offshore wind farm developments in the region) and therefore it is not anticipated that the presence of the Proposed Development array area or associated activities will have a substantial effect on the ability of small craft to access safe havens in adverse weather conditions.
For the less frequent cases of recreational vessels navigating further offshore, the Scottish Whitefish Producers Association indicated that the overall minimum spacing between structures proposed (1,000 m) may not be sufficient for safe navigation. However, this minimum spacing is greater than that present at most existing offshore wind farm developments in the UK, some of which have much greater volumes of small craft activity associated with them (e.g. Rampion Offshore Wind Farm in the English Channel). Figure 12.1 Open ▸ presents an indicative small craft of length 15 m navigating internally within an offshore wind farm array with 1,000 m spacing between structures.
Figure 12.1 Indicative Small Craft Navigating within Wind Farm Array
There is substantial sea room available for a small craft to navigate safely, including in the majority of adverse weather conditions. As per International Convention on the Safety of Life at Sea (SOLAS) Chapter V (IMO, 1974), all vessels at sea are required to passage plan and part of the passage planning process requires them to consider weather forecasts and subsequent conditions. It is anticipated that vessels would then take account of these forecasts prior to embarking on a passage through or offshore of the array.
Taking into account the need for consultation on the final array layout post consent and the requirements of SOLAS Chapter V, there are not considered to be any significant effect on access to safe havens due to the presence of the Proposed Development or associated activities.
13 Navigation, Communication and Position Fixing Equipment
13.1 Very High Frequency Communications (Including Digital Selective Calling)
In 2004, trials were undertaken at the North Hoyle Offshore Wind Farm, located off the coast of North Wales. As part of these trials, tests were undertaken to evaluate the operational use of typical small-vessel VHF transceivers (including Digital Selective Calling (DSC)) when operated close to wind turbines.
The wind turbines had no noticeable effect on voice communications within the array or ashore. It was noted that if small craft vessel to vessel and vessel to shore communications were not significantly affected by the presence of wind turbines, then it is reasonable to assume that larger vessels with higher powered, and more efficient, systems would also be unaffected.
During this trial, a number of telephone calls were made from ashore, within the array, and on its offshore side. No effects were recorded using any system provider (MCA and QinetiQ, 2004).
Furthermore, as part of SAR trials carried out at the North Hoyle Offshore Wind Farm in 2005, radio checks were undertaken between the Sea King helicopter, and both Holyhead and Liverpool coastguards. The aircraft was positioned to the offshore side of the array, and communications were reported as very clear with no apparent degradation of performance. Communications with the service vessel located within the array were also fully satisfactory throughout the trial (MCA, 2005).
In addition to the North Hoyle trials, a desk-based study was undertaken for the Horns Rev 3 Offshore Wind Farm in Denmark in 2014, and it was concluded that there were not expected to be any conflicts between point to point radio communications networks, and no interference upon VHF communications (Energinet, 2014).
Following consideration of these reports, and noting that since the trials above there have been no significant issues with regards to VHF observed or reported, the presence of the Proposed Development is anticipated to have no significant risk upon VHF communications.
13.2 Very High Frequency Direction Finding
13.2 Very High Frequency Direction Finding
During the North Hoyle Offshore Wind Farm trials in 2004, the VHF Direction Finding (DF) equipment carried in the trial boats did not function correctly when very close to wind turbines (within approximately 50 m). This is deemed to be a relatively small-scale risk due to the limited use of VHF DF equipment and will not impact operational or SAR activities (MCA and QinetiQ, 2004).
Throughout the 2005 SAR trials carried out at North Hoyle, the Sea King radio homer system was tested. The Sea King radio homer system utilises the lateral displacement of a vertical bar on an instrument to indicate the sense of a target relative to the aircraft heading. With the aircraft and the target vessel within the array at a range of approximately 1 nm, the homer system operated as expected with no apparent degradation.
Since the trials detailed above, no significant issues with regards to VHF DF have been observed or reported, and therefore the presence of the Proposed Development is anticipated to have no significant risk upon VHF DF equipment.
13.3 Automatic Identification System
13.3 Automatic Identification System
No significant issues with interference to AIS transmission from operational offshore wind farms have been observed or reported to date. Such interference was also absent in the trials carried out at the North Hoyle Offshore Wind Farm (MCA and QinetiQ, 2004).
In theory, there could be interference when there is a structure located between the transmitting and receiving antennas (i.e. blocking line of sight) of the AIS. However, given no issues have been reported to date at operational developments or during trials, no significant risk is anticipated due to the presence of the Proposed Development.
13.4 Navigational Telex System
13.5 Global Positioning System
Global Positioning System (GPS) is a satellite-based navigational system. GPS trials were also undertaken throughout the 2004 trials at North Hoyle Offshore Wind Farm, and it was stated that “no problems with basic GPS reception or positional accuracy were reported during the trials”.
The additional tests showed that “even with a very close proximity of a wind turbine to the GPS antenna, there were always enough satellites elsewhere in the sky to cover for any that might be shadowed by the wind turbine tower” (MCA and QinetiQ, 2004).
Therefore, there are not expected to be any significant risks associated with the use of GPS systems within or in proximity to the Proposed Development, noting that there have been no reported issues relating to GPS within or in proximity to any operational offshore wind farms to date.
13.6 Electromagnetic Interference
13.6 Electromagnetic Interference
A compass, magnetic compass, or mariner's compass is a navigational instrument for determining direction relative to the earth's magnetic poles. It consists of a magnetised pointer (usually marked on the north end) free to align itself with the earth's magnetic field. A compass can be used to calculate heading, used with a sextant to calculate latitude, and with a marine chronometer to calculate longitude.
Like any magnetic device, compasses are affected by nearby ferrous materials as well as by local electromagnetic forces, such as magnetic fields emitted from power cables. As the compass still serves as an essential means of navigation in the event of power loss or as a secondary source, it is important that potential impacts from Electromagnetic Field (EMF) should be minimised to ensure continued safe navigation. The vast majority of commercial traffic uses non-magnetic gyrocompasses as the primary means of navigation, which are unaffected by EMF. Therefore, it is considered highly unlikely that any interference from EMF as a result of the presence of cables associated with the Proposed Development will have a significant impact on vessel navigation. However some smaller craft (fishing or leisure) may rely on them as their sole means of navigation
The export and inter-array cables for the Proposed Development could be Alternating Current (AC), Direct Current (DC) or a combination of both. Studies indicate that AC does not emit an EMF significant enough to impact marine magnetic compasses (Convention for the Protection of the Marine Environment of the North-East Atlantic (OSPAR), 2008).
The Moray Offshore Renewables Environmental Statement (Moray Offshore Renewables, 2012) notes that for both buried and protected DC cables the magnetic field will decrease exponentially with vertical distance from the seabed and with horizontal distance from the cables (within a few metres), irrespective of whether cables are buried or protected. It states that “in all cases, where cables are buried to 1 m depth, the predicted magnetic field is expected to be below the earth’s magnetic field (assumed to be 50 microtesla (µT)). Where DC cables cannot be buried and are instead protected, the magnetic field is expected to be below the earth’s magnetic field within 5 m from the seabed”.
The following are therefore considered to be important factors affecting the likelihood of EMF to affect compass deviation as a result of the presence of cables:
- water depth;
- burial depth (or protection);
- type of current (alternating or direct) running through the cables; and/or
- spacing or separation of the cables.
13.7 EMF from Cables Associated with the Proposed Development
13.7 EMF from Cables Associated with the Proposed Development
Within their response (16 November 2021) to the Berwick Bank Wind Farm Scoping Report the MCA stated that a compass deviation of three degrees will be accepted for 95% of the cable route and a five degree deviation accepted for the remaining 5% (see 16 November 2021 entry in Table 4.1 Open ▸ ). Table 13.1 Open ▸ details assumed EMF mitigation for the Proposed Development.
Given that 95% of the offshore export cables will be buried and 99.1% (approximately) of it in water depths greater than 10 m there are not anticipated to be any effects on compass deviation for the majority of the Proposed Development export cable corridor. Within shallow waters effects of EMF will be mitigated by the offshore export cables being either Horizontally Direction Drilled (HDD) or direct piped (within up to 1,500 m of the LAT mark and also out to a minimum of -5 m LAT) and also buried or protected as required beyond the point of emergence. As noted in Moray Offshore Renewables Environmental Statement (Moray Offshore Renewables, 2012) “where DC cables cannot be buried and are instead protected, the magnetic field is expected to be below the earth’s magnetic field within 5 m from the seabed” and there are negligible effects on magnetic compasses. Therefore, in summary based on mitigations of water depth, burial and use of HDD/direct pipes within shallow water the Proposed Development is anticipated to be within the requirements defined by the MCA.
Inter-array cables have not been considered within this section but are considered within acceptable limits given water depths within the Proposed Development array area (33 to 69 m Chart Datum) and use of burial/protection methods as required.
13.7.1 Electromagnetic Fields and Structures
MGN 654 (MCA, 2021) notes that small vessels with simple magnetic steering and hand bearing compasses should be wary of using these close to wind turbines as with any structure in which there is a large amount of ferrous material (MCA and QinetiQ, 2004). Potential effects are therefore deemed to be within acceptable levels when considered alongside other mitigation such as the mariner being able to make visual observations (not wholly reliant on the magnetic compass), lighting, sound signals and identification marking in line with MGN 654 (MCA, 2021).
13.7.2 Electromagnetic Fields to Date within Operational Offshore Wind Farms
No issues with respect to magnetic compasses have been reported to date in any of the trials (MCA and QinetiQ, 2004) carried out (inclusive of SAR helicopters) nor in any published reports from other operational offshore wind farms.
13.8 Marine Radar
13.8 Marine Radar
This section summarises trials and studies undertaken in relation to radar effects from offshore wind farms in the UK. It is important to note that since the time of the trials and studies discussed, wind turbine technology has advanced significantly, most notably in terms of the size of wind turbines available to be installed and utilised. The use of these larger wind turbines allows for a greater spacing between wind turbines than was achievable at the time of the studies being undertaken, which is beneficial in terms of radar interference effects (and surface navigation in general) as detailed in sections 15.7.1 to 15.7.5.
13.8.1 Trials
During the early years of offshore renewables within the UK, maritime regulators undertook a number of trials (both shore-based and vessel-based) into the effects of wind turbines on the use and effectiveness of marine radar.
In 2004, trials undertaken at the North Hoyle Offshore Wind Farm (MCA, 2004) identified areas of concern regarding the potential risks to marine- and shore-based radar systems due to the large vertical extents of the wind turbines (based on the technology at that time). This resulted in radar responses strong enough to produce interfering side lobes and reflected echoes (often referred to as false targets or ghosts).
Side lobe patterns are produced by small amounts of energy from the transmitted pulses that are radiated outside of the narrow main beam. The effects of side lobes are most noticeable within targets at short range (below 1.5 nm) and with large objects. Side lobe echoes form either an arc on the radar screen similar to range rings, or a series of echoes forming a broken arc, as illustrated in Figure 13.1 Open ▸ .
Figure 13.1 Illustration of Side Lobes on Radar Screen
Multiple reflected echoes are returned from a real target by reflection from some object in the radar beam. Indirect echoes or ‘ghost’ images have the appearance of true echoes but are usually intermittent or poorly defined; such echoes appear at a false bearing and false range, as illustrated in Figure 13.2 Open ▸ .
Figure 13.2 Illustration of Multiple Reflected Echoes on Radar Screen
Based on the results of the North Hoyle trials, the MCA produced a Shipping Route Template designed to give guidance to mariners on the distances which should be established between shipping routes and offshore wind farms. The latest version of the Shipping Route Template is included in MGN 654 (MCA, 2021).
A second set of trials conducted at Kentish Flats Offshore Wind Farm in 2006 on behalf of the British Wind Energy Association (BWEA) – now called RenewableUK (BWEA, 2007) – also found that radar antennas which are sited unfavourably with respect to components of the vessel’s structure can exacerbate effects such as side lobes and reflected echoes. Careful adjustment of radar controls suppressed these spurious radar returns, but mariners were warned that there is a consequent risk of losing targets with a small radar cross section, which may include buoys or small craft, particularly yachts or Glass Reinforced Plastic (GRP) constructed craft; therefore, due care should be taken in making such adjustments.
Theoretical modelling of the effects of the development of the proposed Atlantic Array Offshore Wind Farm, which was to be located off the south coast of Wales, on marine radar systems was undertaken by the Atlantic Array project (Atlantic Array, 2012) and considered a wider spacing of wind turbines than were considered within the early trials. The main outcomes of the modelling were the following:
- Multiple and indirect echoes were detected under all modelled parameters.
- The main effects noticed were stretching of targets in azimuth (horizontal) and appearance of ghost targets.
- There was a significant amount of clear space amongst the returns to ensure recognition of vessels moving amongst the wind turbines and safe navigation.
- Even in the worst case with radar operator settings artificially set to be poor, there is significant clear space around each wind turbine that does not contain any multipath or side lobe ambiguities to ensure safe navigation and allow differentiation between false and real (both static and moving) targets.
- Overall, it was concluded that the amount of shadowing observed was very little (noting that the model considered lattice-type foundations which are sufficiently sparse to allow radar energy to pass through).
- The lower the density of wind turbines the easier it is to interpret the radar returns and fewer multipath ambiguities are present.
- In dense, target rich environments, S-Band radar scanners suffer more severely from multipath effects in comparison to X-Band radar scanners.
- It is important for passing vessels to keep a reasonable separation distance between the wind turbines in order to minimise the effect of multipath and other ambiguities.
- The Atlantic Array study undertaken in 2012 noted that the potential for radar interference was mainly a problem during periods of reduced visibility when mariners may not be able to visually confirm the presence of other vessels in proximity (those without AIS installed which are usually fishing and recreational craft). It is noted that this situation would arise with or without wind turbines in place.
- There is potential for the performance of a vessel’s Automatic Radar Plotting Aid (ARPA) to be affected when tracking targets in or near the array. Although greater vigilance is required, during the Kentish Flats trials it was shown that false targets were quickly identified as such by the mariners and then by the equipment itself.
In summary, experience in UK waters has shown that mariners have become increasingly aware of any radar effects as more offshore wind farms become operational. Based on this experience, the mariner can interpret the effects correctly, noting that effects are the same as those experienced by mariners in other environments such as in close proximity to other vessels or structures. Effects can be effectively mitigated by “careful adjustment of radar controls”.
The MCA has also produced guidance to mariners operating in proximity to OREIs in the UK which highlights radar issues amongst others to be taken into account when planning and undertaking voyages in proximity to OREIs (MCA, 2008). The interference buffers presented in Table 13.2 Open ▸ are primarily based on MGN 654 (MCA, 2021) but also consider the content of MGN 371 (MCA, 2008), MGN 543 (MCA, 2016) and MGN 372 (MCA, 2008).
Table 13.2 Distances at which Risks for Marine Radar Occur
As noted in Table 13.2 Open ▸ , the onset range from the wind turbines of false returns is approximately 1.5 nm, with progressive deterioration in the radar display as the range closes. If interfering echoes develop, the requirements of the Convention on International Regulations for Preventing Collisions at Sea (COLREGs) Rule 6 Safe Speed are particularly applicable and must be observed with due regard to the prevailing circumstances (IMO, 1972/77). In restricted visibility, Rule 19 Conduct of Vessels in Restricted Visibility applies and compliance with Rule 6 becomes especially relevant. In such conditions mariners are required, under Rule 5 Look-out to take into account information from other sources which may include sound signals and VHF information, for example from a VTS or AIS (MCA, 2016).
13.8.2 Experience from Operational Developments
The evidence from mariners operating in proximity to existing offshore wind farms is that they quickly learn to adapt to any effects. The example of the Galloper and Greater Gabbard Offshore Wind Farms, which are located in proximity to IMO routeing measures is presented in Figure 13.3 Open ▸ . Despite this proximity to heavily trafficked Traffic Separation Scheme lanes, there have been no reported incidents or issues raised by mariners who operate within the vicinity. The interference buffers presented in Figure 13.3 Open ▸ are as per Table 13.2 Open ▸ .
Figure 13.3 Illustration of Potential Radar Interference at Greater Gabbard and Galloper Offshore Wind Farms
As indicated by Figure 13.3 Open ▸ , vessels utilising these Traffic Separation Scheme lanes experience some radar interference based on the available guidance. Both developments are operational, and each of the lanes is used by a minimum of five vessels per day on average. However, to date, there have been no incidents recorded (including any related to radar use), or concerns raised by the users.
AIS information can also be used to verify the targets of larger vessels (generally vessels over 15 m LOA – the minimum threshold for fishing vessel AIS carriage requirements). Approximately 15% of the vessel traffic recorded within the Proposed Development array area study area was under 15 m LOA, although throughout the vessel traffic surveys over 99% of vessels were recorded via AIS, indicating a high level of AIS take-up among vessels for which AIS carriage is not mandatory.
For any smaller vessels, particularly fishing vessels and recreational vessels, AIS Class B devices are becoming increasingly popular and allow the position of these small craft to be verified when in proximity to an offshore wind farm.
13.8.3 Increased Radar Returns
Beam width is the angular width, horizontal or vertical, of the path taken by the radar pulse. Horizontal beam width ranges from 0.75° to 5°, and vertical beam width ranges from 20° to 25°. How well an object reflects energy back towards the radar depends upon its size, shape, and aspect angle.
Larger wind turbines (either in height or width) will return greater target sizes and/or stronger false targets. However, there is a limit to which the vertical beam width would be affected (20° to 25°) dependent upon the distance from the target. Therefore, increased wind turbine height in the array will not create any effects in addition to those already identified from existing operational wind farms (interfering side lobes, multiple and reflected echoes).
Again, when taking into consideration the potential options available to marine users (such as reducing gain to remove false returns) and feedback from operational experience, this shows that the effects of increased returns can be managed effectively.
13.8.4 Fixed Radar Antenna Use in Proximity to an Operational Wind Farm
It is noted that there are multiple operational wind farms including Galloper that successfully operate fixed radar antenna from locations on the periphery of the array. These antennas are able to provide accurate and useful information to onshore coordination centres.
13.8.5 Application to the Proposed Development
Upon commissioning of the Proposed Development, some commercial vessels may pass within 1.5 nm of the wind farm structures and therefore may be subject to a minor level of radar interference. Trials, modelling, and experience from existing developments note that any risk can be mitigated by adjustment of radar controls.
An illustration of potential radar interference due to the Proposed Development and cumulative offshore wind farm developments is presented in Figure 13.4 Open ▸ . NnG is represented by the final array layout plotted on Admiralty Charts and Seagreen is represented by the final array layout published in the Safety Zone application (Seagreen Wind Energy Ltd, 2021), whereas Inch Cape is represented by the array area boundary published by Crown Estate Scotland, noting that a final array layout has not been published at the time of writing.
Figure 13.4 Illustration of Potential Radar Interference at the Proposed Development and Cumulative Offshore Wind Farm Developments
Vessels navigating internally within the Proposed Development array area will be subject to a greater level of radar interference, with risks becoming more substantial in close proximity to the wind turbines. This will require additional mitigation by vessels, including consideration of the navigational conditions (visibility) when passage planning and compliance with the COLREGs (IMO, 1972/77) will be essential.
For vessels transiting through the navigational corridor between the Proposed Development array area and Inch Cape, there may be a potential for increased exposure to radar interference depending upon the nature of the passage through the corridor. However, the distance and duration of the transit for which the distance from wind turbines will be less than 1.5 nm will be low and it is very unlikely that vessels will navigate within 0.5 nm of a wind turbine. Mitigations are available to vessels as listed throughout this section (e.g. adjustment of radar controls) and the risk is within parameters already safely managed at existing offshore wind farm developments.
Overall, the risk of marine radar interference is expected to be low and no further risk to navigational safety is anticipated outside the parameters which can be mitigated by operational controls. From existing experience within UK offshore wind farms, vessels do navigate safely internally within arrays including with spacing significantly less than at the Proposed Development array area.
13.9 Sound Navigation Ranging Systems
13.10 Noise
No evidence has been found to date with regard to existing offshore wind farms to suggest that prescribed sound signals are in any way impacted by acoustic noise produced by the wind farm.
13.11 Summary of Risk
13.11 Summary of Risk
Based on the detailed technical assessment of the effects due to the presence of the Proposed Development on navigation, communication, and position fixing equipment in the previous subsections, the assessment of frequency and consequence and the resulting significance of risk for each topic is summarised in Table 13.3 Open ▸ .
Table 13.3 Summary of Risk on Navigation, Communication, and Position-fixing Equipment
On the basis of the NRA findings, associated risks are screened out of volume 2, chapter 13.
14 Cumulative and Transboundary Overview
14 Cumulative and Transboundary Overview
Cumulative risks have been considered for activities in combination and cumulatively with the Proposed Development. This section provides an overview of the baseline used to inform the cumulative risk assessment, including the developments and projects screened into the cumulative risk assessment based on the criteria outlined in section 3.3.
The outputs of the cumulative risk assessment are then provided in section 19.2.
14.1 Screened In Developments
14.1 Screened In Developments
14.1.1 Other Offshore Wind Farms
In addition to the Proposed Development, there are a number of other offshore wind farm developments in the outer Firth of Forth and Firth of Tay region and the UK east coast as a whole. Table 14.1 Open ▸ includes details of these offshore wind farm developments and includes the cumulative risk assessment scenario applied as well as whether each development is screened in or out of the cumulative risk assessment based on the methodology outlined in section 3.3. The project statuses are as of August 2022 when the most up-to-date vessel traffic data used to inform the baseline was collected. Additionally, although Forthwind was consented in 2016, an EIA Report for a new project design was submitted in May 2022 (Marine Scotland, 2022) following a scoping report in August 2021 and so this development is defined as scoped.
As per the methodology, any development greater than 50 nm from the Proposed Development array area is not considered.
Figure 14.1 Open ▸ presents the locations of the offshore wind farm developments screened into the cumulative risk assessment.
Figure 14.1 Offshore Wind Farms Developments Screened into Cumulative Risk Assessment
14.1.2 Oil and Gas Infrastructure
The only oil and gas infrastructure within 50 nm of the array site are seven wellheads, all of which are decommissioned, and therefore have no future influence of vessel movements. The closest surface oil and gas infrastructure is the BW Catcher FPSO at the Catcher Area Development, located approximately 73 nm to the east.
Therefore, no oil and gas infrastructure has been screened into the cumulative risk assessment.
14.1.3 Other Developments and Infrastructure
The Cambois connection is a potential secondary offshore export cable option for the Proposed Development which will connect at the southern extent of the Proposed Development array area and make landfall at Blyth on the UK east coast[9]. Given that this development will not include any surface infrastructure there is a limited pathway through which a hazard can be transmitted between the development and shipping and navigation users. Therefore, the Cambois connection is screened out of the cumulative risk assessment.
Other developments within 50 nm of the Proposed Development array area include the Inch Cape Met Mast (located approximately 8.3 nm to the west) and Energy Park Fife (located within the Firth of Forth). Both are existing developments and are therefore considered as part of the baseline.
There are no other known future developments (other than offshore wind farm developments) within 50 nm of the Proposed Development array area.
Therefore, no other developments or infrastructure has been screened into the cumulative risk assessment.
Table 14.1 Cumulative Screening
14.2 Cumulative Pre-Wind Farm Routeing
14.2 Cumulative Pre-Wind Farm Routeing
Figure 14.2 Open ▸ presents a plot of the main commercial routes within the Proposed Development array area shipping and navigation study area (full extent) alongside the screened in cumulative developments. Descriptions of the vessel traffic on each of the main commercial routes are provided in Table 11.1 Open ▸ .
Figure 14.2 Offshore Wind Farms Developments Screened into Cumulative Risk Assessment with Main Commercial Routes (Pre Wind Farm)
Table 14.2 Open ▸ summarises which main commercial routes interact with which cumulative developments (i.e. are defined as requiring a deviation due to the future presence of a cumulative development). As per the methodology for re-routeing due to the Proposed Development in isolation (see section 15.5.1), it has been assumed that any main commercial route within 1 nm of an offshore installation will require a deviation.
Table 14.2 Anticipated Cumulative Routeing Interaction with Cumulative Developments
In summary, three routes are anticipated to require a deviation due to the additional presence of Inch Cape (Scenario 1). There are no Scenario 2 developments and therefore no further deviations are considered noting that, as per the cumulative risk assessment methodology, Scenario 3 developments are considered only qualitatively and at a high level due to the limited information available.
15 Future Case Vessel Traffic
15 Future Case Vessel Traffic
This section presents the future case level of activity within and in proximity to the Proposed Development and the anticipated shift in the mean positions of the main commercial routes post wind farm.
The future case activity and routeing has been fed into the collision and allision risk modelling. The future case is considered throughout the risk assessment undertaken in volume 12, chapter 13 where future case refers to the assessment of risk based upon the predicted growth in future shipping densities and traffic types. The future case also refers to foreseeable changes in the marine environment, as discussed in the following subsections.
15.1 Increases in Commercial Vessel Activity
15.1 Increases in Commercial Vessel Activity
Forth Ports are the port operator for the major ports within the Forth including Grangemouth, Dundee, Leith and Rosyth. Given the influence of ports within the Firth of Forth and Firth of Tay in relation to vessel traffic movements within and in proximity to the Proposed Development, Forth Ports were consulted regarding future case traffic levels.
Forth Ports indicated that no terminal or berth changes are planned that may affect vessel traffic in the future with vessel numbers expected to remain reasonably consistent. Additionally, there are no commercial ferry routes planned. If anything, over the next five years any volume changes out of the Firth of Forth are likely to be decreases and beyond five years is difficult to forecast. At the Port of Dundee there is a lease for development relating to an offshore wind base.
The Scottish Whitefish Producers Association indicated that once Aberdeen South Harbour is operational there could be an increase in cruise traffic through the region.
In the longer-term, there may be increases in wind farm related traffic associated with the ScotWind developments north and east of the Proposed Development. This was raised during consultation, with the potential for terminals within the Forth to be used. However, given the low data confidence associated with these developments it is not possible to make any quantitative assumptions.
Given the uncertainty associated with long-term predictions of vessel traffic growth, as indicated by Forth Ports, two conservative and independent scenarios of potential growth in commercial vessel movements of 10% and 20% have been estimated throughout the lifetime of the Proposed Development. In reality, future case traffic growth is likely to fluctuate depending on seasonality and cargo and industry trends.
15.2 Increases in Commercial Fishing Vessel Activity
15.2 Increases in Commercial Fishing Vessel Activity
There is similar uncertainty associated with long-term predictions for commercial fishing vessel transits given the limited reliable information on future trends upon which any firm assumption can be made. Therefore, again to ensure a conservative approach, 10% and 20% growths in commercial fishing vessel movements have been estimated throughout the lifetime of the Proposed Development. Changes in commercial fishing activity are considered further in volume 2, chapter 12.
15.3 Increases in Recreational Vessel Activity
15.3 Increases in Recreational Vessel Activity
There are no known major developments which will increase the activity of recreational vessels in the region. As with commercial fishing vessels, given the limited reliable information on future trends, conservative 10% and 20% growths in recreational vessel movements have been estimated throughout the lifetime of the Proposed Development.
15.4 Increases in Traffic Associated with Project Operations
15.4 Increases in Traffic Associated with Project Operations
The anticipated number of vessels associated with the Proposed Development during the construction and operation and maintenance phases are presented in section 6.5.
15.5 Commercial Traffic Routeing (Project in Isolation)
15.5 Commercial Traffic Routeing (Project in Isolation)
15.5.1 Methodology
It is not possible to consider all potential alternative routeing options for commercial traffic and therefore alternatives have been considered where possible in consultation with operators. Assumptions for re-routeing include:
- All alternative routes maintain a minimum mean distance of 1 nm from offshore installations and existing offshore wind farm boundaries in line with industry experience. This distance is considered for shipping and navigation from a safety perspective as explained below; and
- All mean routes take into count sandbanks, aids to navigation and known routeing preferences.
Additionally, some routes which pass at a mean distance greater than 1 nm are sufficiently wide that there may be some interaction with the offshore wind farm boundaries (within the 90th percentile range). In such instances the width of the route has been reduced within reason and if required the mean position of the route has been shifted to a distance further from the offshore wind farm boundary to ensure there is no direct interaction.
Annex 1 of MGN 654 defines as methodology for assessing passing distance from offshore wind farm boundaries but states that it is “not a prescriptive tool but needs intelligent application”.
To date, internal and external studies undertaken by Anatec on behalf of the UK Government and individual clients show that vessels do pass consistently and safely within 1 nm of established offshore wind farms (including between distinct developments) and these distances vary depending upon the sea room available as well as the prevailing conditions. This evidence also demonstrates that the Mariner defines their own safe passing distance based upon the conditions and nature of the traffic at the time, but they are shown to frequently pass 1 nm off established developments.
Evidence also demonstrates that commercial vessels do not transit through arrays and this has been supported by feedback from Regular Operators during consultation (see 24 September 2021, 27 September 2021 and 1 October 2021 entries in Table 4.1 Open ▸ ).
The NRA also aims to establish the maximum design scenario based on navigational safety parameters, and when considering this the most conservative realistic scenario for vessel routeing is considered to be when main commercial routes pass 1 nm off developments. Evidence collected during numerous assessments at an industry level confirms that it is a safe and reasonable distance for vessels to pass; however, it is likely that a large number of vessels would instead choose to pass at a greater distance depending upon their own passage plan and the current conditions. One such example is Evergas, who have indicated during consultation (via charted passage plans) that they will pass further than 1 nm off the Proposed Development Array Area. This has been accounted for when establishing the main commercial route deviations (specifically for Route 14).
15.5.2 Main Commercial Route Deviations
An illustration of the anticipated worst case shift in the mean positions of the main commercial routes within the Proposed Development array area study area following the development of the Project is presented in Figure 15.1 Open ▸ . These deviations are based on Anatec’s assessment of the maximum design scenario including the outputs of consultation.
Figure 15.1 Anticipated Main Commercial Routes within Proposed Development Array Area Study Area (Post Wind Farm)
Deviations from the pre wind farm scenario would be required for seven out of the 14 main commercial routes identified, with the level of deviation varying between a 0.1 nm decrease for Route 4 and a 26.0 nm increase for Route 14. For the displaced routes, the increase in distance from the pre wind farm scenario is presented in Table 15.1 Open ▸ .
Table 15.1 Summary of Post Wind Farm Main Commercial Route Deviations within Study Area
In the case of Route 14, although the increase in route length is very high, since this is a transatlantic route the percentage change in the total route length is relatively low. Moreover, there will be large periods where vessels on this route are in open seas and should be able to make up any time losses incurred due to the deviations.
In the case of Route 11, although the deviation is negligible, the route does pass through the gap between the Proposed Development array area and Seagreen. This gap has variable width; at the western extent the minimum width is approximately 6.0 nm and at the eastern extent is approximately 2.8 nm. Usage of Route 11 is very low (an average of less than one vessel per day) and so the likelihood of an encounter between vessels is very low. Additionally, given the width of the gap there is sufficient sea room to allow a vessel navigating within to maintain a minimum distance of 1 nm from wind farm structures, minimising allision risk. Additionally, with the additional presence of Inch Cape immediately west of the gap, mariners are expected to choose a routeing option passing north of Inch Cape and Seagreen rather than utilise the gap (see section 15.6.6).
15.6 Commercial Traffic Routeing (Cumulative)
15.6 Commercial Traffic Routeing (Cumulative)
15.6.1 Methodology
Given the complex nature of the cumulative scenario (in terms of the influence of cumulative developments and number of affected main commercial routes), each of the leading routeing options is considered individually on a cumulative level. This allows full consideration of the various options available.
Consultation feedback with regards to likely vessel behaviour (see section 4.2) has been incorporated where appropriate including specific behaviour by vessel type and size.
This approach has been applied to the relevant cumulative risk assessment scenarios where a quantitative approach is required, i.e., Scenario 1 and Scenario 2 developments (see section 3.3), noting that no developments were screened into Scenario 2.
15.6.2 Main Commercial Routeing Between Forth Ports and Northern Ports
This subsection considers main commercial routeing between ports located within the Firth of Forth and UK ports located north of the Firth of Forth and Firth of Tay, such as Aberdeen and Invergordon. Figure 15.2 Open ▸ presents two example routes for the pre wind farm scenario together with the baseline, Scenario 1 and Scenario 2 developments.
The route passing south of NnG is Route 14 from section 11.2. The route passing north of NnG is not represented in the analysis of pre wind farm routeing for the Proposed Development in isolation since it is located outside the Proposed Development array area study area and is therefore not characterised by the vessel traffic survey data nor affected by the presence of the Proposed Development in isolation. However, from Anatec’s ShipRoutes database it is known that this coastal route, transited by an average of one vessel per day, exists and as discussed below vessels on this route are considered potential users of the navigation corridor between the Proposed Development array area and Inch Cape.
Figure 15.2 Examples of Pre Wind Farm Main Commercial Routes Between Forth Ports and Northern Ports
Based on Anatec’s ShipRoutes database, the majority of commercial vessels associated with the example routeing passing north of NnG are commercial vessels less than 150 m in length. Based on a review of the vessel traffic data, the vessels passing south on the associated routeing largely comprise tankers in the 100 to 200 m range.
With the presence of Scenario 1 developments (Inch Cape) in addition to baseline developments and the Proposed Development, a deviation will be required for north-south routeing out of the Firth of Forth which passes north of NnG. There are three clear options as illustrated in Figure 15.3 Open ▸ and detailed in the text that follows.
Figure 15.3 Cumulative Options for Main Commercial Routes Between Forth Ports and Northern Ports Passing North of NnG
- Pass inshore of Inch Cape (option A) – this option would involve vessels making a change in course to pass between Bell Rock and Inch Cape, resulting in a small deviation.
- Vessels in transit on the relevant routes include commercial vessels; however charted water depths (30 to 40 m contours) could be considered suitable for such a deviation, noting the following factors that would make such navigation unsuitable for vessels carrying hazardous cargoes:
- Proximity to shore and shallows;
- Potential for failures; and
- The approaches to the Firth of Tay and subsequent interaction with other vessel traffic.
- The need for additional course adjustments and proximity to surface piercing features to both port and starboard result in this option increasing collision and allision risk for passing vessels.
- This option would not be suitable for vessels that are not already passing Bell Rock at this proximity.
- Forth Ports noted that they may also have to contact vessels asking for intentions if vessels shifted to this option (see section 4).
- This option may increase encounters with recreational vessels, noting that it was raised during consultation (see section 4) that the presence of coastal fishing pots may displace recreational vessels into deviated commercial vessels.
- Vessels in transit on the relevant routes include commercial vessels; however charted water depths (30 to 40 m contours) could be considered suitable for such a deviation, noting the following factors that would make such navigation unsuitable for vessels carrying hazardous cargoes:
- Utilise the navigation corridor between the Proposed Development array area and Inch Cape (option B) – this option would involve vessels passing closer to the northern boundary of NnG and then steering a course through the navigation corridor, resulting in a moderate deviation.
- The proximity to surface piercing features to both port and starboard result in this option introducing increased collision and allision risk for passing vessels. However, the width and shape of the navigation corridor results in the number of additional course adjustments required being similar to the other options and the navigation corridor is MGN 654 compliant.
- The presence of small craft operating within or in proximity to the navigation corridor may increase potential collision risk with commercial vessels (noting the associated routeing included large commercial vessels), noting this may discourage small craft from operating in proximity to the navigation corridor.
- Pass offshore of the Proposed Development array area (option C) – this option would involve vessels passing around the south and east of the Proposed Development array area, resulting in a very large deviation.
- Vessels using this option would be more exposed to adverse weather given the greater distance from the UK east coast. However, there is sufficient available sea room to the south and east of the Proposed Development array area and Seagreen to ensure that a safe distance can be maintained from wind farm structures, and so collision and allision risk is considered to be low.
For north-south routeing out of the Firth of Forth which passes south of NnG, the available options are considered equivalent to those outlined above for north-south routeing out of the Firth of Forth which passes north of NnG, as illustrated in Figure 15.4 Open ▸ and detailed in the text that follows.
Figure 15.4 Cumulative Options for Main Commercial Routes Between Forth Ports and Northern Ports Passing South of NnG
- Pass inshore of Inch Cape (option A) – this option would involve vessels passing north of the Isle of May and inshore of Inch Cape, resulting in a large deviation.
- This option is considered less feasible in this instance since passing north of the Isle of May requires navigating in shallower water where fishing pots are known to be present or making a sharp turn once beyond the two special marks located east of the Isle of May.
- Vessels on this route include gas carriers with flammable cargoes that may not wish to use this route due to the potential for machinery failure closer to shore. Their own risk assessments (standing orders) may also prevent them passing closer to the shore.
- From consultation with the RNLI, the increase in commercial vessel movements inshore of Inch Cape could increase the occurrence of incidents between Arbroath and Anstruther, especially in relation to leisure craft.
- Utilise the navigation corridor between the Proposed Development array area and Inch Cape (option B) – this option would involve vessels steering a course through the navigation corridor, resulting in a small deviation.
- This option is considered more feasible in this instance since vessels will have better alignment with the navigation corridor after making a turn to port around NnG, with limited further course adjustments required.
- The proximity to surface piercing features to both port and starboard result in this option introducing increased collision and allision risk for passing vessels. However, this may be mitigated by the navigation corridor being MGN 654 compliant.
- The note on gas carriers for option A is again relevant here.
- Pass offshore of the Proposed Development array area (option C) – this option would involve vessels passing around the south and east of the Proposed Development array area resulting in a large deviation.
- As per the equivalent option for north-south routeing out of the Firth of Forth, noting that a Regular Operator on this route indicated during consultation that their vessels would opt for this option given the navigational safety risks associated with the other options.
In summary, a safe deviation is available for vessels routeing between the Firth of Forth and northern ports. This can be achieved either by passing offshore of the Proposed Development array area or utilising the MGN 654 compliant navigation corridor. Although use of the navigation corridor will result in some increases in collision and allision risk, the size of the deviation associated with this routeing option is small compared with the very large deviation associated with passing offshore of the Proposed Development array area.
15.6.3 Main Commercial Routeing Between Forth Ports and Eastern Ports
This subsection considers main commercial routeing between ports located in the Firth of Forth and mainland European ports located in Norway and the Baltic region. Figure 15.5 Open ▸ presents two example routes for the pre wind farm scenario together with the baseline, Scenario 1 and Scenario 2 developments. These are based on Routes 5 and 10 from section 11.2.
Figure 15.5 Examples of Pre Wind Farm Main Commercial Routes Between Forth Ports and Eastern Ports
Based on a review of the vessel traffic data, the majority of commercial vessels associated with the example routeing are commercial vessels in the 100 to 200 m range. However, larger vessels are present including passenger vessels and tankers in excess of 200 m.
With the presence of Scenario 1 developments (Inch Cape) in addition to baseline developments and the Proposed Development, a deviation would be required for east-west routeing out of the Firth of Forth. There are three clear options as illustrated in Figure 15.6 Open ▸ and detailed in the text that follows. This figure also shows the worst case pre wind farm route.
Figure 15.6 Cumulative Options for Main Commercial Routes Between Forth Ports and Eastern Ports
- Pass inshore of Inch Cape (option A) – this option would involve vessels passing between Bell Rock and Inch Cape, resulting in a large deviation.
- Water depths are suitable for such a deviation including for the large commercial vessels present.
- Since these vessels do not currently pass in proximity to Bell Rock it is unlikely to be favoured by mariners.
- Since this option passes in proximity to both Inch Cape and Seagreen there is also an increased collision and allision risk, which could increase due to the presence of coastal cruising routes for small craft.
- Utilise the navigation corridor between the Proposed Development array area and Inch Cape (option B) – this option would involve vessels passing around the south of NnG and then steering a course through the navigation corridor, resulting in a large deviation.
- The proximity to surface piercing structures to both port and starboard result in this option introducing increased collision and allision risk for passing vessels. However, the width and shape of the navigation corridor results in the number of additional course adjustments required being similar to option A and the navigation corridor is MGN 654 compliant. However, this option is more complex to navigate than option C.
- The presence of small craft operating within or in proximity to the navigation corridor may increase collision risk with commercial vessels (noting the associated routeing included large commercial vessels), noting this may discourage small craft from operating in proximity to the navigation corridor.
- Pass offshore of the Proposed Development array area (option C) – this option would involve vessels passing south of the Proposed Development array area, resulting in a large deviation.
- Vessel schedules could be compromised, although given that the route heads into the open Northern and Central North Sea there is likely to be sufficient opportunity to make up time and soften the extent of the deviation.
In summary, a safe deviation is available for vessels routeing between the Firth of Forth and eastern ports. This can be achieved either by passing offshore of the Proposed Development array area or by utilising the MGN 654 compliant navigation corridor. Given that the size of the deviation associated with these options is similar, it is more likely that mariners will choose to pass offshore of the Proposed Development array area, noting that this option also minimises increases in collision and allision risk.
15.6.4 Main Commercial Routeing Between Forth Ports and Southern Ports
This subsection considers main commercial routeing between ports located within the Firth of Forth and European ports located in the Southern North Sea, such as Antwerp and Hamburg. Figure 15.7 Open ▸ presents two example routes for the pre wind farm scenario – both on a straight east/west course out of the Forth and passing south of the Proposed Development and NnG – together with the baseline, Scenario 1 and Scenario 2 developments. These are based on Routes 2 and 8 from section 11.2.
Figure 15.7 Examples of Pre Wind Farm Main Commercial Routes Between Forth Ports and Southern Ports
The majority of vessels on the associated example routeing were tankers. This included large tankers in excess of 300 m in length, however the majority were less than 200 m.
With the presence of Scenario 1 developments (Inch Cape) in addition to baseline developments and the Proposed Development there is not expected to be any deviation required for routeing out of the Forth and headed into the Southern North Sea, owing to the distance from Scenario 1 developments.
15.6.5 Main Commercial Routeing North–South Following UK East Coast
This subsection considers main commercial routeing between ports located on the UK east coast, such as Aberdeen and ports in the Humber. Figure 15.8 Open ▸ presents two example routes for the pre wind farm scenario – one on a relatively straight north-south course passing towards the eastern extent of the Proposed Development array area and one on a curved course following the UK east coast passing west of the Proposed Development array area and through Inch Cape – together with the baseline, Scenario 1 and Scenario 2 developments. These are based on Routes 1 and 4 from section 11.2, although also bear similarities to Routes 3 and 9.
Figure 15.8 Examples of Pre Wind Farm Main Commercial Routes North-South Following UK East Coast
The majority of vessels on the associated example routeing were commercial vessels of less than 100 m in length, however larger vessels were also present on the routeing further offshore.
With the presence of Scenario 1 developments (Inch Cape) in addition to baseline developments and the Proposed Development a deviation will be required for more westerly routeing. There are three clear options as illustrated in Figure 15.9 Open ▸ and detailed in the text that follows.
Figure 15.9 Cumulative Options for Main Commercial Routes North-South Following UK East Coast
- Pass inshore of the Proposed Development array area and Inch Cape (option A) – this option would involve vessels passing between Bell Rock and Inch Cape, resulting in a moderate deviation.
- Water depths are suitable for such a deviation for the relevant vessels.
- Since these vessels do not currently pass in proximity to Bell Rock it is unlikely to be favoured by mariners.
- Since this option passes in proximity to both Inch Cape and Seagreen there is also an increased collision and allision risk, which could increase due to the presence of coastal cruising routes for small craft.
- Forth Ports would have to contact vessels asking for intentions if vessels shifted to this option (see section 4.2).
- This deviation may increase encounters with recreational vessels, noting that it was raised during consultation (see section 4.2) that the presence of coastal pots may ‘push’ recreational vessels into deviated commercial vessels.
- Utilise the navigation corridor between the Proposed Development array area and Inch Cape (option B) – this option would involve vessels steering a course through the navigation corridor, resulting in a small deviation.
- The proximity to surface piercing features to both port and starboard result in this option introducing increased collision and allision risk for passing vessels. However, the width and shape of the navigation corridor results in the number of additional course adjustments required being similar to the pre wind farm route and the navigation corridor is MGN 654 compliant.
- There is a risk for larger vessels utilising this option in adverse weather associated with under keel clearance from the shallow Marr Bank although given that the associated depths are similar to those navigated on the pre wind farm route the additional risks are considered minimal.
- The presence of small craft operating within or in proximity to the navigation corridor may also increase collision risk with commercial vessels, which may discourage small craft from operating in proximity to the navigation corridor. However, during consultation it was indicated that recreational vessels operating a north-south transit may choose to navigate internally within the eastern portion of Inch Cape (depending on layout), thus avoiding the navigation corridor and reducing collision risk involving recreational vessels.
- Pass offshore of the Proposed Development array area (option C) – this option would involve vessels passing around the east of the Proposed Development array area, likely resulting in a decrease in the route length.
- Vessels using this option would be more exposed to adverse weather given the greater distance from the UK east coast. Given the curved course of this route in the pre wind farm scenario, it is assumed that using the UK east coast as shelter is a key justification for the choice of longer passage and therefore use of this option would not be preferable.
- This option would likely involve passing offshore of Kincardine, potentially increasing adverse weather exposure.
In summary, a safe deviation is available for vessels routeing north-south following the UK east coast. This can be achieved either by passing offshore of the Proposed Development array area or utilising the MGN 654 compliant navigation corridor. Given that the offshore option results in a shorter passage distance and minimises collision and allision risk it is more likely that mariners will choose to pass offshore of the Proposed Development array area in standard weather conditions, noting that this option also minimises increases in collision and allision risk. However, some vessels may prefer to utilise the navigation corridor given that this option retains a passage closer to the coast, particularly in adverse weather conditions.
For more easterly routeing in a north-south direction, there is not anticipated to be any deviation in addition to those anticipated for the Project in isolation scenario, owing to the distance from Inch Cape and the assumption that such vessels will make a small deviation east of the Proposed Development array area.
15.6.6 Main Commercial Routeing Between Dundee and Eastern Ports
This subsection considers main commercial routeing between Dundee and mainland European ports located in the Baltic region. Figure 15.10 Open ▸ presents an example route for the pre wind farm scenario passing north of the Proposed Development array area, together with the baseline, Scenario 1 and Scenario 2 developments. This is based on Route 11 from section 11.2.
Figure 15.10 Example of Pre Wind Farm Main Commercial Route Between Dundee and Eastern Ports
The majority of vessels on the associated example routeing were commercial vessels of less than 100 m in length, however larger vessels were also present.
With the presence of Scenario 1 developments (Inch Cape) in addition to baseline developments and the Proposed Development, a deviation would be required. There is one clear option as illustrated in Figure 15.11 Open ▸ and detailed in the text that follows.
Figure 15.11 Cumulative Options for Main Commercial Routes Between Dundee and Eastern Ports
- Pass north of Inch Cape and Seagreen – this option would involve vessels passing around Seagreen, resulting in a large deviation.
- Water depths are suitable for such a deviation and there is sufficient available sea room west and north of Inch Cape to ensure a safe distance can be maintained from the wind farm structures. Therefore, collision and allision risk is considered to be low.
- Additionally, Regular Operator consultation feedback from HAV Ship Management indicated that when considering the cumulative scenario there are no safety problems foreseen for their vessels – which operate on such a route out of Dundee – including in adverse weather conditions.
In summary, a safe deviation is available for vessels routeing between Dundee and eastern ports. This can be achieved by passing north of Inch Cape and Seagreen. Although a longer passage, this option minimises collision and allision risk and, once the route reaches the open Central North Sea, there is likely to be sufficient opportunity to make up time and soften the extent of the deviation.
16 Collision and Allision Risk Modelling
16 Collision and Allision Risk Modelling
16.1 Overview
16.1 Overview
To inform the risk assessment, a quantitative assessment of some of the major hazards associated with the Proposed Development has been undertaken. The following subsections outline the inputs and methodology used for the collision and allision risk modelling.
16.1.1 Scenarios Under Consideration
For each element of the quantitative assessment, both a pre and post wind farm scenarios with base and future case traffic levels have been considered. As a result, six distinct scenarios have been modelled:
- Pre wind farm with base case traffic levels;
- Pre wind farm future case with a 10% increase on base case traffic levels;
- Pre wind farm future case with a 20% increase on base case traffic levels;
- Post wind farm with base case traffic levels;
- Post wind farm future case with a 10% increase on base case traffic levels; and
- Post wind farm future case with a 20% increase on base case traffic levels.
The results of the base case scenarios are detailed in full in the following subsections, with the equivalent results for each future case scenario provided in section 16.4.
16.1.2 Hazards Under Consideration
Hazards considered in the quantitative assessment are as follows:
- Increased vessel to vessel collision risk;
- Increased powered vessel to structure allision risk;
- Increased drifting vessel to structure allision risk; and
- Increased fishing vessel to structure allision risk.
The pre wind farm assessment has been informed by the vessel traffic survey data (see section 10 and other baseline data sources (such as Anatec’s ShipRoutes database). Conservative assumptions have been made with regard to route deviations and future shipping growth over the lifetime of the Proposed Development.
16.1.3 Post Wind Farm Routeing
The methodology for the post wind farm routeing is outlined in section 15.5.1.
16.2 Pre Wind Farm Modelling
16.2 Pre Wind Farm Modelling
16.2.1 Vessel to Vessel Encounters
An assessment of current vessel to vessel encounters has been undertaken by replaying at high speed the vessel traffic data collected as part of the vessel traffic surveys (see section 5.2). The model defines an encounter as two vessels passing within 1 nm of each other within the same minute. This helps to illustrate where existing shipping congestion is highest and therefore where offshore developments, such as an offshore wind farm, could potentially increase congestion and therefore also increase the risk of encounters and collisions. No account of whether encounters are head on or stern to head are given; only close proximity is accounted for.
Figure 16.1 Open ▸ presents a heat map based upon the geographical distribution of vessel encounter tracks within a density grid. Following this, Figure 16.2 Open ▸ illustrates the daily number of encounters recorded within both the Proposed Development array area study area and the Proposed Development array area throughout the survey periods.
Figure 16.1 Vessel Encounters Heat Map within the Proposed Development Array Area Study Area (28 Days, August 2022 and January 2021)
Figure 16.2 Vessel Encounters per Day within the Proposed Development Array Area Study Area (28 Days, July 2020 & January 2021)
There was on average one encounter per day within the Proposed Development array area study area throughout the survey periods. The greatest number of encounters recorded in one day was four, on 23 January 2021, due to a number of cargo vessels and tankers transiting in the NW corner of the Proposed Development array area study area.
The most frequent vessel types involved in encounters within the Proposed Development array area study area were cargo vessels (31%) followed by tankers (28%) and commercial fishing vessels (19%).
16.2.2 Vessel to Vessel Collision Risk
Using the pre wind farm vessel routeing as input, Anatec’s COLLRISK model has been run to estimate the existing vessel to vessel collision risk within the Proposed Development array area study area. The route positions and widths are based on the vessel traffic survey data and have been validated using the long-term vessel traffic data and consultation with local stakeholders.
A heat map based upon the geographical distribution of collision risk within a density grid for the pre wind farm base case is presented in Figure 16.3 Open ▸ .
Figure 16.3 Pre Wind Farm Vessel to Vessel Collision Risk Heat Map within the Proposed Development Array Area Study Area
Assuming base case vessel traffic levels, the annual collision frequency pre wind farm was estimated to be 8.49×10⁻⁴, corresponding to a return period of approximately one in 1,178 years. This is slightly above the average for UK offshore wind farm developments and is reflective of the relatively large area covered. It is noted that the model is calibrated based upon major incident data at sea which allows for benchmarking but does not cover all incidents, such as minor effects. Other incident data, which includes minor incidents, is presented in section 9.
16.3 Post Wind Farm Modelling
16.3 Post Wind Farm Modelling
16.3.1 Simulated Automatic Identification System
Anatec’s AIS Simulator software was used to gain an insight into the potential re-routed commercial traffic following the installation of the wind farm structures within the Proposed Development array area. The AIS Simulator uses the mean positions of the main commercial routes identified within the Proposed Development array area study area and the anticipated shift post wind farm, together with the standard deviations and average number of vessels on each main commercial route to simulate tracks.
A plot of 28 days of simulated AIS (matching the total duration of the vessel traffic surveys) within the Proposed Development array area study area, based on the deviated main commercial routes, is presented in Figure 16.4 Open ▸ .
It is noted that the simulated AIS represents a maximum design scenario based on routes passing at a minimum mean distance of 1 nm from the Proposed Development array area.
Figure 16.4 Post Wind Farm Simulated Base Case AIS Tracks within the Proposed Development Array Area Study Area (28 Days)
16.3.2 Vessel to Vessel Collision Risk
Using the post wind farm routeing as input, Anatec’s COLLRISK model has been run to estimate the anticipated vessel to vessel collision risk within the Proposed Development array area study area.
A heat map based on the geographical distribution of collision risk within a density grid for post wind farm base case is presented in Figure 16.5 Open ▸ .
Figure 16.5 Post Wind Farm Vessel to Vessel Collision Risk Heat Map within the Proposed Development Array Area Study Area
Assuming base case traffic levels, the annual collision frequency post wind farm was estimated to be 9.69×10⁻⁴, corresponding to a return period of approximately one in 1,032 years. This represents a 15% increase in collision frequency compared to the pre wind farm base case result.
The increase in vessel to vessel collision risk was greatest along the southern and eastern edges of the Proposed Development array area. The change in vessel to vessel collision risk between the base case pre wind farm and post wind farm scenarios is presented in a heat map in Figure 16.6 Open ▸ .
Figure 16.6 Change in Vessel to Vessel Collision Risk within the Proposed Development Array Area Study Area
16.3.3 Powered Vessel to Structure Allision Risk
Based upon the vessel routeing identified within the Proposed Development array area study area, the anticipated re-routeing as a result of the presence of the Proposed Development, and the assumptions that relevant embedded mitigation measures are in place (see section 17), the frequency of an errant vessel under power deviating from its route to the extent that it may come into proximity with a wind farm structure associated with the Proposed Development is considered to be low.
From consultation with the shipping industry, it is also assumed that commercial vessels would be highly unlikely to navigate between wind farm structures due to the restricted sea room and will instead be directed by the aids to navigation located in the region and those present at the Proposed Development. During the construction and decommissioning phases this will primarily consist of the buoyed construction area, while during the operation and maintenance phase this will primarily consist of the lighting and marking of the wind farm structures themselves.
Using the post wind farm routeing as input, together with the maximum design scenario and local meteorological ocean data, Anatec’s COLLRISK model was run to estimate the likelihood of a commercial vessel alluding with one of the wind farm structures within the Proposed Development array area whilst under power. In order to maintain a maximum design scenario, the model did not consider one structure shielding another.
A plot of the annual powered allision frequency per structure for the base case is presented in Figure 16.7 Open ▸ , with the chart background removed to increase the visibility of those structures with lower allision frequencies.
Figure 16.7 Base Case Powered Allision Risk per Structure
Assuming base case vessel traffic levels, the annual powered allision frequency was estimated to be 1.52×10⁻⁴, corresponding to a collision return period of approximately one in 6,581 years.
The greatest powered vessel to structure allision risk was associated with structures along the western edge of the Proposed Development array area, where multiple main commercial routes pass at the minimum 1 nm distance. The greatest individual allision risk was associated with one of the structures on the western edge of the Proposed Development array area (approximately 2.72×10⁻⁵, or one in 36,701 years).
16.3.4 Drifting Vessel to Structure Allision Risk
Using the post wind farm routeing as input, together with the worst-case indicative array layout and meteorological ocean data, Anatec’s COLLRISK model was run to estimate the likelihood of a commercial vessel alluding with one of the wind farm structures within the Proposed Development array area. The model is based on the premise that propulsion on a vessel must fail before drifting will occur. The model takes account of the type and size of the vessel, the number of engines and the average time required to repair but does not consider navigational errors caused by human actions.
The exposure times for a drifting scenario are based upon the vessel hours spent within the Proposed Development array area study area. These have been estimated based on the vessel traffic levels, speeds, and revised routeing patterns. The exposure is divided by vessel type and size to ensure that these specific factors, which based upon analysis of historical incident data have been shown to influence incident rates, are taken into account for the modelling.
Using this information, the overall rate of mechanical failure in proximity to the Proposed Development array area was estimated. The probability of a vessel drifting towards a wind farm structure and drift speed are dependent on the prevailing wind, wave and tidal conditions at the time of the incident. Therefore, three drift scenarios were modelled, each using the meteorological ocean data provided in section 8.
- Wind;
- Peak spring flood tide; and
- Peak spring ebb tide.
The probability of vessel recovery from drift is estimated based upon the speed of the drift and hence the time available before arriving at a wind farm structure. Vessels which do not recover within this time are assumed to allide. Conservatively, no account is made for another vessel (including a vessel associated with the Proposed Development) rendering assistance.
After modelling the three drifting scenarios, the wind dominated scenario was established to produce the worst-case results. A plot of the annual drifting allision frequency per structure for the base case is presented in Figure 16.8 Open ▸ , with the chart background removed to increase the visibility of those structures with a low allision frequency.
Figure 16.8 Base Case Drifting Allision Risk per Structure
Assuming base case vessel traffic levels, the annual drifting allision frequency was estimated to be 7.69×10⁻⁵, corresponding to a return period of approximately one in 12,999 years.
The greatest drifting vessel to structure allision risk was associated with structures along the southern and eastern edges of the Proposed Development array area, at both of which main commercial routes pass at the minimum mean distance of 1 nm from the Proposed Development array area. The greatest individual allision risk was associated with one of the structures on the southern edge of the Proposed Development array area (approximately 4.82×10⁻⁶, or one in 207,650 years).
It is noted that historically there have been no reported drifting allision incidents with wind farm structures in the UK. While drifting vessels do occur every year in UK waters, in most cases the vessel has been recovered prior to any allision incident occurring (such as by anchoring, restarting engines, or being taken in tow).
16.3.5 Fishing Vessel to Structure Allision Risk
Using the vessel traffic survey data as input, Anatec’s COLLRISK model was run to estimate the likelihood of a fishing vessel alluding with one of the wind farm structures within the Proposed Development array area.
A fishing vessel allision is classified separately from other allisions since fishing vessels may be either in transit or actively fishing within the Proposed Development array area (unlike the transiting commercial traffic characterised by the main commercial routes). Additionally, fishing vessels could be observed internally within the Proposed Development array area (i.e., between structures) as well as externally. Anatec’s model uses vessel numbers, sizes (length and beam), array layout and structure dimensions. The likelihood of a major allision incident has been calibrated against historical maritime incident data and historical AIS vessel traffic data within operational wind farm arrays. Given that not all fishing vessels broadcast on AIS, the vessel density observed is scaled up to account for non-AIS fishing vessels, with the scaling factor dependent on the distance of the array offshore.
A plot of the annual fishing vessel allision frequency per structure for the base case is presented in Figure 16.9 Open ▸ .
Figure 16.9 Base Case Fishing Vessel Allision Risk per Structure
Assuming base case traffic levels, the annual fishing vessel to structure allision frequency was estimated to be 2.29×10⁻¹, corresponding to a return period of approximately one in 4.4 years.
The fishing vessel to structure allision risk was distributed throughout the Proposed Development array area, with fishing activity observed throughout. The greatest individual allision risk was associated with a structure (an offshore substation platform) in the north-east of the Proposed Development array area (approximately 2.19×10⁻² or one in 45.6 years).
It is noted that this allision risk result does not give an indication of the consequences of an allision incident which would most likely (based on historical incident data) involve a minor contact with no material damage, injuries to persons or pollution.
16.4 Risk Results Summary
16.4 Risk Results Summary
The previous sections modelled two scenarios, namely the pre and post wind farm scenarios with base case traffic levels. In order to incorporate the potential for future traffic growth, pre and post wind farm scenarios have also been modelled for future case traffic levels (both 10% and 20% increases). Table 16.1 Open ▸ summarises the results of all six scenarios.
Overall, the base case collision and allision frequency due to the presence of the Proposed Development was estimated to increase by approximately 1.95×10⁻¹ (equating to an additional collision or allision every 5.1 years).
Table 16.1 Summary of Annual Collision and Allision Risk Results
17 Embedded Mitigation Measures
17 Embedded Mitigation Measures
As part of the design process for the Proposed Development, a number of embedded mitigation measures have been adopted to reduce the risk of hazards identified, including those relevant to shipping and navigation. These measures have and will continue to evolve over the development process as the EIA progresses and in response to consultation.
These measures typically include those that have been identified as good or standard practice and include actions that will be undertaken to meet existing legislation requirements. As there is a commitment to implementing these measures, and also to various standard sectoral practices and procedures, they are considered inherently part of the design of the Proposed Development.
The embedded mitigation measures within the design relevant to shipping and navigation are outlined in Table 17.1 Open ▸
Table 17.1 Embedded Mitigation Measures Relevant to Shipping and Navigation
17.1 Marine Aids to Navigation
17.2 Design Specifications Noted in Marine Guidance Note 654
The individual wind turbines and other structures will have functions and procedures in place for generator shut down in emergency situations, as per MGN 654 (MCA, 2021).
18 Project in Isolation Risk Assessment
18 Project in Isolation Risk Assessment
This section outlines the final shipping and navigation hazards for the Project in isolation which have been identified based upon:
- Baseline data;
- Consultation;
- Hazard log[12]; and
- Modelling/numerical assessment.
For each hazard, a description of the hazard is given alongside the causes, relevant users. As per section 0, hazards associated with navigation, communications, and position fixing equipment (with the exception of interference with magnetic position fixing equipment) have been screened out of the FSA. Hazards associated with vessels engaged in fishing are considered in volume 2, chapter 12.
To avoid replication of text the risk assessment has been undertaken in volume 2, chapter 13 in line with EIA requirements but does follow the FSA methodology. Table 18.1 Open ▸ summarises the output of the risk assessment undertaken with consideration of the embedded mitigation measures outlined in section 17. Any additional mitigation measures required above those outlined in section 17 are also summarised.
Table 18.1 Summary of Outputs of Risk Assessment
19 Cumulative Risk Assessment
19 Cumulative Risk Assessment
19.1 Navigation Corridor Safety Case
19.1 Navigation Corridor Safety Case
This section considers the gap between the Proposed Development array area and Inch Cape as a navigation corridor and, where appropriate, uses available guidance to provide a safety case for the corridor from a navigational perspective.
Figure 19.1 Open ▸ presents an overview of the gap between the Proposed Development array area and Inch Cape. For the purposes of this subsection, Inch Cape is represented by the array area boundary published by Crown Estate Scotland, noting that a final array layout has not been published at the time of writing. Therefore, as a worst case, it is assumed that build out of Inch Cape could maximise use of the full array area.
Figure 19.1 Overview of Gap Between Proposed Development Array Area and Inch Cape
The length of the gap is dependent upon where it is measured from, with the length increasing towards the eastern extent. At this extreme of the gap, the length is approximately 4.2 nm. Towards the western extent the length of the gap is approximately 3.3 nm (measured north-south from the eastern boundary of Inch Cape) and in a central location is approximately 3.7 nm.
The width of the gap is approximately 4.1 nm at the northern extent and approximately 8.0 nm at the southern extent, with the former representing the minimum overall width.
19.1.1 Navigational Features
The charted water depth within the gap between the Proposed Development array area and Inch Cape varies between 40 and 60 m below CD. There are no existing surface or seabed features within or in proximity to the gap such as aids to navigation, charted wrecks or submarine cables and pipelines.
19.1.2 Potential Users
From the vessel traffic baseline, five of the main commercial routes identified in section 11.2 (Routes 1, 9, 10, 13 and 14) could be candidates for potential use of a navigation corridor. This is a worst case assumption in terms of usage and in reality, it is anticipated that vessels would be more likely to make an alternative choice such as passing inshore (with appropriate draughts/cargoes) of Inch Cape or offshore of the Proposed Development array area as noted in the regular operator response from Evergas (see section 4.2). This is considered further in section 15.6.
Overall, there is an average of three to four transits per day by potential navigation corridor users on the main commercial routes. Applying a conservative 20% increase in commercial vessel movements for the future case scenario (as outlined in section 15.1), an average of four to five transits per day by potential navigation corridor users is considered throughout the rest of this section.
The average length of potential navigation corridor users was 87 m with a 90th percentile length of 131 m. The 90th percentile length is considered throughout the rest of this section.
19.1.3 Application of Marine Guidance Note 654
There are multiple methods within MGN 654 that the MCA may require developers to demonstrate when calculating the safe width of a proposed navigation corridor. Those methods are demonstrated in the following paragraphs.
MGN 654 states that:
The possibility of ships overtaking cannot be excluded and should be taken into consideration. Consequently, the assumption should be that four ships should safely be able to pass each other… Between overtaking and meeting vessels, a distance of two ship’s lengths is normally maintained as a minimum passing distance.
Therefore, the overtaking width for the navigation corridor, based on the 90th percentile length, is 0.42 nm (786 m)[13].
To determine the overall corridor width, the suitable distance between the outermost vessels and the array areas is required. The Shipping Route Template indicates that 1 nm is the “minimum distance to a parallel IMO routeing measure” and is widely accepted in the industry as a minimum passing distance from an offshore wind farm.
Therefore, the minimum overall width for the navigation corridor, based on the 90th percentile length is 2.4 nm.
Additionally, MGN 654 states that:
Experience also shows that in heavy sea conditions it is much harder to turn the vessel around and [it] may not be possible to achieve a dead stop and deviations from track are common. Therefore 20° or more, are common and must be considered in developing corridors through OREIs.
Applying this 20-degree rule to the minimum navigation corridor length of 3.3 nm (the shortest north-south length) gives a corresponding width requirement of 1.2 nm.
19.1.4 Application of Permanent International Association of Navigation Congresses Guidance
The Guidance on the Interaction between Offshore Wind Farms and Maritime Navigation (Permanent International Association of Navigation Congresses (PIANC), 2018) provides a methodology for calculating the width of corridor required to make a round turn to starboard in the event of a head-on encounter between two vessels. Although this methodology is designed for a Traffic Separation Scheme running parallel to an offshore wind farm, it is considered relevant and useful for corridor design, noting that vessels will have greater flexibility to alter course in the event that collision avoidance is required than would be the case within an IMO routeing measure.
As illustrated in Figure 19.2 Open ▸ , the calculation assumes an initial deviation of 0.3 nm, turning circle of six vessel lengths diameter and 500 m safety margin.
Figure 19.2 Sea Space Required for a Full Round Turn to Starboard (PIANC, 2018)
Applying the calculation to the navigation corridor gives a total width requirement of 2.0 nm, with the breakdown of the distances considered illustrated in Figure 19.3 Open ▸ .
Figure 19.3 Application of PIANC Guidance to Navigation Corridor Between Proposed Development Array Area and Inch Cape
19.1.5 Application of Maritime Institute Netherlands Guidance
A study undertaken by the Maritime Institute Netherlands (MARIN) and referenced in both the PIANC guidance and The Shipping Industry and Marine Spatial Planning (MSP) – A Professional Approach (Nautical Institute, 2013) states that the width of a navigation corridor should consider:
- Number of vessels: based on AIS study, keeping in mind the future development during the lifespan of the structures;
- Maximum size of vessels: same as point 1 re: future development;
- Number of vessels overtaking:
- <4,400 vessels per year: 2 vessels side to side.
- >4,400 vessels and <18,000 vessels: 3 side to side.
- >18,000 vessels: 4 vessels side to side.
- Room per vessel: 2 ship lengths.
The following example is provided, noting that a separation of one vessel length between the flank vessels and the array is assumed:
For example: a traffic lane that accommodates 18,000 vessels per year with a maximum size of 400 m should be at least 3,200 m (1.72 nm) wide.
Applying this calculation to the Proposed Development, the number of potential navigation corridor users per day was estimated as three to four, which corresponds to approximately 1,240 vessels per year. Under the MARIN guidance this leads to an assumption that two vessels should be able to pass side by side through the corridor. Therefore, the overall corridor width (inclusive of the separation between the flank vessels and the array) is 0.28 nm (524 m). Applying the MGN 654 Shipping Route Template value of 1 nm between the flank vessels and the array, the overall corridor width is 2.1 nm.
19.1.6 Application of International Regulations for Preventing Collisions at Sea
The COLREGs are the rules and regulations that help regulate vessel traffic movements throughout the world. It is therefore important that the navigation corridor does not prevent a vessel from being able to comply with these regulations. Although the COLREGs do not make specific provision for a separation between offshore wind farms such as a navigation corridor, they do lay down rules for navigating within a narrow channel which may be somewhat applicable.
Rule 9a states:
A vessel proceeding along the course of a narrow channel or fairway shall keep as near to the outer limit of the channel or fairway which lies on her starboard side as is safe and practicable.
However, a vessel should not enter the gap unless it is confident that it can alter course and manoeuvre as required to comply with the collision regulations and avoid a collision. Course alterations within the gap should not be required under most circumstances given that vessels will be able to navigate straight through on a generally north-south bearing.
Rule 9b states:
A vessel of less than 20 m in length or a sailing vessel shall not impede the passage of a vessel which can safely navigate only within a narrow channel or fairway.
Furthermore, Rule 9c states:
A vessel engaged in fishing shall not impede the passage of any other vessel navigation within a narrow channel or fairway.
Although the COLREGs give priority to vessels navigating within a narrow channel it is still prudent for the purpose of minimising the navigational risk to consider any dense activity involving relevant small craft.
From analysis of non-commercial vessel traffic (see section 10.1.2 and Appendix E), it can be seen that there is moderate fishing vessel activity within and in proximity to the navigation corridor including active fishing as well as transits. Recreational vessel activity within and in proximity to the navigation corridor is relatively low, primarily consisting of north-south transits. However, from consultation there is potential for recreational users to be discouraged from navigating in the area (see 27 July 2022 entry in Table 4.1 Open ▸ ).
The shape of the navigation corridor is suitable for identifying small craft whilst making passage through the navigation corridor. Although not a conventional parallelogram in shape, the navigation corridor is shaped such that vessels have a clear view of any small craft located at the other end or side of the corridor, including in low visibility.
19.1.7 Effect of Non-Transit Users
As noted in section 10.1.2.3 and Appendix E, there are moderate volumes of fishing activity located in proximity to the navigation corridor. A fishing vessel engaged in fishing activities may be unable to make a manoeuvre in sufficient time to avoid an oncoming commercial vessel making passage through the corridor. However, the considerable minimum spacing between structures in proximity to the corridor within the Proposed Development array area (minimum spacing of 1,000 m) and the Inch Cape array area (consented minimum spacing of 1,278 m (ICOL, 2018)) will assist with earlier detection by passing vessels of any smaller craft present within or on the other side of the corridor.
For vessels associated with the Proposed Development, any movements within or in proximity to the corridor will be made in line with the designed-in mitigation measures (see section 17) including compliance with the COLREGs and MGN 372 (MCA, 2008).
A similar mitigation measure is provided in the Inch Cape EIA Report (ICOL, 2018) in relation to vessels associated with Inch Cape works:
Appropriate marine coordination (through a dedicated marine coordination function) of the Development’s own vessels will be implemented in order to ensure that construction vessels do not create additional risk to third parties.
With these mitigation measures in place, it is not anticipated that vessels (either for the Proposed Development or Inch Cape) will have any detrimental effect on the ability of navigation corridor users to make passage safely.
19.1.8 Radar Interference
For vessels transiting through the navigation corridor there may be a potential for increased exposure to radar interference. This is considered fully in section 13.8 as part of the wider assessment of risks associated with navigation, communication and position fixing equipment and is not considered to have a significant effect. In particular, it is very unlikely that vessels will navigate within 0.5 nm of a wind turbine (the distance at which intolerable risks can be experienced).
19.1.9 Consultation
The cumulative scenario has been highlighted throughout the scoping and EIA process for the Proposed Development. For example, the shipping and navigation section of the Scoping Report included a targeted question for consultees in relation to the scope of the cumulative assessment and what effects may be seen at a cumulative level (RPS Energy, 2021). This was mirrored in the round of Regular Operator consultation undertaken (see Appendix D) and the cumulative scenario was a key consideration during the Hazard Workshops that involved representatives for multiple shipping and navigation users.
Comments received relating to the proposed navigation corridor – which are provided in Table 4.1 Open ▸ – are summarised in the following paragraphs.
19.1.9.1 Maritime and Coastguard Agency
The MCA commented during a consultation meeting that any navigation corridors would need to be in accordance with MGN 654 and local consultation with regular users and ports is key for any navigation corridor assessment. The MCA also stated during the first Hazard Workshop that an adjustment to the north-west boundary of the Proposed Development array area should be considered to allow vessels more space when navigating between the Proposed Development array area and Inch Cape.
19.1.9.2 UK Chamber of Shipping
The MCA’s suggestion for an adjustment to the boundary of the Proposed Development array area (as presented at the first Hazard Workshop) was echoed by the UK Chamber of Shipping in email correspondence, noting that vessels may choose to pass east or west of both the Proposed Development array area and Inch Cape rather than use the navigation corridor.
19.1.9.3 Fishermen’s Mutual Association
The FMA commented during the first Hazard Workshop that fishing vessels will be forced into the navigation corridor and have to share the space with commercial vessels. The consequences of a collision incident between a commercial vessel and a fishing vessel could be significant noting that the bend in the navigation corridor (as presented at the first Hazard Workshop) increases the probability of a collision incident occurring.
The FMA also indicated that vessels may be wary of utilising the navigation corridor in adverse weather, adding in the second Hazard Workshop that larger tankers may face increased risks due to the Marr Bank, particularly in adverse weather.
19.1.9.4 Northern Lighthouse Board
NLB commented during the first Hazard Workshop that large vessels would be more comfortable transiting east of the Proposed Development with only smaller vessels likely to utilise the navigation corridor (as presented at the first Hazard Workshop). NLB also highlighted in a Scoping Opinion response that the potential ‘funnelling’ of vessel traffic between offshore wind farm developments was of particular interest.
19.1.9.5 Royal Yacht Association Scotland
RYA Scotland commented during the first Hazard Workshop that if commercial traffic chooses to make passage through the navigation corridor (as presented at the first Hazard Workshop) then recreational users may be discouraged from navigating in that area. However, during the second Hazard Workshop, RYA Scotland acknowledged that some recreational vessels may choose to cut across the eastern extent of the Inch Cape array area, thus avoiding the potential for increased interaction in the navigation corridor.
RYA Scotland indicated during the second Hazard Workshop that the refinement of the Proposed Development array area reduces the level of concern for recreational users. Additionally, the alignment of the western boundary of the Proposed Development array area with the western boundary of Seagreen is a positive change since it is now clearer how vessels will transit the area, which will assist with passage planning.
19.1.9.6 Scottish Whitefish Producers Association
The Scottish Whitefish Producers Association indicated during the second Hazard Workshop that the refinement of the Proposed Development array area is beneficial. This is particularly important given that the overall size of the Proposed Development array area will require careful passage planning for any internal navigation within the array.
19.1.9.7 Forth Ports
Forth Ports commented during the second Hazard Workshop that the proximity of the other offshore wind farms in the region could form a ‘crossroads’ which may create a pinch point. Additionally, the region is known to experience significant adverse weather and (prior to the construction of Inch Cape) vessels transiting east-west to/from the River Tay will need to navigate through the gap between the Proposed Development array area and Seagreen.
19.1.9.8 Regular Operators
In Regular Operator responses, both HAV Ship Management and North Star Shipping indicated that there were no concerns with the safety of their vessels foreseen when considering the cumulative scenario. In contrast, Evergas indicated that their vessels would deviate around the south and east of the Proposed Development array area since this would be safer than utilising the navigation corridor (as presented at the first Hazard Workshop) or making passage inshore of Inch Cape given the difficult situation that would develop in the event of machinery failure.
19.1.10 Refinement of Proposed Development Array Area
As detailed in section 6.1.1.1 and noted in some of the consultation feedback, the extent of the Proposed Development array area has been refined markedly during the NRA process, including at the north western corner. This change was primarily driven by the need to increase the width of the gap between the Proposed Development array area and Inch Cape in line with the feedback received in the first Hazard Workshop.
The minimum width of the gap has been increased from approximately 2.1 nm to 4.1 nm, with the shape of the gap also changing to become closer to a conventional parallelogram. This increase in width assists in ensuring that there is sufficient sea room available for vessels to safely navigate through the gap including in the event of collision avoidance action being required (as indicated by the various width calculations undertaken in the previous subsections). Additionally, the shape of the gap has become closer to a conventional parallelogram in shape, such that vessels should have a clearer view of each other when approach and navigating within the gap, further reducing the collision risk.
19.1.11 Embedded Mitigation Measures
The following mitigation measures will assist in ensuring that the navigational risk associated with the navigation corridor between the Proposed Development array area and Inch Cape is ALARP:
- Compliance with MGN 654 and its annexes where applicable as part of the Design Specification and Layout Plan;
- Lighting and marking of the Proposed Development array area in agreement with NLB and in line with IALA Recommendation O-139 (IALA, 2021 (a)) and Guidance G1162 (IALA, 2021 (b));
- Marine coordination and communication to manage vessel movements;
- Compliance of all vessels associated with the Proposed Development with international marine regulations as adopted by the Flag State, notably the COLREGs (IMO, 1972/77) and SOLAS (IMO, 1974);
- Promulgation of information for vessel routes, timings and locations, Safety Zones and advisory passing distances as required via Kingfisher Bulletins; and
- The buoyed construction area size and location will consider the need to maintain safe navigation through the navigation corridor, noting that this will be determined post consent in agreement with NLB.
It is noted that no part of the navigation corridor is within the Order Limits for the Proposed Development or Inch Cape. Therefore, no infrastructure associated with either development (including subsea cables) will be located within the navigation corridor.
19.1.12 Summary and Conclusion
This safety case has considered the following in relation to the navigation corridor between the Proposed Development array area and Inch Cape:
- Relevant navigational features within or in proximity to the navigation corridor;
- Number, size and speed of potential navigation corridor users;
- Relevant guidance and legislation including MGN 654, PIANC guidance and MARIN guidance as well as the COLREGs;
- Non-transit users and activities;
- Radar interference;
- Consultation undertaken with relevant stakeholders including Regular Operators; and
- Embedded mitigation measures.
Table 19.1 Open ▸ summarises the outcome of the various width calculations undertaken based on relevant guidance.
Table 19.1 Summary of Navigation Corridor Width Calculations
With the provision outlined in section 17 in place, the navigation corridor (which has a minimum width of 4.1 nm) satisfies the various width calculations.
The size of vessels identified as potential corridor users are generally small to moderate, as indicated by the 90th percentile length of 131 m. However, the presence of fishing vessels in proximity to the corridor, including active fishing activities, mean that collision risk is increased but is managed by the navigation corridor’s design being in compliance with MGN 654 which minimises the likelihood of an encounter and allows compliance with COLREGs. This includes in adverse weather conditions noting that the 20-degree rule provided in MGN 654 is designed to account for “deviations from track” in poorer conditions.
On this basis, the navigation corridor can be considered to meet safety of navigation expectations.
19.2 Summary of Cumulative Risk Assessment
19.2 Summary of Cumulative Risk Assessment
To avoid replication of text the cumulative risk assessment (assessment of effects) has been undertaken in volume 2, chapter 13 in line with EIA requirements but does follow the FSA methodology. The following sections however summarise the output of the cumulative risk assessment and any additional mitigation measures required.
Table 19.2 Open ▸ summarises the output of the risk assessment undertaken with consideration of the embedded mitigation measures outlined in section 17. Any additional mitigation measures required above those outlined in section 17 are also summarised.
Table 19.2 Summary of Outputs of Cumulative Risk Assessment
20 Through Life Safety Management
20 Through Life Safety Management
20.1 Quality, Health, Safety and Environment
20.1 Quality, Health, Safety and Environment
Quality, Health, Safety and Environment (QHSE) documentation including a Safety Management System (SMS) will be in place for the Project and will be continually updated throughout the development process. The following subsections provide an overview of this documentation and how it will be maintained and reviewed with reference, where required, to specific marine documentation.
Monitoring, reviewing, and auditing will be carried out on all procedures and activities and feedback actively sought. Any designated person (identified in QHSE documentation), managers, and supervisors are to maintain continuous monitoring of all marine operations and determine if all required procedures and processes are being correctly implemented.
20.2 Incident Reporting
20.2 Incident Reporting
After any incidents, including near misses, an incident report form will be completed in line with the Project QHSE documentation. This will then be assessed for relevant outcomes and reviewed for possible changes required to operations.
The Applicant will maintain records of investigation and analyse incidents in order to:
- Determine underlying deficiencies and other factors that may be causing or contributing to the occurrence of incidents;
- Identify the need for corrective action;
- Identify opportunities for preventative action;
- Identify opportunities for continual improvement; and
- Communicate the results of such investigations.
All investigations shall be performed in a timely manner.
A database (lessons learnt) of all marine incidents will be developed. It will include the outcomes of investigations and any resulting actions. The Applicant will promote awareness of their potential occurrence and provide information to assist monitoring, inspection and auditing of documentation.
When appropriate, the designated person (noted within the Emergency Response Cooperation Plan (ERCoP)) should inform the MCA of any exercise or incidents including any implications on emergency response. If required, the MCA should be invited to take part in incident debriefs.
20.3 Review of Documentation
20.3 Review of Documentation
The Applicant will be responsible for reviewing and updating all documentation including the risk assessments, ERCoP, SMS and, if required, will convene a review panel of stakeholders to quantify risk.
Reviews of the risk register should be made after any of the following occurrences:
- Changes to the development, conditions of operation and prior to decommissioning;
- Planned reviews; and
- Following an incident or exercise.
A review of potential risks should be carried out annually. A review of the response charts should be undertaken annually to ensure that response procedures are up to date and should include any amendments from audits, incident reports and identified deficiencies.
20.4 Inspection of Resources
20.4 Inspection of Resources
All vessels, facilities, and equipment necessary for marine operations are to be subject to appropriate inspection and testing to determine fitness for purpose and availability in relation to their performance standards. This will include monitoring and inspection of all aids to navigation to determine compliance with the performance standards specified by NLB.
20.5 Audit Performance
20.5 Audit Performance
Auditing and performance review are the final steps in QHSE management systems. The feedback loop enables an organisation to reinforce, maintain and develop its ability to reduce risks to the fullest extent, and to ensure the continued effectiveness of the system. The Applicant will carry out audits and periodically evaluate the efficiency of the marine safety documentation.
The audits and possible corrective actions should be undertaken in accordance with standard procedures and results of the audits and reviews should be brought to the attention of all personnel having responsibility in the area involved.
20.6 Safety Management System
20.6 Safety Management System
The Applicant will manage the risk associated with the activities undertaken at the Proposed Development. An integrated SMS, which ensures that the safety and environmental risks of those activities are ALARP, will be established. This includes the use of remote monitoring and switching for aids to navigation to ensure that if a light is faulty a quick fix can be instigated, which will allow IALA availability requirements to be met.
20.7 Cable Monitoring
20.7 Cable Monitoring
The subsea cable routes will be subject to periodic inspection post-construction to monitor the cable protection, including burial depths. Maintenance of the protection will be undertaken as necessary.
If exposed cables or ineffective protection measures are identified during post-construction monitoring, these would be promulgated to relevant sea users including via Notice to Mariners and Kingfisher Bulletins. Where immediate risk was observed, the Applicant would also employ additional temporary measures (such as a guard vessel or temporary buoyage) until such time as the risk was permanently mitigated.
Details will be included in full within the assessment of cable burial and protection document, to be produced post-consent.
20.8 Hydrographic Surveys
20.8 Hydrographic Surveys
As required by annex 4 of MGN 654, detailed and accurate hydrographic surveys will be undertaken periodically at intervals agreed with the MCA.
20.9 Decommissioning Plan
20.9 Decommissioning Plan
A Decommissioning Plan will be developed post consent. With regards to hazards to shipping and navigation, this will also include consideration of the scenario where upon decommissioning and completion of removal operations, an obstruction is left on-site (attributable to the Proposed Development) which is considered to be a danger to navigation and which it has not proved possible to remove. Such an obstruction may require marking until such time as it is either removed or no longer considered a danger to navigation, the continuing cost of which would need to be met by the Applicant.
21 Summary
21 Summary
This NRA has determined the hazards to shipping and navigation users associated with the Project based upon quantitative and qualitative elements including available datasets and consultation. These hazards have been fed into the risk assessment for shipping and navigation within volume 2, chapter 13.
21.1 Consultation
21.1 Consultation
The NRA process has included consultation with stakeholders of relevance to shipping and navigation. This has included consideration of the outputs of the scoping process, direct liaison with key stakeholders (both statutory and non-statutory), outreach to Regular Operators of the area, and two Hazard Workshops. Stakeholders consulted include:
- MCA;
- NLB;
- UK Chamber of Shipping;
- RYA Scotland;
- CA;
- Forth Yacht Clubs Association;
- Evergas;
- HAV Shipping;
- North Star Shipping;
- FMA including representation of SFF;
- RNLI;
- Forth Ports;
- Intrada;
- Regional Inshore Fisheries Group;
- Scottish Whitefish Producers Association;
- FIR for ‘Borders to Cove, ‘Port Seton’, and ‘Montrose and Arbroath’;
- INEOS; and
- Shell.
21.2 Existing Environment
21.2 Existing Environment
21.2.1 Navigational Features
Key navigational features in the area include the nearby NnG and Seagreen offshore wind farms which are both under construction at the time of writing. The closest port or harbour is Arbroath Harbour, located approximately 23 nm to the north-west, on the Angus coast; however, the major ports in the area in terms of traffic volumes are located within the Firth of Forth. There are 10 charted wrecks located within the Proposed Development array area.
The closest anchorage location to the Proposed Development is the designated anchorage off Dunbar located approximately 3.5 nm to the west of the Skateraw landfall location.
21.2.2 Maritime Incidents
A review of recent incident data from the MAIB and RNLI indicates an average of one to two incidents per year within the Proposed Development array area shipping and navigation study area. The MAIB dataset indicates that incident frequency for the most recent ten years available (2010 to 2019) has decreased over that observed in the previous ten years (2000 to 2009).
21.2.3 Vessel Traffic Movements
Based on the 28 days of vessel traffic data collected via on-site surveys, there was an average of approximately 14 unique vessels per day recorded within the Proposed Development array area shipping and navigation study area. The most common vessel types recorded were cargo vessels, tankers, and commercial fishing vessels.
A total of 14 main commercial routes were identified based on the vessel traffic data studied, with the busiest of these used by one to two vessels a day.
21.3 Future Case Vessel Traffic
21.3 Future Case Vessel Traffic
Of the 14 main routes identified, it is anticipated that seven will deviate as a result of the Proposed Development array area. The largest percentage increase in terms of overall change in route length was to Routes 5 and 14, with a 0.8% increase. The largest change on an absolute basis was to Route 14, with a 26.0 nm increase; however, this is a transatlantic route, and as such this represented a small change on a relative percentage basis.
21.4 Collision and Allision Risk Modelling
21.4 Collision and Allision Risk Modelling
The NRA process included quantitative modelling of the change in allision and collision frequency as a result of the Proposed Development, with consideration given to future cases in terms of potential future traffic increases.
It was estimated that the return period of a vessel being involved in a collision post wind farm was 1,031 years assuming base case traffic levels. This represents a 14% increase in collision frequency compared to the pre wind farm base case result.
The powered allision return period post wind farm was estimated at 6,581 years assuming base case traffic levels. The corresponding drifting allision return period post wind farm was estimated at 12,999 years. The fishing vessel allision return period was estimated at 5.1 years.
21.5 Risk Statement
21.5 Risk Statement
Based on the findings of the NRA in terms of potential hazards and associated risks, the following hazards listed in Table 18.1 Open ▸ (project in isolation) and Table 19.2 Open ▸ (cumulative) have been assessed in volume 2, chapter 13.
Overall, the risk assessment concluded that there will be no significant risks arising from the Proposed Development in isolation with embedded mitigations in place during the construction, operation and maintenance or decommissioning phases.
The cumulative hazards assessed are as per the assessment of the Proposed Development in isolation and the cumulative risk assessment concluded that there will be no significant cumulative risks arising from the Proposed Development in combination with cumulative developments with embedded mitigations in place during the construction, operation and maintenance or decommissioning phases.
22 References
22 References
4C Offshore (2018). Wind farm support vessel to the rescue. Lowestoft: 4C Offshore. https://www.4coffshore.com/news/wind-farm-support-vessel-to-the-rescue-nid8059.html (accessed November 2021).
4C Offshore (2020). Offshore wind vessel joins search for missing pilot. Lowestoft: 4C Offshore. https://www.4coffshore.com/news/offshore-wind-vessel-joins-search-for-missing-pilot-nid17573.html (accessed November 2021).
Anatec and TCE (2012). Strategic Assessment of Impacts on Navigation of Shipping and Related Effects on Other Marine Activities Arising from the Development of Offshore Wind Farms in the UK REZ. Aberdeen: Anatec.
BEIS (2022). Contracts for Difference Allocation Round 4 results. London: BEIS.
BWEA (2007). Investigation of Technical and Operational Effects on Marine Radar Close to Kentish Flats Offshore Wind Farm. London, UK: BWEA (now RenewableUK), BEIS, MCA & PLA.
DfT (2001). Identification of Marine Environmental High Risk Areas (MEHRAs) in the UK. London: DfT.
DfT (2012). UK Ports: Ship Arrivals. London: The Stationary Office.
Edinburgh Evening News (2021). Mum’s horrific inflatable ordeal at East Lothian beach as dinghy is swept out to sea. https://www.edinburghnews.scotsman.com/lifestyle/family-and-parenting/mums-horrific-inflatable-ordeal-at-east-lothian-beach-as-dinghy-is-swept-out-to-sea-3331559 (accessed November 2021).
Energinet (2014). Horns Rev 3 Offshore Wind Farm Technical Report no. 12 – Radio Communication and Radars. Fredericia, Denmark: Energinet.
G+ (2021). G+ Global Offshore Wind Health & Safety Organisation 2020 Incident Data Report. London: Energy Institute.
IALA (2021 (a)). IALA Recommendation O-139 on The Marking of Man-Made Offshore Structures. Edition 2. Saint Germain en Laye, France: IALA.
IALA (2021 (b)). IALA Guidance G1162 The Marking of Offshore Man-Made Structures. Edition 2. Saint Germain en Laye, France: IALA.
ICOL (2018). Inch Cape Offshore Windfarm (Revised Design) - EIA Report. Edinburgh: ICOL.
IMO (1974). International Convention for the Safety of Life at Sea (SOLAS). London: IMO.
IMO (2001). Maritime Safety Committee, 74th Session, Agenda Item 5 – Bulk Carrier Safety: Formal Safety Assessment of Life Saving Appliance for Bulk Carriers. London: IMO.
IMO (2018). Revised Guidelines for Formal Safety Assessment (FSA) for Use in the Rule-Making Process. MSC-MEPCC.2/Circ.12/Rev.2. London: IMO.
MAIB (2013). Casualty Definitions Used by the UK MAIB – From 2012. London: MAIB.
Marine Scotland (2019). Defence (Military) – Military exercise areas and danger areas (PEXAs). http://marine.gov.scot/maps/518 (accessed November 2021).
Marine Scotland (2022). Environmental Impact Assessment Report – Forthwind Offshore Wind Demonstration Project – Methil, Fife. https://marine.gov.scot/data/environmental-impact-assessment-report-forthwind-offshore-wind-demonstration-project-methil (accessed July 2022).
Met Office (2019). Case studies of past weather events. Exeter: Met Office. https://www.metoffice.gov.uk/weather/learn-about/past-uk-weather-events#y2019 (accessed November 2021).
MCA and QinetiQ (2004). Results of the Electromagnetic Investigations 2nd Edition. Southampton: MCA and Qinetic.
MCA (2005). Offshore Wind Farm Helicopter Search and Rescue Trials Undertaken at the North Hoyle Wind Farm. Southampton: MCA.
MCA (2008). Marine Guidance Note 371 (Merchant and Fishing) Offshore Renewable Energy Installations (OREIs): Guidance on UK Navigational Practice, Safety and Emergency Response Issues. Southampton: MCA.
MCA (2008). Marine Guidance Note 372 (Merchant and Fishing) Offshore Renewable Energy Installations (OREIs): Guidance to Mariners Operating in the Vicinity of UK OREIs. Southampton: MCA.
MCA (2021). Marine Guidance Note 654 (Merchant and Fishing) safety of Navigation: offshore Renewable Energy Installations (OREIs) – Guidance on UK Navigational Practice, Safety and Emergency Response. Southampton: MCA.
Moray Offshore Renewables (2012). Environmental Statement Technical Appendix 4.3D – Electromagnetic Fields Modelling. http://marine.gov.scot/datafiles/lot/morl/Environmental_statement/Volumes%208%20to%2011%20-%20Technical%20Appendices/Volume%2010%20Part%201%20-%20Biological%20Environment%20Technical%20Appendices/Appendix%204.3%20D%20-%20Electromagnetic%20Fields%20Modelling.pdf (accessed January 2022).
Nautical Institute (2013). The Shipping Industry and Marine Spatial Planning (MSP) – A Professional Approach. London: Nautical Institute.
North Connect (2018). Chapter 18: Electric and Magnetic Fields & Sediment Heating. http://marine.gov.scot/sites/default/files/18_emf_sediment_heating_0.pdf (accessed January 2022).
Offshore WIND (2020). Dudgeon Crew Rescues Injured Fishermen. Schiedam, Netherlands: Offshore WIND. https://www.offshorewind.biz/2020/12/23/dudgeon-crew-rescues-injured-fishermen/ (accessed November 2021).
OSPAR (2008). Background Document on Potential Problems Associated with Power Cables Other Than Those for Oil and Gas Activities. Paris, France: OSPAR Convention.
PIANC (2018). Guidance on the Interaction between Offshore Wind Farms and Maritime Navigation. Brussels: PIANC.
PLA (2005). Interference to Radar Imagery from Offshore Wind Farms. 2nd Nautical Offshore Renewable Energy Liaison (NOREL) WP4. London: PLA.
RenewableUK (2014). Offshore Wind and Marine Energy Health and Safety Guidelines. Issue 2. London: RenewableUK.
Renews (2019). Gwynt y Mor vessel answers rescue call. Winchester: Renews. https://renews.biz/54133/gwynt-y-mor-vessel-answers-rescue-call/ (accessed November 2021).
RNLI (2016). Barrow RNLI rescues crew after fishing vessel collides with wind turbine. Barrow: RNLI. https://rnli.org/news-and-media/2016/may/26/barrow-rnli-rescues-crew-after-fishing-vessel-collides-with-wind-wind turbine (accessed November 2021).
RPS Energy (2020). Seagreen 2 Scoping Report. 1st revision. Abingdon: RPS Energy.
RPS Energy (2021). Berwick Bank Wind Farm Offshore EIA Scoping Report. Abingdon: RPS Energy.
RYA (2019). The RYA’s Position on Offshore Renewable Energy Developments: Paper 1 (of 4) – Wind Energy. 5th revision. Southampton: RYA.
RYA (2019). UK Coastal Atlas of Recreational Boating 2.1. Southampton: RYA.
RYA and CA (2004). Sharing the Wind – Recreational Boating in the Offshore Wind Strategic Areas. Southampton and London: RYA and CA.
Seagreen Wind Energy Ltd. (2020). Seagreen Offshore Wind Farm – Construction Programme (CoP). 3rd revision. Glasgow: Seagreen Wind Energy Ltd.
Seagreen Wind Energy Ltd. (2021). Seagreen Offshore Wind Farm Safety Zone Application – Wind Turbine Generators. 1st revision. Glasgow: Seagreen Wind Energy Ltd.
The Isle of Thanet News (2019). Margate RNLI call out to yacht tied to London Array wind turbine. Ramsgate: The Isle of Thanet News. https://theisleofthanetnews.com/2019/05/16/margate-rnli-call-out-to-yacht-tied-to-london-array-wind-wind turbine/ (accessed November 2021).
UKHO (2021). Admiralty Sailing Directions North Sea (West) Pilot NP54. 12th Edition. Taunton: UKHO.
Vessel Tracker (2020). One Injured in Hard Impact at Wind Turbine. Vessel Tracker https://www.vesseltracker.com/en/Ships/Seacat-Ranger-I1746352.html (accessed November 2021).
Appendix A Marine Guidance Note 654 Checklist
Appendix A Marine Guidance Note 654 Checklist
The MGN 654 checklist can be divided into two distinct checklists, one considering the main MGN 654 guidance document and one considering the Methodology for Assessing Marine Navigational Safety and Emergency Response Risks of OREIs (MCA, 2021) which serves as Annex 1 to MGN 654.
The checklist for the main MGN 654 guidance document is presented in Table A.1. Following this, the checklist for the MCA’s methodology annex is presented in Table A.2. For both checklists, references to where the relevant information and/or assessment is provided in the NRA is given.
Table A.1 MGN 654 Checklist for Main Document
Issue | Compliance | Reference and Notes |
|---|---|---|
Site and Installation Co-ordinates. Developers are responsible for ensuring that formally agreed coordinates and subsequent variations of site perimeters and individual OREI structures are made available, on request, to interested parties at relevant project stages, including application for consent, development, array variation, operation and decommissioning. This should be supplied as authoritative GIS data, preferably in Environmental Systems Research Institute (ESRI) format. Metadata should facilitate the identification of the data creator, its date and purpose, and the geodetic datum used. For mariners’ use, appropriate data should also be provided with latitude and longitude coordinates in WGS84 (European Terrestrial Reference System 1989 (ETRS89)) datum. | ||
Traffic Survey. Includes: | ||
All vessel types | | Section 10: Vessel Traffic Movements All vessel types are considered with specific breakdowns by vessel type given for the Proposed Development array area (see section 10.1) and export cable corridor (see section 10.2) shipping and navigation study areas. |
At least 28 days duration, within either 12 or 24 months prior to submission of the ES. | | Section 5.2: Vessel Traffic Data Collection Methodology A total of 28 full days of vessel traffic survey data from July 2020 and January 2021 has been assessed within the Proposed Development array area and export cable corridor shipping and navigation study areas. |
Multiple data sources | | Section 5.2: Vessel Traffic Data Collection Methodology The vessel traffic survey data includes AIS, visual observations and radar for the summer and winter periods in order to ensure maximal coverage of vessels not broadcasting on AIS.
Section 5: Data Sources Additional data sources including the RYA Coastal Atlas, VMS, the long term AIS data and consultations input have also been considered. |
Seasonal variations | | Section 5.2: Vessel Traffic Data Collection Methodology A total of 28 full days of vessel traffic survey data from July 2020 and January 2021 has been assessed within the Proposed Development array area and export cable corridor shipping and navigation study areas.
Section 5: Data Sources Additional long term data sources including VMS and the long term AIS data have also been considered. |
MCA consultation | | Section 4: Consultation The MCA has been consulted as part of the NRA process including through the Hazard Workshop. |
General Lighthouse Authority (GLA) consultation | | Section 4: Consultation NLB has been consulted as part of the NRA process including through the Hazard Workshop. |
UK Chamber of Shipping consultation | | Section 4: Consultation The UK Chamber of Shipping has been consulted as part of the NRA process including through the Hazard Workshop. |
Recreational and fishing vessel consultation | | Section 4: Consultation The RYA, CA and FMA have been consulted as part of the NRA process including through the Hazard Workshop. |
Port and navigation authorities consultation, as appropriate | | Section 4: Consultation Forth Ports has been consulted as part of the NRA process including through the Hazard Workshop. |
Assessment of the cumulative and individual effects of (as appropriate): | ||
i. Proposed OREI site relative to areas used by any type of marine craft. | | Section 10: Vessel Traffic Movements Vessel traffic data in proximity to the Proposed Development has been analysed.
Section 19: Cumulative Risk Assessment The hazards due to the Proposed Development have been identified for each phase. |
ii. Numbers, types and sizes of vessels presently using such areas. | | Section 10: Vessel Traffic Movements Vessel traffic data in proximity to the Proposed Development has been analysed and includes breakdowns of daily vessel count, vessel type and vessel size. |
iii. Non-transit uses of the area, e.g. fishing, day cruising of leisure craft, racing, aggregate dredging, personal watercraft etc. | | Section 7: Navigational Features Section 7.7.3 confirms that there are no marine aggregate dredging areas in the region.
Section 10: Vessel Traffic Movements Non-transit users were identified in the vessel traffic survey data and included fishing vessels engaged in fishing activities. |
iv. Whether these areas contain transit routes used by coastal or deep-draught or international scheduled vessels on passage. | | Section 10: Vessel Traffic Movements Main routes have been identified using the principles set out in MGN 654 in proximity to the Proposed Development array area (see section 11.2), with these routes taking into account coastal, deep-draught and internationally scheduled vessels. |
v. Alignment and proximity of the site relative to adjacent shipping routes. | | Section 7: Navigational Features Section 7.7.1 identifies IMO routeing measures in proximity to the Proposed Development. |
vi. Whether the nearby area contains prescribed routeing schemes or precautionary areas. | | Section 7: Navigational Features Section 7.7.1 identifies IMO routeing measures in proximity to the Proposed Development and sections 7.5 and 7.7 identify precautionary areas such as anchorage military practice and exercise areas and foul and spoil grounds in proximity to the Proposed Development. |
vii. Proximity of the site to areas used for anchorage (charted or uncharted), safe haven, port approaches and pilot boarding or landing areas. | | Section 7: Navigational Features Section 7.4 identifies designated anchorage areas in proximity to the Proposed Development and section 7.2.1 identifies nearby ports. |
viii. Whether the site lies within the jurisdiction of a port and/or navigation authority. | | Section 7: Navigational Features Section 7.2.1 identifies nearby ports and port authority jurisdiction. |
ix. Proximity of the site to existing fishing grounds, or to routes used by fishing vessels to such grounds. | | Section 10: Vessel Traffic Movements Fishing vessel movements are considered within the Proposed Development array area (Section 10.1.2.3) and export cable corridor (Section 10.2.2.2) shipping and navigation study areas. |
x. Proximity of the site to offshore firing/bombing ranges and areas used for any marine military purposes. | | Section 7: Navigational Features Section 7.5 identifies military practice and exercise areas in proximity to the Proposed Development. |
xi. Proximity of the site to existing or proposed submarine cables or pipelines, offshore oil/gas platform, marine aggregate dredging, marine archaeological sites or wrecks, Marine Protected Area or other exploration/exploitation sites. | | Section 7: Navigational Features Section 7.7.6 identifies existing and proposed submarine cables and pipelines in proximity to the Proposed Development, section 7.7.2 identifies oil and gas features in proximity to the Proposed Development, section 7.7.7 identifies marine aggregate dredging areas in proximity to the Proposed Development, section 7.6 identifies charted wrecks in proximity to the Proposed Development and section 7.7.7 identifies MEHRAs in proximity to the Proposed Development. |
xii. Proximity of the site to existing or proposed OREI developments, in cooperation with other relevant developers, within each round of lease awards. | | Section 7: Navigational Features Section 7.1 identifies other offshore wind farm developments in proximity to the Proposed Development. |
xiii. Proximity of the site relative to any designated areas for the disposal of dredging spoil or other disposal grounds. | | Section 7: Navigational Features Section 7.7.4 identifies foul and spoil ground in proximity to the Proposed Development. |
xiv. Proximity of the site to aids to navigation and/or VTS in or adjacent to the area and any impact thereon. | | Section 7: Navigational Features Section 7.3 identifies aids to navigation in proximity to the Proposed Development. |
xv. Researched opinion using computer simulation techniques with respect to the displacement of traffic and, in particular, the creation of “choke points” in areas of high traffic density and nearby or consented OREI sites not yet constructed. | | Section 16: Collision and Allision Risk Modelling Collision and allision risk modelling has been undertaken for the Proposed Development array area. |
xvi. With reference to xv. above, the number and type of incidents to vessels which have taken place in or near to the proposed site of the OREI to assess the likelihood of such events in the future and the potential impact of such a situation. | | Section 9: Emergency Response Historical vessel incident data published by the MAIB (section 9.5), RNLI (section 9.2) and DfT (section 9.1) in proximity to Proposed Development has been considered alongside historical offshore wind farm incident data throughout the UK (section 9.6). |
xvii. Proximity of the site to areas used for recreation which depend on specific features of the area. | | Section 10: Vessel Traffic Movements Non-transit users were identified in the vessel traffic survey data and included limited recreational activity. |
Predicted effect of OREI on traffic and interactive boundaries. Where appropriate, the following should be determined: | ||
a. The safe distance between a shipping route and OREI boundaries. | | Section 15: Future Case Vessel Traffic A methodology for post wind farm routeing is outlined and includes a minimum distance of 1 nm from offshore installations and wind turbine boundaries. |
b. The width of a corridor between sites or OREIs to allow safe passage of shipping. | | Section 19: Cumulative Risk Assessment Section 19.1 provides a justification for the gap between the Proposed Development array area and Inch Cape to ensure its presence does not result in a significant risk to navigational safety. |
OREI structures. The following should be determined: | ||
a. Whether any feature of the OREI, including auxiliary platforms outside the main generator site, mooring and anchoring systems, inter-device and export cabling could pose any type of difficulty or danger to vessels underway, performing normal operations, including fishing anchoring and emergency response. | | Section 16: Collision and Allision Risk Modelling Collision and allision risk modelling has been undertaken for the Proposed Development array area.
Section 18: Project in Isolation Risk Assessment Based upon the baseline data and consultation undertaken hazards have been identified and fed into the risk assessment undertaken in volume 2, chapter 13, including hazards involving anchoring and emergency response. |
b. Clearances of fixed or floating wind turbine blades above the sea surface are not less than 22 m (above MHWS for fixed). Floating wind turbines allow for degrees of motion. | | Section 17: Embedded Mitigation Measures The minimum blade tip height is included in the maximum design scenario for wind turbines (see Table 18.1 Open ▸ ). |
c. Underwater devices: i. Changes to charted depth; ii. Maximum height above seabed; and iii. Under keel clearance. | | Section 6.6: Maximum Design Scenario Inter-array, interconnector and offshore export cables specifications are included in the maximum design scenario for cables (see Table 6.6 Open ▸ ). |
d. Whether structure block or hinder the view of other vessels or other navigational features. | | Section 13: Navigation, Communication and Position Fixing Equipment Hazards relating to the use of existing aids to navigation are considered (see section 0).
Section 19: Cumulative Risk Assessment Risks to non-transit users on vessels navigating through the gap between the Proposed Development array area and Inch Cape (and the detection of such vessels) has been considered (see section 19.1). |
The effects of tides, tidal streams and weather. It should be determined whether: | ||
a. Current maritime traffic flows and operations in the general area are affected by the depth of water in which the proposed installation is situated at various states of the tide, i.e. whether the installation could pose problems at high water which do not exist at low water conditions, and vice versa. | | Section 6.6: Maximum Design Scenario The range of water depths within the Proposed Development array area is provided in the maximum design scenario for the Proposed Development boundary (see Table 6.6 Open ▸ ).
Section 8: Meteorological Ocean Data Various states of the tide local to the Proposed Development are provided.
Section 10: Vessel Traffic Movements Vessel traffic data in proximity to the Proposed Development has been analysed.
Section 16: Collision and Allision Risk Modelling Collision and allision risk models take into account tidal conditions. |
b. The set and rate of the tidal stream, at any state of the tide, has a significant effect on vessels in the area of the OREI site. | | Section 8: Meteorological Ocean Data Various states of the tide local to the Proposed Development are provided.
Section 16: Collision and Allision Risk Modelling The collision and allision risk models take into account tidal conditions. |
c. The maximum rate tidal stream runs parallel to the major axis of the proposed site layout, and, if so, its effect. | | |
d. The set is across the major axis of the layout at any time, and, if so, at what rate. | | |
e. In general, whether engine failure or other circumstance could cause vessels to be set into danger by the tidal stream, including unpowered vessels and small, low speed craft. | | Section 8: Meteorological Ocean Data Various states of the tide local to the Proposed Development are provided and it is noted that hazards are not anticipated at high or low water only.
Section 16: Collision and Allision Risk Modelling The drifting allision risk model takes into account tidal conditions and assesses whether machinery failure could cause vessels to be set into danger. |
f. The structures themselves could cause changes in the set and rate of the tidal stream. | | Section 8: Meteorological Ocean Data No risks are anticipated. |
g. The structures in the tidal stream could be such as to produce siltation, deposition of sediment or scouring, affecting navigable water depths in the wind farm area or adjacent to the area. | | Section 19: Cumulative Risk Assessment Identifies the hazards due to the Proposed Development on shipping and navigation for each phase including in relation to changes in under keel clearance. |
h. The site, in normal, bad weather, or restricted visibility conditions, could present difficulties or dangers to craft, including sailing vessels, which might pass in close proximity to it. | | Section 8: Meteorological Ocean Data Weather and visibility data local to the Proposed Development is provided.
Section 10: Vessel Traffic Movements Vessel traffic data in proximity to the Proposed Development has been analysed including recreational vessels.
Section 11: Adverse Weather Vessel Traffic Movements Alternative routeing used by Regular Operators during periods of adverse weather have been identified.
Section 19: Cumulative Risk Assessment Based upon the baseline data and consultation undertaken hazards have been identified and fed into the risk assessment undertaken in volume 2, chapter 13 which is summarised in section 18. |
i. The structures could create problems in the area for vessels under sail, such as wind masking, turbulence or sheer. | | Section 19: Cumulative Risk Assessment Based upon the baseline data and consultation undertaken hazards have been identified and fed into the risk assessment undertaken in volume 2, chapter 13. |
j. In general, taking into account the prevailing winds for the area, whether engine failure or other circumstances could cause vessels to drift into danger, particularly if in conjunction with a tidal set such as referred to above. | | Section 16: Collision and Allision Risk Modelling The drifting allision risk model takes into account weather and tidal conditions and assesses whether machinery failure could cause vessels to be set into danger. |
Assessment of access to and navigation within, or close to, an OREI. To determine the extent to which navigation would be feasible within the OREI site itself by assessing whether: | ||
a. Navigation within or close to the site would be safe: | ||
i. For all vessels. | | Section 4: Consultation Section 4.2 outlines Regular Operator consultation undertaken following the vessel traffic surveys.
Section 11: Adverse Weather Vessel Traffic Movements Alternative routeing used by Regular Operators during periods of adverse weather have been identified.
Section 16: Collision and Allision Risk Modelling Collision and allision risk modelling has been undertaken for the Proposed Development array area and includes use of post wind farm routeing, as well as taking account of tidal and weather conditions.
Section 19: Cumulative Risk Assessment Based upon the baseline data and consultation undertaken hazards have been identified and fed into the risk assessment undertaken in volume 2, chapter 13. |
ii. For specified vessel types, operations and/or sizes. | | |
iii. In all directions or areas. | | |
iv. In specified directions or areas. | | |
v. In specified tidal, weather or other conditions. | | |
b. Navigation in and/or near the site should be prohibited or restricted: | ||
i. For specified vessel types, operations and/or sizes. | | Section 13: Navigation, Communication and Position Fixing Equipment Potential hazards on navigation of the different communications and position fixing devices used in and around offshore wind farms are assessed.
Section 16: Collision and Allision Risk Modelling Collision and allision risk modelling has been undertaken for the Proposed Development array area and includes use of post wind farm routeing which assumes commercial vessel traffic avoids the Proposed Development array area.
Section 19: Cumulative Risk Assessment Based upon the baseline data and consultation undertaken hazards have been identified and fed into the risk assessment undertaken in volume 2, chapter 13.
Section 17: Embedded Mitigation Measures Outlines the embedded mitigation measures to be implemented to reduce the significance of risk of shipping and navigation hazards including the application for Safety Zones. |
ii. In respect of specific activities. | | |
iii. In all areas or directions. | | |
iv. Prohibited in specified areas or directions. | | |
v. In specified tidal or whether conditions. | | |
c. Where it is not feasible for vessels to access or navigate through the site it could cause navigational, safety or routeing problems for vessels operating in the area e.g. by preventing vessels from responding to calls for assistance from persons in distress. | | Section 16: Collision and Allision Risk Modelling Collision and allision risk modelling has been undertaken for the Proposed Development array area and includes use of post wind farm routeing which assumes commercial vessel traffic avoids the array.
Section 19: Cumulative Risk Assessment Based upon the baseline data and consultation undertaken hazards have been identified and fed into the risk assessment undertaken in volume 2, chapter 13. |
d. Guidance on the calculation of safe distance of OREI boundaries from shipping routes has been considered. | | Section 15: Future Case Vessel Traffic The methodology applied when considering the safe distance at which main routes should be deviated around offshore installations has been described and includes consideration of the Shipping Route Template (see section 15.5.1). |
SAR, maritime assistance service, counter pollution and salvage incident response. | ||
The MCA, through HM Coastguard, is required to provide SAR and emergency response within the sea area occupied by all OREIs in UK waters. To ensure that such operations can be safely and effectively conducted, certain requirements must be met by developers and operators. | ||
a. An ERCoP will be developed for the construction, operation and decommissioning phases of the OREI. | | Section 17: Embedded Mitigation Measures Embedded mitigation measures have been proposed and are summarised in section 17 including compliance with MGN 654, which requires the creation of an ERCoP. |
b. The MCA’s guidance document Offshore Renewable Energy Installations: Requirements, Guidance and Operational Considerations for Search and Rescue and Emergency Response (MCA, 2021) for the design, equipment and operation requirements will be followed. | | Section 17: Embedded Mitigation Measures Embedded mitigation measures have been proposed and are summarised in section 17 including compliance with MGN 654, which requires the fulfilment of requirements in the stated guidance document. |
c. A SAR checklist will be completed to record discussions regarding the requirements, recommendations and considerations outlined in Annex 5 (to be agreed with MCA). | | Section 17: Embedded Mitigation Measures Embedded mitigation measures have been proposed and are summarised in section 17 including compliance with MGN 654, which expects the SAR checklist to be completed. |
Hydrography. In order to establish a baseline, confirm the safe navigable depth, monitor seabed mobility and to identify underwater hazards, detailed and accurate hydrographic surveys are included or acknowledged for the following stages and to MCA specifications: | ||
i. Pre-construction: The proposed generating assets area and proposed cable route. | | Section 17: Embedded Mitigation Measures Embedded mitigation measures have been proposed and are summarised in section 17 including compliance with MGN 654, which requires the specified hydrographic surveys to be completed. |
ii. On a pre-established periodicity during the life of the development. | | |
iii. Post construction: Cable route(s). | | |
iv. Post decommissioning of all or part of the development: the installed generating assets area and cable route. | | |
Communications, Radar and positioning systems. To provide researched opinion of a generic and, where appropriate, site specific nature concerning whether: | ||
a. The structures could produce radio interference such as shadowing, reflections or phase changes, and emissions with respect to any frequencies used for marine positioning, navigation and timing (PNT) or communications, including GMDSS and AIS, whether ship borne ashore or fitted to any of the proposed structures, to: | ||
i. Vessels operating at a safe navigational distance. | | Section 13: Navigation, Communication and Position Fixing Equipment Potential hazards on navigation of the different communications and position fixing devices used in and around offshore wind farms are assessed. |
ii. Vessels by the nature of their work necessarily operating at less than the safe navigational distance to the OREI, e.g. support vessels, survey vessels, SAR assets. | | |
iii. Vessels by the nature of their work necessarily operating within the OREI. | | |
b. The structures could produce radar reflections, blind spots, shadow areas or other adverse effects: | ||
i. Vessel to vessel | | Section 13: Navigation, Communication and Position Fixing Equipment Potential hazards on navigation of the different communications and position fixing devices used in and around offshore wind farms are assessed. |
ii. Vessel to shore | | |
iii. VTS radar to vessel | | |
iv. Racon to/from vessel | | |
c. The structures and generators might produce SONAR interference affecting fishing, industrial or military systems used in the area. | | Section 13: Navigation, Communication and Position Fixing Equipment Section 13.9 assesses the potential risk of SONAR interference due to the Proposed Development. |
d. The site might produce acoustic noise which could mask prescribed sound signals. | | Section 13: Navigation, Communication and Position Fixing Equipment Section 13.10 assesses the potential risk of noise due to the Proposed Development. |
e. Generators and the seabed cabling within the site onshore might produce EMFs affecting compasses and other navigation systems. | | Section 13: Navigation, Communication and Position Fixing Equipment Section 13.6 assesses the potential risk of electromagnetic interference due to the Proposed Development. |
Risk mitigation measures recommended for OREI during construction, operation and decommissioning. | ||
Mitigation and safety measures will be applied to the OREI development appropriate to the level and type of risk determined during the EIA. The specific measures to be employed will be selected in consultation with the MCA and will be listed in the developer’s ES. These will be consistent with international standards contained in, for example, Chapter V of SOLAS (IMO, 1974), and could include any or all of the following: | ||
i. Promulgation of information and warnings through notices to mariners and other appropriate MSI dissemination methods. | | Section 17: Embedded Mitigation Measures Embedded mitigation measures have been proposed and are summarised in section 17 including the promulgation of information. |
ii. Continuous watch by multi-channel VHF, including DSC. | | Section 17: Embedded Mitigation Measures Embedded mitigation measures have been proposed and are summarised in section 17 including marine coordination. |
iii. Safety Zones of appropriate configuration, extent and application to specified vessels[14]. | | Section 17: Embedded Mitigation Measures Embedded mitigation measures have been proposed and are summarised in section 17 including use of Safety Zones. |
iv. Designation of the site as an area to be avoided (ATBA) | | Section 6: Project Design Envelope Relevant to Shipping and Navigation It is not planned to designate the Proposed Development array area as an ATBA (see section 6.1.1). |
v. Provision of aids to navigation as determined by the GLA. | | Section 17: Embedded Mitigation Measures Embedded mitigation measures have been proposed and are summarised in section 17 including the provision of aids to navigation in accordance with Trinity House and MCA requirements. |
vi. Implementation of routeing measures within or near to the development. | | It is not planned to implement any new routeing measures within or near to the Proposed Development. |
vii. Monitoring by radar, AIS, Closed Circuit Television (CCTV) or other agreed means. | | Section 17: Embedded Mitigation Measures As required under MGN 654 (MCA, 2021) the Project will agree suitable site mitigation with the MCA. |
viii. Appropriate means for OREI operators to notify, and provide evidence of, the infringement of Safety Zones. | | Means for notifying and providing evidence of the infringement of Safety Zones will be provided in the Safety Zone Application, submitted post consent. |
ix. Creation of an ERCoP with the MCA’s SAR branch for the construction phase onwards. | | Section 17: Embedded Mitigation Measures Embedded mitigation measures have been proposed and are summarised in section 17 including compliance with MGN 654, which requires the creation of an ERCoP. |
x. Use of guard vessels, where appropriate. | | Section 17: Embedded Mitigation Measures Embedded mitigation measures have been proposed and are summarised in section 17 including the use of guard vessels. |
xi. Update NRAs every two years, e.g. at testing sites. | | Not applicable to the Proposed Development. |
xii. Device-specific or array-specific NRAs. | | Section 6.6: Maximum Design Scenario All offshore elements of the Proposed Development have been considered in this NRA including array area and export cable corridor (surface and subsea) infrastructure.
Section 17: Embedded Mitigation Measures Embedded mitigation measures have been proposed and are summarised in section 17 including a Cable Specification and Installation Plan undertaken prior to construction which will serve as additional assessment relating to shipping and navigation. |
xiii. Design of OREI structures to minimise risk to contacting vessels or craft. | | There is no additional risk posed to craft compared to previous offshore wind farms and so no additional measures are identified. |
xiv. Any other measures and procedures considered appropriate in consultation with other stakeholders. | | Section 17: Embedded Mitigation Measures Embedded mitigation measures have been proposed and are summarised in section 17. |
Table A.2 MGN 654 Annex 1 checklist
Item | Compliance | Comments |
|---|---|---|
A risk claim is included that is supported by a reasoned argument and evidence. | | The risk assessment undertaken in volume 2, chapter 13 provides a risk claim for a range of hazards identified in this NRA which is based on a number of inputs including (but not limited to) baseline data, expert opinion, outputs of the Hazard Workshop, stakeholder concerns and lessons learnt from existing offshore developments. |
Description of the marine environment. | | Section 7: Navigational Features Relevant navigational features in proximity to the Proposed Development have been described including (but not limited to) other offshore wind farm developments, oil and gas features, aids to navigation, submarine cables and pipelines, charted wrecks, IMO routeing measures, ports and MEHRAs.
Section 14: Cumulative and Transboundary Overview Potential future developments have been screened in to the cumulative risk assessment where a cumulative or in combination activity has been identified based upon the location and distance from the Proposed Development, including consideration of other offshore wind farms, oil and gas infrastructure and carbon capture infrastructure (surface piercing). Potential future developments have also been screened into the cumulative risk assessment where a concern has been raised during consultation. |
SAR overview and assessment. | | Section 9: Emergency Response Existing SAR resources in the outer Firth of Forth are summarised including the UK SAR operations contract, RNLI stations and assets and HMCG stations. The risk assessment undertaken in volume 2, chapter 13 includes an assessment of how activities associated with the Proposed Development may restrict emergency response capability of existing resources. |
Description of the OREI development and how it changes the marine environment. | | Section 6.6: Maximum Design Scenario The maximum extent of the Proposed Development for which any shipping and navigation hazards are assessed is provided including a description of the development boundaries, array area and export cable corridor infrastructure, construction phase programme and indicative vessel and helicopter numbers during the construction and operation and maintenance phases.
Section 15: Future Case Vessel Traffic Worst-case alternative routeing for commercial traffic has been considered. |
Analysis of the vessel traffic, including base case and future traffic densities and types. | | Section 10: Vessel Traffic Movements Vessel traffic data in proximity to the Proposed Development has been analysed.
Section 15: Future Case Vessel Traffic Future vessel traffic levels have been considered, broken down as increases in traffic associated with ports, commercial fishing vessel activity, recreational vessel activity and traffic associated with the Proposed Development operations. Additionally, worst case alternative routeing for commercial traffic has been considered. |
Status of the hazard log:
| | Section 3: Navigational Risk Assessment Methodology A tolerability matrix has been defined to determine the tolerability/significance of risks (see section 3.2.1).
Appendix B: Hazard Log The complete hazard log is presented and includes a description of the hazards considered, possible causes, consequences (most likely and worst case) and relevant embedded mitigation measures. Using this information, each hazard is then ranked in terms of frequency of occurrence and severity of consequence to give a tolerability/significance level. |
NRA:
| | Section 2: Guidance and Legislation MGN 654 and the IMO’s FSA guidelines are the primary guidance documents used during the assessment with MGN 372 also used.
Section 16: Collision and Allision Risk Modelling Collision and allision risk modelling has been undertaken for the Proposed Development array area with the results outlined numerically and graphically (where appropriate). |
Risk control log | | Section 17: Embedded Mitigation Measures Embedded mitigation measures have been proposed and are summarised in section 17. The risk assessment undertaken in volume 2, chapter 13 outlines the relevant embedded mitigation measures for each risk assessed. |
Appendix B Hazard Log
Appendix B Hazard Log
The complete hazard log, created following the first Hazard Workshop and updated following the second Hazard Workshop, is presented in Table B.1.
Table B.1 Hazard Log
Hazard ID | Hazard Type | Hazard Title | Phase (C/O/D) | Embedded Mitigation | Possible Causes | Most Likely Consequences | Realistic Most Likely Consequences | Worst Case Consequences | Realistic Worst Case Consequences | Further Mitigation and Additional Comments | |||||||||||||
|---|---|---|---|---|---|---|---|---|---|---|---|---|---|---|---|---|---|---|---|---|---|---|---|
Consequences | Risk | Consequences | Risk | ||||||||||||||||||||
Commercial Vessels (Including Cargo, Tanker, Passenger and Oil and Gas) | |||||||||||||||||||||||
C1 | Displacement | Commercial vessels may be displaced from their historical standard routes due to construction activities associated with the Proposed Development | C/D |
|
| Increased encounters involving commercial vessels that do not impact on compliance with the COLREGs but result in increased journey time/distance impacting on schedules | 5 | 1 | 2 | 1 | 3 | 1.8 | Tolerable | Increased encounters involving commercial vessels and impacts on compliance with COLREGs and resulting in increased journey time/distance, impacting on schedules | 3 | 3 | 3 | 3 | 4 | 3.3 | Tolerable |
| |
C2 | Displacement | Commercial vessels may be displaced from their existing adverse weather routes due to construction activities associated with the Proposed Development | C/D |
|
| Commercial vessel is able to identify a suitable alternative route in adverse weather | 4 | 1 | 1 | 1 | 1 | 1.0 | Broadly Acceptable | Commercial vessel is unable to identify a suitable alternative route in adverse weather resulting in an unsafe passage or the passage not being made at all with subsequent impacts on schedules | 1 | 4 | 3 | 4 | 4 | 3.8 | Broadly Acceptable |
| |
C3 | Collision risk | The presence of project vessels during construction may increase the likelihood of vessel to vessel encounters and subsequently increase the collision risk between commercial vessels and project vessels | C/D |
|
| Increased encounters involving commercial vessels and project vessels that do not impact on compliance with the COLREGs | 4 | 1 | 1 | 1 | 1 | 1.0 | Broadly Acceptable | Increased encounters involving commercial vessels and project vessels that impact on compliance with COLREGs and result in collisions | 1 | 4 | 4 | 4 | 4 | 4.0 | Broadly Acceptable |
| |
C4 | Collision risk | Displaced vessels may lead to increased traffic densities in certain areas and a subsequent increase in collision risk for commercial vessels | C/D |
|
| Increased encounters involving commercial vessels that do not impact on compliance with the COLREGs | 5 | 1 | 1 | 1 | 1 | 1.0 | Tolerable | Increased encounters involving commercial vessels that impact on compliance with COLREGs and result in collisions | 1 | 4 | 4 | 4 | 4 | 4.0 | Broadly Acceptable |
| |
C5 | Allision risk | Partially complete and completed structures within the Proposed Development array area could create an allision risk (powered or drifting) to passing commercial traffic | C/D |
|
| Commercial vessel passes structure at unsafe distance and has to make late adjustment to course/speed | 4 | 1 | 1 | 1 | 1 | 1.0 | Broadly Acceptable | Commercial vessel allides with structure resulting in vessel damage, injury and potentially pollution | 2 | 4 | 4 | 4 | 4 | 4.0 | Tolerable |
| |
C6 | Port access | Access to local ports for commercial vessels may be impacted due to construction/ decommissioning activities associated with the Proposed Development | C/D |
|
| Increased journey time/distance but does not impact on schedules | 4 | 1 | 1 | 1 | 1 | 1.0 | Broadly Acceptable | Increased journey time/distance impacting on schedules | 2 | 1 | 1 | 1 | 3 | 1.5 | Broadly Acceptable | Details of additional rig movements in the area have been requested by UK Chamber of Shipping. | |
C7 | Displacement | Commercial vessels may be displaced from their existing standard routes due to the presence of the Proposed Development | O |
|
| Increased encounters involving commercial vessels that do not impact on compliance with the COLREGs but result in increased journey time/distance impacting on schedules | 5 | 1 | 2 | 1 | 3 | 1.8 | Tolerable | Increased encounters involving commercial vessels and impacts on compliance with COLREGs and resulting in increased journey time/distance impacting on schedules | 3 | 3 | 3 | 3 | 4 | 3.3 | Tolerable |
| |
C8 | Displacement | Commercial vessels may be displaced from their existing adverse weather routes due to the presence of the Proposed Development | O |
|
| Commercial vessel is able to identify a suitable alternative route in adverse weather | 4 | 1 | 1 | 1 | 1 | 1.0 | Broadly Acceptable | Commercial vessel is unable to identify a suitable alternative route in adverse weather resulting in an unsafe passage or the passage not being made at all with subsequent impacts on schedules | 1 | 4 | 3 | 4 | 4 | 3.8 | Broadly Acceptable |
| |
C9 | Collision risk | The presence of project vessels during operation may increase the likelihood of vessel to vessel encounters and subsequently increase the collision risk between third-party commercial vessels and project vessels | O |
|
| Increased encounters involving commercial vessels and project vessels that do not impact on compliance with the COLREGs | 4 | 1 | 1 | 1 | 1 | 1.0 | Broadly Acceptable | Increased encounters involving commercial vessels and project vessels that impact on compliance with COLREGs and result in collisions | 1 | 4 | 4 | 4 | 4 | 4.0 | Broadly Acceptable |
| |
C10 | Collision risk | Displaced vessels may lead to increased traffic densities in certain areas and a subsequent increase in collision risk for commercial vessels | O |
|
| Increased encounters involving commercial vessels that do not impact on compliance with the COLREGs | 5 | 1 | 1 | 1 | 1 | 1.0 | Tolerable | Increased encounters involving commercial vessels that impact on compliance with COLREGs and result in collisions | 1 | 4 | 4 | 4 | 4 | 4.0 | Broadly Acceptable |
| |
C11 | Allision risk | Structures within the Proposed Development array area could create an allision risk (powered or drifting) to passing commercial traffic | O |
|
| Commercial vessel passes structure at unsafe distance and has to make late adjustment to course/speed | 5 | 1 | 1 | 1 | 1 | 1.0 | Tolerable | Commercial vessel allides with structure resulting in vessel damage, injury and potentially pollution | 3 | 4 | 4 | 4 | 4 | 4.0 | Tolerable |
| |
C12 | Port access | Access to local ports for commercial vessels may be impacted due to operation activities associated with the Proposed Development | O |
|
| Increased journey time/distance but does not impact on schedules | 4 | 1 | 1 | 1 | 1 | 1.0 | Broadly Acceptable | Increased journey time/distance impacting on schedules | 2 | 1 | 1 | 1 | 3 | 1.5 | Broadly Acceptable | Details of additional rig movements in the area have been requested by UK Chamber of Shipping. | |
C13 | Anchor interaction | The presence of subsea cables associated with the Proposed Development may increase the likelihood of anchor interaction for commercial vessels including a snagging risk | O |
|
| Commercial vessel anchors on or drags anchor over an installed cable/protection but no interaction occurs | 1 | 1 | 1 | 1 | 1 | 1.0 | Broadly Acceptable | Commercial vessel anchors on or drags anchor over an installed cable/protection resulting in damage to the cable/protection and/or anchor | 1 | 1 | 1 | 2 | 2 | 1.5 | Broadly Acceptable |
| |
C1 | Displacement | Commercial vessels may be displaced from their historical standard routes due to construction activities associated with the Proposed Development | C/D |
|
| Increased encounters involving commercial vessels that do not impact on compliance with the COLREGs but result in increased journey time/distance impacting on schedules | 5 | 1 | 2 | 1 | 3 | 1.8 | Tolerable | Increased encounters involving commercial vessels and impacts on compliance with COLREGs and resulting in increased journey time/distance, impacting on schedules | 3 | 3 | 3 | 3 | 4 | 3.3 | Tolerable |
| |
Commercial Fishing Vessels (in Transit) | |||||||||||||||||||||||
F1 | Displacement | Commercial fishing vessels may be displaced from their historical routes due to construction activities associated with the Proposed Development | C/D |
|
| Increased encounters involving commercial fishing vessels that do not impact on compliance with the COLREGs but result in increased journey time/distance impacting on schedules | 4 | 1 | 2 | 1 | 2 | 1.5 | Broadly Acceptable | Increased encounters involving commercial fishing vessels and impacts on compliance with COLREGs and resulting in increased journey time/distance impacting on schedules | 2 | 3 | 2 | 2 | 3 | 2.5 | Broadly Acceptable |
| |
F2 | Collision risk | The presence of project vessels during construction may increase the likelihood of vessel to vessel encounters and subsequently increase the collision risk between commercial fishing vessels and project vessels | C/D |
|
| Increased encounters involving commercial fishing vessels and project vessels that do not impact on compliance with the COLREGs | 4 | 1 | 1 | 1 | 1 | 1.0 | Broadly Acceptable | Increased encounters involving commercial fishing vessels and project vessels that impact on compliance with COLREGs and result in collisions | 2 | 4 | 3 | 3 | 3 | 3.3 | Broadly Acceptable | Project activities may coincide with most active commercial fishing vessel periods since winter is a less attractive time for both vessel types to be active | |
F3 | Collision risk | Displaced vessels may lead to increased traffic densities in certain areas and a subsequent increase in collision risk for commercial fishing vessels | C/D |
|
| Increased encounters involving commercial fishing vessels that do not impact on compliance with the COLREGs | 5 | 1 | 1 | 1 | 1 | 1.0 | Tolerable | Increased encounters involving commercial fishing vessels that impact on compliance with COLREGs and result in collisions | 2 | 4 | 3 | 3 | 3 | 3.3 | Broadly Acceptable | Displacement of commercial vessels into fishing grounds (particularly at night) may result in increased collision risk for commercial fishing vessels. However, the reduction in the array area has increased available sea room which will reduce resulting displacement and subsequent collision risk. | |
F4 | Allision risk | Partially complete and completed structures within the Proposed Development array area could create an allision risk (powered or drifting) to passing commercial fishing traffic | C/D |
|
| Commercial fishing vessel passes structure at unsafe distance and has to make late adjustment to course/speed | 4 | 1 | 1 | 1 | 1 | 1.0 | Broadly Acceptable | Commercial fishing vessel allides with structure resulting in vessel damage, injury and potentially pollution | 2 | 4 | 3 | 4 | 3 | 3.5 | Broadly Acceptable |
| |
F5 | Port access | Access to local ports for commercial fishing vessels may be impacted due to construction/ decommissioning activities associated with the Proposed Development | C/D |
|
| Increased journey time/distance but does not impact on schedules | 4 | 1 | 1 | 1 | 1 | 1.0 | Broadly Acceptable | Increased journey time/distance impacting on schedules | 1 | 1 | 1 | 1 | 2 | 1.3 | Broadly Acceptable |
| |
F6 | Displacement | Commercial fishing vessels may be displaced from their existing standard routes due to the presence of the Proposed Development | O |
|
| Increased encounters involving commercial fishing vessels that do not impact on compliance with the COLREGs but result in increased journey time/distance impacting on schedules | 3 | 1 | 2 | 1 | 2 | 1.5 | Broadly Acceptable | Increased encounters involving commercial fishing vessels and impacts on compliance with COLREGs and resulting in increased journey time/distance impacting on schedules | 2 | 3 | 2 | 2 | 3 | 2.5 | Broadly Acceptable | Given swell in waves in winter, it will not be possible for fishing vessels to transit through the array during adverse | |
F7 | Collision risk | The presence of project vessels during operation may increase the likelihood of vessel to vessel encounters and subsequently increase the collision risk between third-party commercial fishing vessels and project vessels | O |
|
| Increased encounters involving commercial fishing vessels and project vessels that do not impact on compliance with the COLREGs | 4 | 1 | 1 | 1 | 1 | 1.0 | Broadly Acceptable | Increased encounters involving commercial fishing vessels and project vessels that impact on compliance with COLREGs and result in collisions | 2 | 4 | 3 | 3 | 3 | 3.3 | Broadly Acceptable | Project activities may coincide with most active commercial fishing vessel periods since winter is a less attractive time for both vessel types to be active | |
F8 | Collision risk | Displaced vessels may lead to increased traffic densities in certain areas and a subsequent increase in collision risk for commercial fishing vessels | O |
|
| Increased encounters involving commercial fishing vessels that do not impact on compliance with the COLREGs | 5 | 1 | 1 | 1 | 1 | 1.0 | Tolerable | Increased encounters involving commercial fishing vessels that impact on compliance with COLREGs and result in collisions | 2 | 4 | 3 | 3 | 3 | 3.3 | Broadly Acceptable | Displacement of commercial vessels into fishing grounds (particularly at night) may result in increased collision risk for commercial fishing vessels. However, the reduction in the array area has increased available sea room which will reduce resulting displacement and subsequent collision risk. | |
F9 | Allision risk | Structures within the Proposed Development array area could create an allision risk (powered or drifting) to passing commercial fishing traffic | O |
|
| Commercial fishing vessel passes structure at unsafe distance (including internally within array) and has to make late adjustment to course/speed | 5 | 1 | 1 | 1 | 1 | 1.0 | Tolerable | Commercial fishing vessel allides with structure (including while internally within array) resulting in vessel damage, injury and potentially pollution | 3 | 4 | 3 | 4 | 3 | 3.5 | Tolerable | Concerns raised relating to internal navigation for fishing vessels in adverse weather given the minimum spacing. This will be assessed as part of allision risk in the NRA noting that the minimum spacing is unchanged from that presented in the first Hazard Workshop. | |
F10 | Port access | Access to local ports for commercial fishing vessels may be impacted due to operation activities associated with the Proposed Development | O |
|
| Increased journey time/distance but does not impact on schedules | 4 | 1 | 1 | 1 | 1 | 1.0 | Broadly Acceptable | Increased journey time/distance impacting on schedules | 1 | 1 | 1 | 1 | 2 | 1.3 | Broadly Acceptable |
| |
F11 | Anchor interaction | The presence of subsea cables associated with the Proposed Development may increase the likelihood of anchor interaction for commercial fishing vessels including a snagging risk | O |
|
| Commercial fishing vessel anchors on or drags anchor over an installed cable/protection but no interaction occurs | 2 | 1 | 1 | 1 | 1 | 1.0 | Broadly Acceptable | Commercial fishing vessel anchors on or drags anchor over an installed cable/protection resulting in damage to the cable/protection and/or anchor | 1 | 1 | 1 | 2 | 2 | 1.5 | Broadly Acceptable | Snagging risk associated with commercial fishing gear will be assessed separately outside the scope of the NRA | |
Recreational Vessels (2.5 to 24 m LOA) | |||||||||||||||||||||||
R1 | Displacement | Recreational vessels may be displaced from their historical cruising routes due to construction activities associated with the Proposed Development | C/D |
|
| Increased encounters involving recreational vessels that do not impact on compliance with the COLREGs but result in increased journey time/distance impacting on schedules | 4 | 1 | 1 | 1 | 2 | 1.3 | Broadly Acceptable | Increased encounters involving recreational vessels and impacts on compliance with COLREGs and resulting in increased journey time/distance impacting on schedules | 2 | 3 | 2 | 2 | 3 | 2.5 | Broadly Acceptable | Continental recreational vessels are less likely to be familiar with the Proposed Development and therefore are more likely to transit through the array | |
R2 | Collision risk | The presence of project vessels during construction may increase the likelihood of vessel to vessel encounters and subsequently increase the collision risk between recreational vessels and project vessels | C/D |
|
| Increased encounters involving recreational vessels and project vessels that do not impact on compliance with the COLREGs | 4 | 1 | 1 | 1 | 1 | 1.0 | Broadly Acceptable | Increased encounters involving recreational vessels and project vessels that impact on compliance with COLREGs and result in collisions | 1 | 4 | 2 | 3 | 2 | 2.8 | Broadly Acceptable |
| |
R3 | Collision risk | Displaced vessels may lead to increased traffic densities in certain areas and a subsequent increase in collision risk for recreational vessels | C/D |
|
| Increased encounters involving recreational vessels that do not impact on compliance with the COLREGs | 5 | 1 | 1 | 1 | 1 | 1.0 | Tolerable | Increased encounters involving recreational vessels that impact on compliance with COLREGs and result in collisions | 1 | 4 | 2 | 3 | 2 | 2.8 | Broadly Acceptable |
| |
R4 | Allision risk | Partially complete and completed structures within the Proposed Development array area could create an allision risk (powered or drifting) to passing recreational traffic | C/D |
|
| Recreational vessel passes structure at unsafe distance and has to make late adjustment to course/speed | 4 | 1 | 1 | 1 | 1 | 1.0 | Broadly Acceptable | Recreational vessel allides with structure resulting in vessel damage, injury and potentially pollution | 2 | 4 | 2 | 3 | 2 | 2.8 | Broadly Acceptable | Continental recreational vessels are less likely to be familiar with the Proposed Development and therefore are more likely to transit through the array | |
R5 | Port access | Access to local ports for recreational vessels may be impacted due to construction/ decommissioning activities associated with the Proposed Development | C/D |
|
| Increased journey time/distance but does not impact on schedules | 4 | 1 | 1 | 1 | 1 | 1.0 | Broadly Acceptable | Increased journey time/distance impacting on schedules | 1 | 1 | 1 | 1 | 1 | 1.0 | Broadly Acceptable |
| |
R6 | Displacement | Recreational vessels may be displaced from their existing cruising routes due to the presence of the Proposed Development | O |
|
| Increased encounters involving recreational vessels that do not impact on compliance with the COLREGs but result in increased journey time/distance impacting on schedules | 3 | 1 | 1 | 1 | 2 | 1.3 | Broadly Acceptable | Increased encounters involving recreational vessels and impacts on compliance with COLREGs and resulting in increased journey time/distance impacting on schedules | 2 | 3 | 2 | 2 | 2 | 2.3 | Broadly Acceptable | Continental recreational vessels are less likely to be familiar with the Proposed Development and therefore are more likely to transit through the array | |
R7 | Collision risk | The presence of project vessels during operation may increase the likelihood of vessel to vessel encounters and subsequently increase the collision risk between recreational vessels and project vessels | O |
|
| Increased encounters involving recreational vessels and project vessels that do not impact on compliance with the COLREGs | 4 | 1 | 1 | 1 | 1 | 1.0 | Broadly Acceptable | Increased encounters involving recreational vessels and project vessels that impact on compliance with COLREGs and result in collisions | 1 | 4 | 2 | 3 | 2 | 2.8 | Broadly Acceptable |
| |
R8 | Collision risk | Displaced vessels may lead to increased traffic densities in certain areas and a subsequent increase in collision risk for recreational vessels | O |
|
| Increased encounters involving recreational vessels that do not impact on compliance with the COLREGs | 5 | 1 | 1 | 1 | 1 | 1.0 | Tolerable | Increased encounters involving recreational vessels that impact on compliance with COLREGs and result in collisions | 1 | 4 | 2 | 3 | 2 | 2.8 | Broadly Acceptable |
| |
R9 | Allision risk | Structures within the Proposed Development array area could create an allision risk (powered or drifting) to recreational traffic | O |
|
| Recreational vessel passes structure at unsafe distance (including internally within array) and has to make late adjustment to course/speed | 5 | 1 | 1 | 1 | 1 | 1.0 | Tolerable | Recreational vessel allides with structure (including while internally within array) resulting in vessel damage, injury and potentially pollution | 3 | 4 | 2 | 4 | 2 | 3.0 | Tolerable | Continental recreational vessels are less likely to be familiar with the Proposed Development and therefore are more likely to transit through the array | |
R10 | Port access | Access to local ports for recreational vessels may be impacted due to operation activities associated with the Proposed Development | O |
|
| Increased journey time/distance but does not impact on schedules | 4 | 1 | 1 | 1 | 1 | 1.0 | Broadly Acceptable | Increased journey time/distance impacting on schedules | 1 | 1 | 1 | 1 | 2 | 1.3 | Broadly Acceptable |
| |
R11 | Anchor interaction | The presence of subsea cables associated with the Proposed Development may increase the likelihood of anchor interaction for recreational vessels including a snagging risk | O |
|
| Recreational vessel anchors on or drags anchor over an installed cable/protection but no interaction occurs | 2 | 1 | 1 | 1 | 1 | 1.0 | Broadly Acceptable | Recreational vessel anchors on or drags anchor over an installed cable/protection resulting in damage to the cable/protection and/or anchor | 1 | 1 | 1 | 2 | 1 | 1.3 | Broadly Acceptable | Snagging risk associated with commercial fishing gear will be assessed separately outside the scope of the NRA | |
All Vessels | |||||||||||||||||||||||
A1 | Under keel clearance | The implementation of cable protection to cables associated with the Proposed Development may reduce water depths in proximity and therefore reduce the under keel clearance for all vessels | O |
|
| Vessel transits over an area of reduced clearance causing vibration etc. but does not make contact | 5 | 1 | 1 | 1 | 1 | 1.0 | Tolerable | Vessel makes contact with cable protection resulting in damage to the vessel, injury and potentially pollution | 2 | 3 | 4 | 3 | 3 | 3.3 | Broadly Acceptable |
| |
A2 | Interference with navigational equipment | Communication and position fixing equipment may be affected by the presence of installations within the Proposed Development array area or export cable corridor | O | None |
| Installations have no effect upon the radar, communications and navigation equipment on a vessel | 5 | 1 | 1 | 1 | 1 | 1.0 | Tolerable | Minor level of radar interference due to the installations | 3 | 1 | 1 | 1 | 2 | 1.3 | Broadly Acceptable |
| |
A3 | Use of aids to navigation | The presence of structures associated with the Proposed Development may prevent or limit the use of existing aids to navigation | O |
|
| Short-term inability to utilise an aid to navigation but no effect on the vessel's transit | 4 | 1 | 1 | 1 | 1 | 1.0 | Broadly Acceptable | Short-term inability to utilise an aid to navigation (such as Bell Rock) resulting in an allision or grounding incident with damage to vessel, injury and potentially pollution | 2 | 4 | 4 | 4 | 4 | 4.0 | Tolerable |
| |
Emergency Responders | |||||||||||||||||||||||
E1 | Emergency response capability | The presence of the Proposed Development will increase the number of vessels in the area which may result in an increased number of incidents requiring emergency response and may reduce access for SAR responders | C/O/D |
|
| Delay to response request | 2 | 1 | 1 | 1 | 2 | 1.3 | Broadly Acceptable | Delay to response request leading to loss of life | 1 | 5 | 5 | 5 | 5 | 5.0 | Tolerable |
| |
Cumulative – All Vessel Types | |||||||||||||||||||||||
Cumul1 | Cumulative displacement leading to increased encounters and collision risk | Vessels may be displaced from their existing standard routes/operational areas due to construction activities associated with the Proposed Development and other offshore developments in the area | C/D |
|
| Increased encounters that do not impact on compliance with the COLREGs but result in increased journey time/distance impacting on schedules/routine | 5 | 1 | 3 | 1 | 4 | 2.3 | Tolerable | Increased encounters involving vessels and impacts on compliance with COLREGs and resulting in increased journey time/distance impacting on schedules/routine | 3 | 4 | 4 | 4 | 4 | 4.0 | Tolerable | Questions raised over potential for 'crossroads' to be created by traffic passing in different directions in the same sea area. This will be cumulatively assessed in the NRA.
The potential for potting activity within the gap between the Proposed Development array area and Seagreen 1 was raised. This will be assessed in liaison with the commercial fisheries chapter of the Offshore EIA Report. | |
Cumul2 | Cumulative displacement leading to increased encounters and collision risk | Vessels may be displaced from their existing adverse weather routes due to construction activities associated with the Proposed Development and other offshore developments in the area | C/D |
|
| Vessel is able to identify a suitable alternative route in adverse weather | 5 | 1 | 1 | 1 | 1 | 1.0 | Tolerable | Vessel is unable to identify a suitable alternative route in adverse weather resulting in an unsafe passage or the passage not being made at all with subsequent impacts on schedules/routine | 2 | 4 | 4 | 4 | 5 | 4.3 | Tolerable | Questions raised over potential for 'crossroads' to be created by traffic passing in different directions in the same sea area. This will be cumulatively assessed in the NRA.
The potential for potting activity within the gap between the Proposed Development array area and Seagreen 1 was raised. This will be assessed in liaison with the commercial fisheries chapter of the Offshore EIA Report. | |
Cumul3 | Cumulative displacement leading to increased encounters and collision risk | Vessels may be displaced from their existing standard routes due to the presence of the Proposed Development and other offshore developments in the area | O |
|
| Increased encounters that do not impact on compliance with the COLREGs but result in increased journey time/distance impacting on schedules/routine | 5 | 1 | 2 | 1 | 2 | 1.5 | Tolerable | Increased encounters creating impacts on compliance with COLREGs and resulting in increased journey time/distance impacting on schedules/routine | 4 | 3 | 3 | 3 | 3 | 30 | Tolerable | Given swell in waves in winter, it will not be possible for fishing vessels to transit through the array, however cumulatively small craft may be pushed into the array bringing risks with winds coming from different direction.
Questions raised over potential for 'crossroads' to be created by traffic passing in different directions in the same sea area. This will be cumulatively assessed in the NRA.
The potential for potting activity within the gap between the Proposed Development array area and Seagreen 1 was raised. This will be assessed in liaison with the commercial fisheries chapter of the Offshore EIA Report. | |
Cumul4 | Cumulative displacement leading to increased encounters and collision risk | Vessels may be displaced from their existing adverse weather routes due to construction activities associated with the Proposed Development and other offshore developments in the area | O |
|
| Vessel is able to identify a suitable alternative route in adverse weather | 5 | 1 | 1 | 1 | 1 | 1.0 | Tolerable | Vessel is unable to identify a suitable alternative route in adverse weather resulting in an unsafe passage or the passage not being made at all with subsequent impacts on schedules/routine | 2 | 4 | 4 | 4 | 5 | 4.3 | Tolerable | Given swell in waves in winter, it will not be possible for fishing vessels to transit through the array, however cumulatively small craft may be pushed into the array bringing risks with winds coming from different direction.
Questions raised over potential for 'crossroads' to be created by traffic passing in different directions in the same sea area. This will be cumulatively assessed in the NRA.
The potential for potting activity within the gap between the Proposed Development array area and Seagreen 1 was raised. This will be assessed in liaison with the commercial fisheries chapter of the Offshore EIA Report. | |
Appendix C Consequences Assessment
Appendix C Consequences Assessment
This appendix presents an assessment of the consequences of collision and allision incidents, in terms of people and the environment, due to the presence of the Proposed Development wind farm structures.
The significance of risk of the hazards due to the presence of the Proposed Development array area are also assessed based upon risk evaluation criteria and comparison with historical accident data in UK waters[15].
C.1 Risk Evaluation Criteria
C.1.1 Risk to People
With regard to the assessment of risk to people two measures are considered, namely:
- Individual risk; and
- Societal risk.
Individual risk considers whether the risk from an incident to a particular individual changes significantly due to the presence of the Proposed Development. Individual risk considers not only the frequency of the accident and the consequences (e.g., likelihood of death), but also the individual’s fractional exposure to that risk, i.e., the probability of the individual being in the given location at the time of the incident.
The purpose of estimating the individual risk is to ensure that individuals who may be affected by the presence of the Proposed Development are not exposed to excessive risks. This is achieved by considering the significance of the change in individual risk resulting from the presence of the Proposed Development relative to the background individual risk levels.
Annual risk levels to crew (the annual risk to an average crew member) for different vessel types are presented in Figure C.1, which also includes the upper and lower bounds for risk acceptance criteria as suggested in IMO Maritime Safety Committee 72/16 (IMO, 2001). The annual individual risk to crew falls within the ALARP region for each of the vessel types presented.
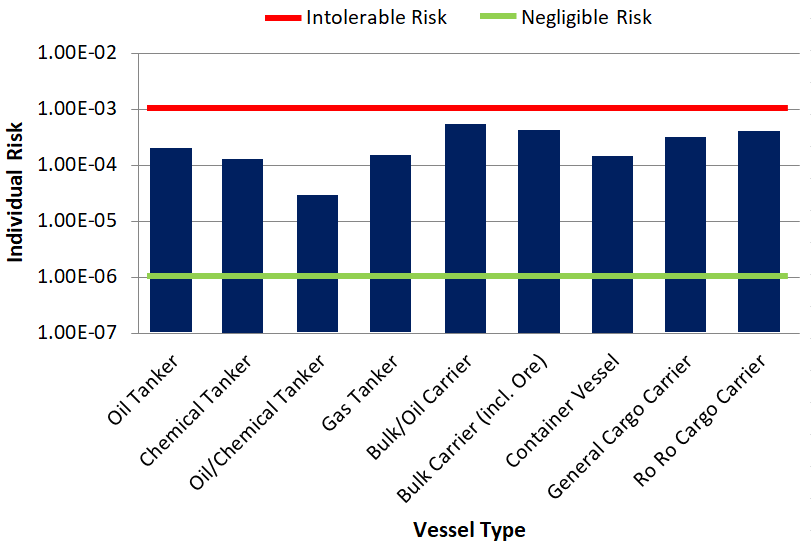
Figure C.1 Individual Risk Levels and Acceptance Criteria per Vessel Type
Typical bounds defining the ALARP regions for decision making within shipping are presented in Table C.1. It can be seen that for a new vessel the target upper bound for ALARP is set lower since new vessels are expected to be safer.
Table C.1 Individual Risk ALARP Criteria
Individual | Lower Bound for ALARP | Upper Bound for ALARP |
|---|---|---|
To crew member | 10-6 | 10-3 |
To passenger | 10-6 | 10-4 |
Third party | 10-6 | 10-4 |
New vessel target | 10-6 | Above values reduced by one order of magnitude |
On a UK basis, the MCA website presents individual risks for various UK industries based upon HSE data from 1987 to 1991. The risks for different industries are presented in Figure C.2.

Figure C.2 Individual Risk per Year for Various UK Industries
The individual risk for sea transport of 2.9×10⁻⁴ per year is consistent with the worldwide data presented in Figure C.1, whilst the individual risk for sea fishing of 1.2×10⁻³ per year is the highest across all of the industries included.
C.1.1.2 Societal Risk
Societal risk is used to estimate risks of accidents affecting many persons (catastrophes) and acknowledging risk adverse or neutral attitudes. Societal risk includes the risk to every person, even if a person is only exposed to risk on one brief occasion. For assessing the risk to a large number of affected people societal risk is desirable because individual risk is insufficient in evaluating risks imposed on large numbers of people.
Within this assessment, societal (navigation-based) risk can be assessed within the Proposed Development array area, giving account to the change in risk associated with each accident scenario caused by the introduction of the wind farm structures. Societal risk may be expressed as:
- Annual fatality rate where frequency and fatality are combined into a convenient one-dimensional measure of societal risk (also known as Potential Loss of Life (PLL)); and
- F-N diagrams showing explicitly the relationship between the cumulative frequency of an accident and the number of fatalities in a multi-dimensional diagram.
When assessing societal risk this study focuses on PLL, which takes into account the number of people likely to be involved in an incident (which is higher for certain vessel types) and assesses the significance of the change in risk compared to the background risk levels.
C.1.2 Risk to Environment
For risk to the environment the key criteria considered in terms of the risk due to the Proposed Development is the potential quantity of oil spilled from a vessel involved in an incident.
It is recognised that there will be other potential pollution, e.g., hazardous containerised cargoes; however, oil is considered the most likely pollutant and the extent of predicted oil spills will provide an indication of the significance of pollution risk due to the Proposed Development compared to background pollution risk levels for the UK.
C.2 Marine Accident Investigation Branch Incident Analysis
C.2.1 All UK Waters Incidents
All British flagged commercial vessels are required to report accidents to the MAIB. Non-UK flagged vessels do not have to report unless they are at a UK port or within 12 nm territorial waters and carrying passengers to a UK port. There are no requirements for non-commercial recreational craft to report accidents to the MAIB; however, a significant proportion of these incidents are reported to and investigated by the MAIB.
Only incidents occurring in UK waters have been considered within this assessment for which the MAIB data is most comprehensive. It is also noted that incidents occurring in ports/harbours and rivers/canals have been excluded since the causes and consequences may differ considerably from an accident occurring offshore, which is the location of most relevance to the Proposed Development.
Taking into account these criteria, a total of 12,093 accidents, injuries and hazardous incidents were reported to the MAIB between 2000 and 2019 involving 13,965 vessels (some incidents, such as collisions, involved more than one vessel).
The locations of all incidents reported in proximity to the UK are presented in Figure C.3, colour-coded by incident type. It is noted that the MAIB aim for 97% accuracy in reporting the location of incidents.
The distribution of unique incidents by year in UK waters is presented in Figure C.4.
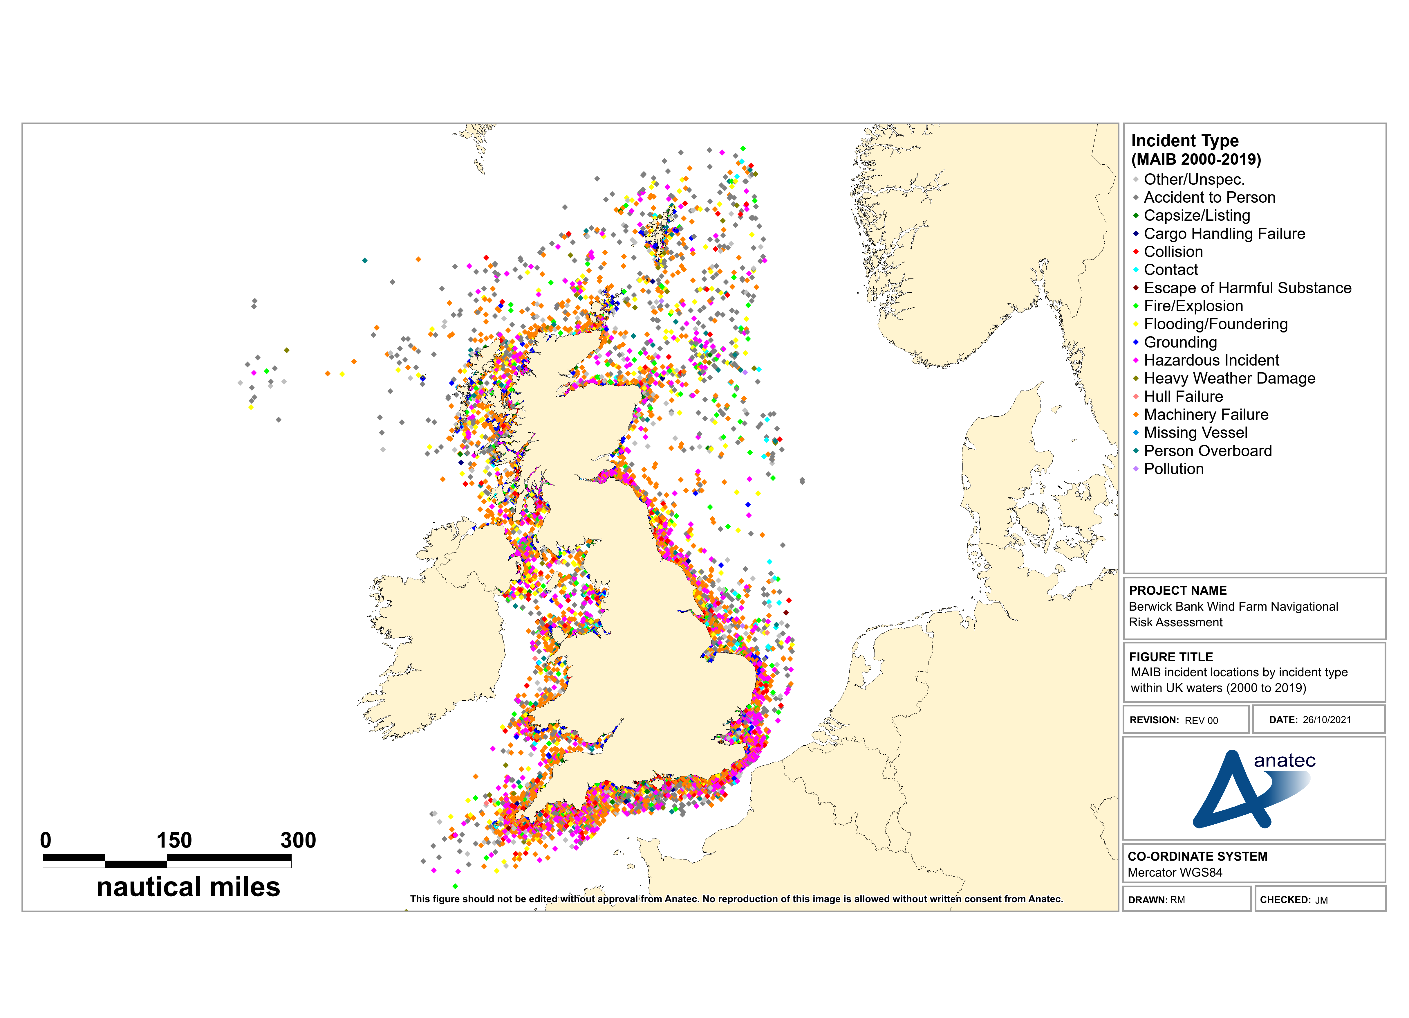
Figure C.3 MAIB Incident Locations by Incident Type within UK Waters (2000 to 2019)
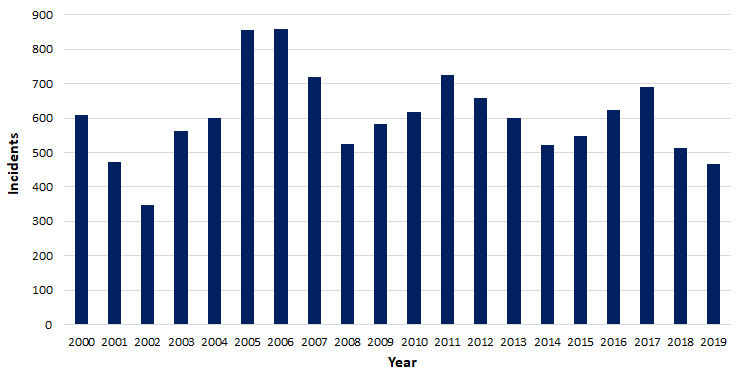
Figure C.4 MAIB Unique Incidents per Year within UK Waters (2000 to 2019)
The average number of unique incidents per year was 605. There has generally been a fluctuating trend in incidents over the 20-year period.
The distribution of incidents in UK waters by incident type is presented in Figure C.5.
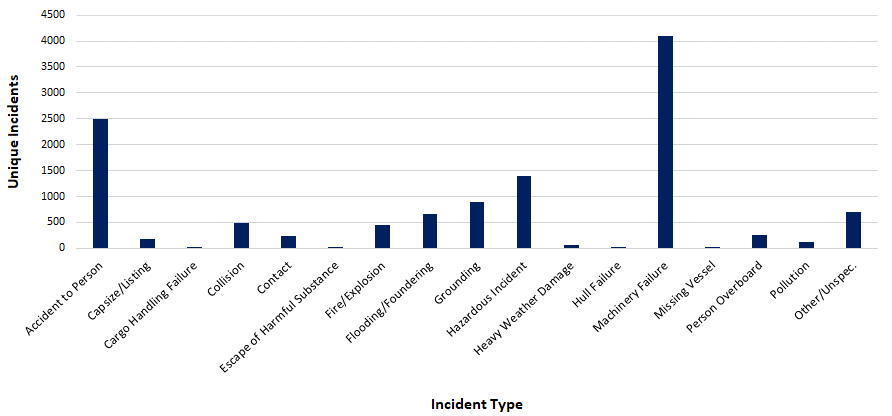
Figure C.5 MAIB Incident Types Breakdown within UK Waters (2000 to 2019)
The most frequent incident types were “machinery failure” (34%), “accident to person” (21%) and “hazardous incident” (12%). “Collision” and “contact” incidents represented 4% and 2% of total incidents, respectively.
The distribution of incidents in UK waters by vessel type is presented in Figure C.6.
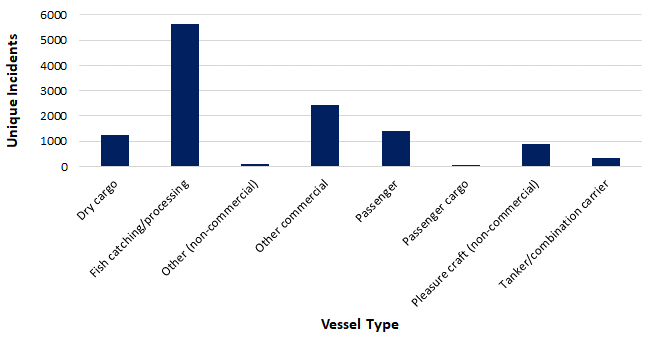
Figure C.6 MAIB Incident Vessel Type Breakdown within UK Waters (2000 to 2019)
The vessel types most frequently involved in incidents were fishing vessels (46%), other commercial vessels (20%) (including offshore industry vessels, tugs, workboats and pilot vessels) and dry cargo vessels (10%).
The total of 373 fatalities were reported in the MAIB incidents within UK waters from 2000 to 2019, averaging 19 fatalities per year.
The distribution of fatalities in UK waters by vessel type and person category (namely crew, passenger and other) is presented in Figure C.7.
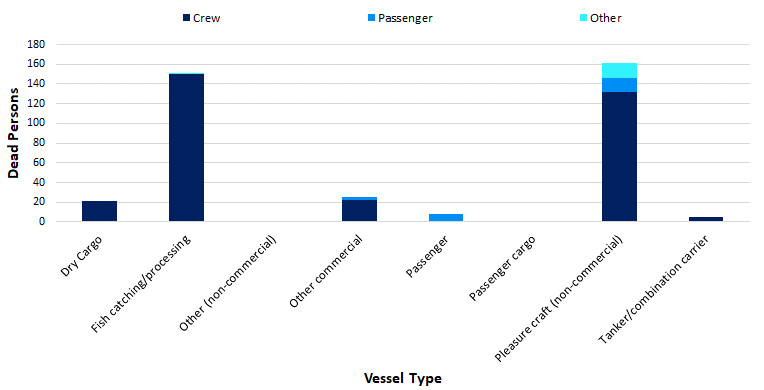
Figure C.7 MAIB Fatalities by Vessel Type within UK Waters (2000 to 2019)
The majority of fatalities occurred to pleasure craft (43%) and fishing vessels (40%), with crew members the main people involved (89%).
C.2.2 Collision Incidents
The MAIB define a collision incident as “ships striking or being struck by another ship, regardless of whether the ships are underway, anchored or moored” (MAIB, 2013).
A total of 481 collision incidents were reported to the MAIB in UK waters between 2000 and 2019 involving 1,090 vessels (in a small number of cases the other vessel involved was not logged).
The locations of collision incidents reported in proximity to the UK are presented in Figure C.8, followed by the distribution of collision incidents per year presented in Figure C.9.
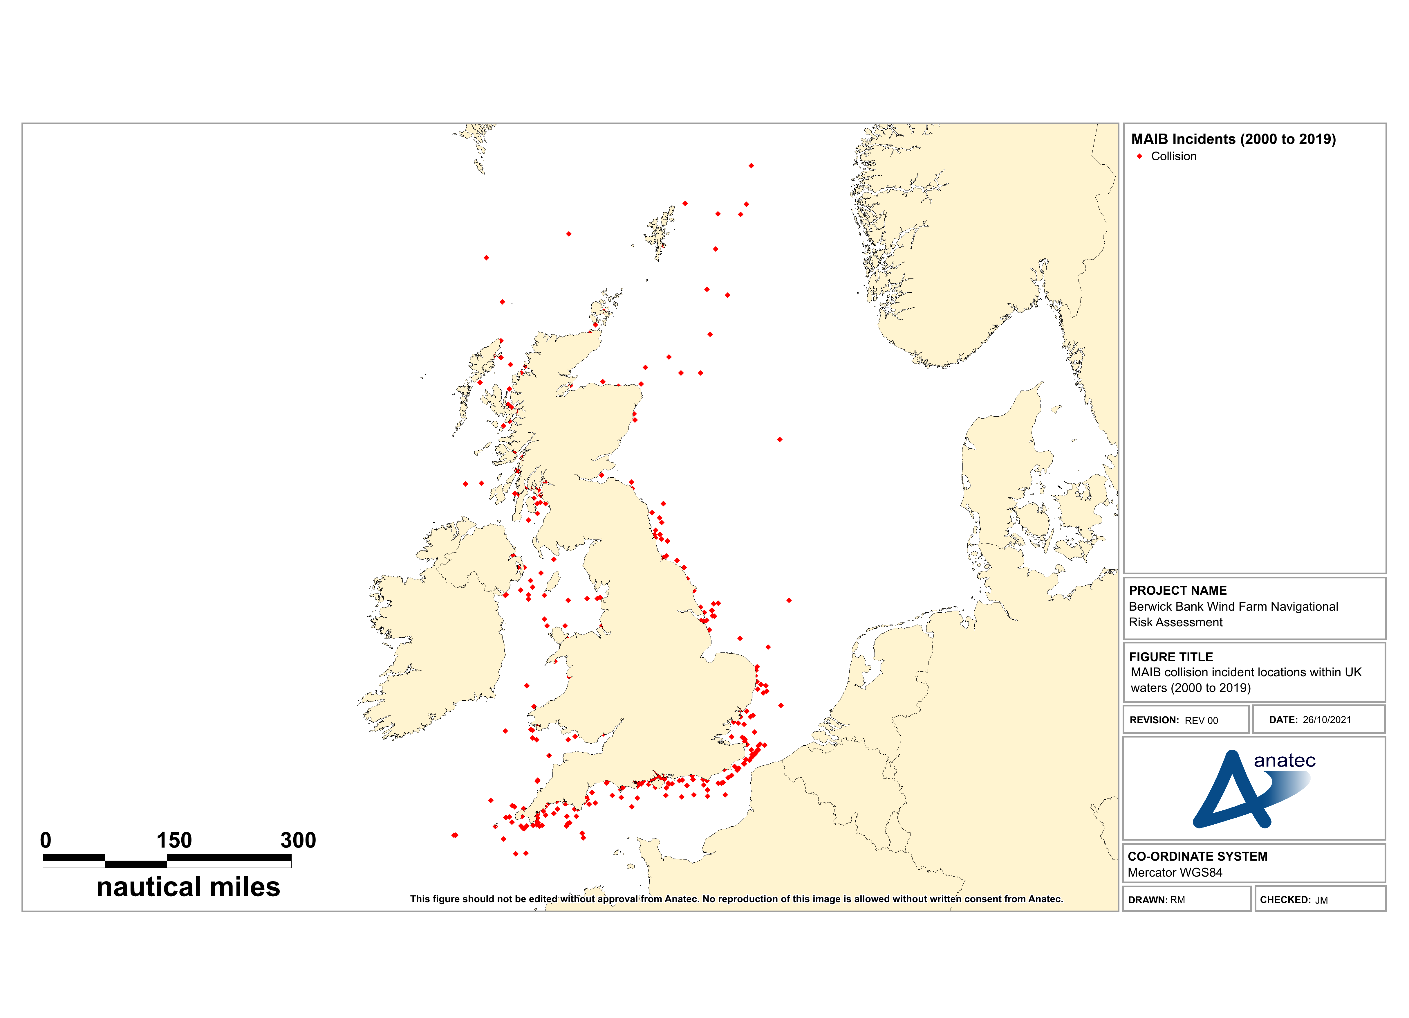
Figure C.8 MAIB Collision Incident Locations within UK Waters (2000 to 2019)
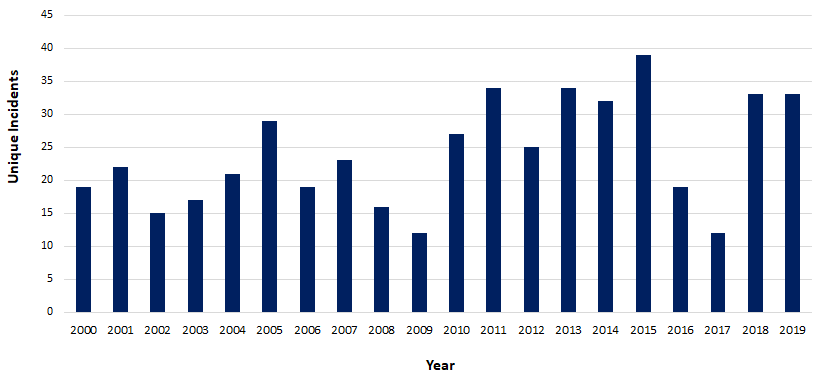
Figure C.9 MAIB Annual Collision Incidents within UK Waters (2000 to 2019)
The average number of unique collision incidents per year was 14. There has been an overall slight increasing trend in collision incidents over the 20-year period, which may be due to better reporting of less serious incidents in recent years.
The most common vessel types involved in collision incidents were other commercial vessels (29%), fishing vessels (24%), non-commercial pleasure craft (23%), and dry cargo vessels (12%).
The total of six fatalities were reported in MAIB collision incidents within UK waters between 2000 and 2019. Details of each of these fatal incidents reported by the MAIB are presented in Table C.2.
Table C.2 Description of Fatal MAIB Collision Incidents (2000 to 2019)
Date | Description | Fatalities |
|---|---|---|
October 2001 | Collision between dry cargo vessel and chemical tanker following lateness by watchkeepers in taking effective action. Dry cargo vessel sank with five of the six crew members rescued. | 1 |
July 2005 | Collision between two powerboats at night. Both vessels were unlit and both helmsmen had consumed alcohol. One of the helmsmen died. | 1 |
October 2007 | Collision between fishing vessel and coastal general cargo vessel following failure to keep an effective lookout. Fishing vessel sank with three of the four crew members abandoning ship into a life raft but the fourth crew member was not recovered. | 1 |
August 2010 | Collision between passenger ferry and fishing vessel. Fishing vessel sank with one of the two crew members recovered from the sea but the other member was not recovered despite an extensive search. | 1 |
June 2015 | Collision between Rigid-hulled Inflatable Boat (RIB) and yacht. Believed that around a dozen persons were onboard the motorboat with the majority taken ashore by lifeboat. One person seriously injured and airlifted to hospital before being pronounced dead later. | 1 |
June 2018 | Collision between power boats during a race. One of the vessels overturned with the pilot pronounced dead at the scene. | 1 |
C.2.3 Contact Incidents
The MAIB define a contact incident as “ships striking or being struck by an external object. The objects can be: floating object (cargo, ice, other or unknown); fixed object, but not the sea bottom; or flying object” (MAIB, 2013).
A total of 235 contact incidents were reported to the MAIB within UK waters between 2000 and 2019 involving 270 vessels (in a small number of cases the contact involved a moving vessel and a stationary vessel).
The locations of contact incidents reported in proximity to the UK are presented in Figure C.10. The distribution of contact incidents is presented in Figure C.11.

Figure C.10 MAIB Contact Incident Locations within UK Waters (2000 to 2019)
Figure C.11 MAIB Contact Incidents per Year within UK Waters (2000 to 2019)
The average number of contact incidents per year was 12. As with collision incidents, there has been an overall slight increasing trend over the 20-year period, which may be due to better reporting of less serious incidents in recent years.
The distribution of vessel types involved in contact incidents is presented in Figure C.12.
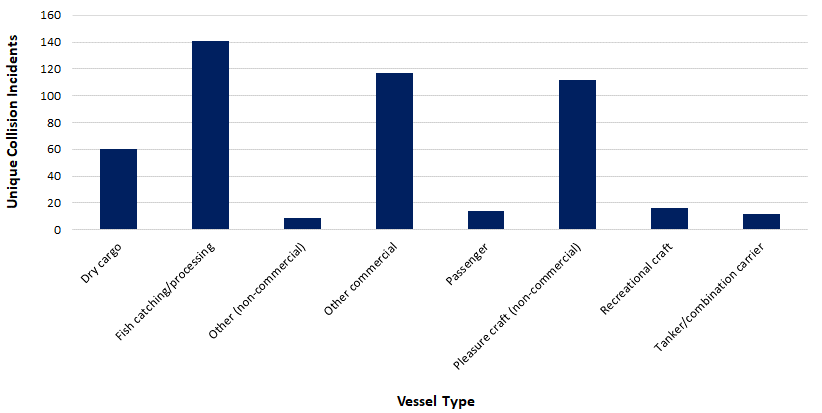
Figure C.12 MAIB Contact Incidents by Vessel Type within UK Waters (2000 to 2019)
The most commonly involved vessel types in contact incidents were other commercial vessels (43%), fishing vessels (15%), and non-commercial pleasure craft (13%).
One fatality was reported in MAIB contact incidents within UK waters between 2000 and 2019. Details of this fatal incident reported by the MAIB are presented in Table C.3.
Table C.3 Description of Fatal MAIB Collision Incidents (2000 to 2019)
Date | Description | Fatalities |
|---|---|---|
June 2012 | Contact between RIB and jetty. RIB badly damaged around the bow and fenders on the jetty also damaged. The RIB owner had consumed alcohol and suffered fatal injuries following the impact. | 1 |
C.3 Fatality Risk
C.3 Fatality Risk
C.3.1 Incident Data
This section uses the MAIB incident data along with information on average manning levels per vessel type to estimate the probability of a fatality in a marine incident associated with the Proposed Development.
The wind farm structures are assessed to have the potential to affect the following incidents:
- Vessel to vessel collision;
- Powered vessel to structure allision;
- Drifting vessel to structure allision; and
- Fishing vessel to structure allision.
Of these incident types, only vessel to vessel collisions match the MAIB definition of collisions and hence the fatality analysis presented in section C.2.2 is considered to be directly applicable to these types of incidents.
The other scenarios of powered vessel to structure allision, drifting vessel to structure allision and fishing vessel to structure allision are technically contacts since they would involve a vessel striking an immobile object in the form of a wind turbine or offshore substation platform. From section C.2.3, it can be seen that only one of the 235 contact incidents reported by the MAIB between 2000 and 2019 resulted in a fatality, with the contact occurring with a jetty in the approaches to a harbour.
As the mechanics involved in a vessel contacting a wind turbine may differ in severity from hitting, for example, a buoy, quayside, or moored vessel, the MAIB collision fatality risk rate has also been conservatively applied for the allision incident types.
C.3.2 Fatality Probability
Six of the 481 collision incidents reported by the MAIB within UK waters between 2000 and 2019 resulted in one or more fatalities. This gives a 1.2% probability that a collision incident will lead to a fatal accident.
To assess the fatality risk for personnel on-board a vessel (crew, passenger or other) the number of persons involved in the incidents needs to be estimated. From analysis of the long-term AIS data, the average commercial passenger vessel had approximately 223 people on board (POB) (total of crew and passengers). For commercial cargo/freight vessels there was an average of 13 POB. For fishing vessels and recreational vessels, the average POB was 3.1 and 2.8, respectively, based on analysis of the MAIB incident data.
Table C.4 Estimated Average POB by Vessel Category
Vessel Category | Sub Categories | Source of Estimated Average POB | Estimated Average POB |
|---|---|---|---|
Cargo/freight | Dry cargo, other commercial, service ship, etc. | MAIB incident data | 15 |
Tanker | Tanker/combination carrier | MAIB incident data | 22 |
Passenger | Roll-on/roll-off (Ro-Ro) passenger, cruise liner, etc. | Vessel traffic survey data/online information | 1,530 |
Fishing | Trawler, potter, dredger, etc. | MAIB incident data | 3.3 |
Recreational | Yacht, small commercial motor yacht, etc. | MAIB incident data | 3.3 |
It is recognised that these numbers can be substantially higher or lower on an individual vessel basis depending upon the size, subtype, etc. but applying reasonable averages is considered sufficient for this analysis.
Using the average number of POB, along with the vessel type information involved in collision incidents reported by the MAIB (see Figure C.8), there were an estimated 10,533 POB the vessels involved in the collision incidents.
Based upon six fatalities, the overall fatality probability in a collision for any individual on board is approximately 5.7×10⁻⁴ (0.057%) per collision.
It is considered inappropriate to apply this rate uniformly as the statistics indicate that the fatality probability associated with smaller craft, such as fishing vessels and recreational vessels, is higher. Therefore, the fatality probability has been subdivided into five categories of vessel as presented in Table C.5.
Table C.5 Collision Incident Fatality Probability by Vessel Category (2000 to 2019)
Vessel Category | Sub Categories | Fatalities | People Involved | Fatality Probability |
|---|---|---|---|---|
Commercial | Dry cargo, passenger, tanker, etc. | 1 | 16,256 | 6.2×10⁻⁵ |
Fishing | Trawler, potter, dredger, etc. | 2 | 880 | 2.3×10⁻³ |
Recreational | Yacht, small commercial motor yacht, etc. | 3 | 713 | 4.2×10⁻³ |
The risk is higher by up to two orders of magnitude for POB small craft compared to larger commercial vessels.
C.3.3 Fatality Risk due to the Proposed Development
The base case and future case annual collision and allision frequency levels pre and post wind farm for the Proposed Development array area are summarised in Table C.6, where change refers to the increase in collision and allision frequency due to the presence of the Proposed Development (overall 1.95×10⁻¹, equating to an additional collision or allision every 5.1 years) for the base case).
Table C.6 Summary of Annual Collision and Allision Risk Results
Risk | Scenario | Annual Frequency (Return Period) | ||
|---|---|---|---|---|
Pre Wind Farm | Post Wind Farm | Change | ||
Vessel to vessel collision | Base case | 8.49×10⁻⁴ | 9.69×10⁻⁴ | 1.20×10⁻⁴ |
Future case (10%) | 1.06×10⁻³ | 1.21x10⁻³ | 1.50×10⁻⁴ | |
Future case (20%) | 8.49×10⁻⁴ | 9.69×10⁻⁴ | 1.20×10⁻⁴ | |
Powered vessel to structure allision | Base case | 1.06×10⁻³ | 1.21x10⁻³ | 1.50×10⁻⁴ |
Future case (10%) | 1.26×10⁻³ | 1.44×10⁻³ | 1.75×10⁻⁴ | |
Future case (20%) | N/A | 1.52×10⁻⁴ | 1.52×10⁻⁴ | |
Drifting vessel to structure allision | Base case | N/A | 1.69×10⁻⁴ | 1.69×10⁻⁴ |
Future case (10%) | N/A | 1.85×10⁻⁴ | 1.85×10⁻⁴ | |
Future case (20%) | N/A | 7.69×10⁻⁵ | 7.69×10⁻⁵ | |
Fishing vessel to structure allision | Base case | N/A | 8.58×10⁻⁵ | 8.58×10⁻⁵ |
Future case (10%) | N/A | 9.36×10⁻⁵ | 9.36×10⁻⁵ | |
Future case (20%) | N/A | 2.29×10⁻¹ | 2.29×10⁻¹ | |
Total | Base case | N/A | 2.52×10⁻¹ | 2.52×10⁻¹ |
Future case (10%) | N/A | 2.75×10⁻¹ | 2.75×10⁻¹ | |
Future case (20%) | 8.49×10⁻⁴ | 2.30×10⁻¹ | 2.29×10⁻¹ | |
From the detailed results of the collision and allision risk modelling, the distribution of the predicted change in annual collision and allision frequency by vessel type due to the Proposed Development for the base case and future cases are presented in Figure C.13.

Figure C.13 Change in Annual Collision and Allision Frequency by Vessel Type
It can be seen that the change in collision and allision frequency is dominated by fishing vessels, owing to the greater duration spent in proximity to Proposed Development array area by fishing vessels engaged in fishing activities and the possibility of fishing occurring internally within the array itself. The second greatest change in collision and allision frequency was associated with cargo vessels, with the other categories significantly lower.
Combining the annual collision and allision frequency, estimated number of POB for each vessel type, and estimated fatality probability for each vessel category, the annual increase in PLL due to the presence of the Proposed Development for the base case is estimated to be 1.31×10⁻³, equating to one additional fatality every 764 years.
The estimated incremental increases in PLL due to the Proposed Development, distributed by vessel type for the base and future cases, are presented in Figure C.14.

Figure C.14 Estimated Change in Annual PLL by Vessel Type
As with the change in annual collision and allision frequency, it can be seen that the change in annual PLL is dominated by fishing vessels, which historically have a higher fatality probability than commercial vessels.
Converting the PLL to individual risk based upon the average number of people exposed by vessel type, the results are presented in Figure C.15.

Figure C.15 Estimated Change in Individual Risk by Vessel Type
It can be seen that the individual risk is highest for people on fishing vessels, which reflects the higher probability of a fatality occurring in the event of an incident involving a fishing vessel.
C.3.4 Significance of Increase in Fatality Risk
In comparison to MAIB statistics, which indicate an average of 20 fatalities per year in UK territorial waters, the overall increase for the base case in PLL of one additional fatality per 764 years represents a small change.
In terms of individual risk to people, the change for commercial vessels attributed to the Proposed Development (approximately 2.89×10⁻⁹ for the base case) is very low compared to the background risk level for the UK sea transport industry of 2.9×10⁻⁴ per year.
For fishing vessels, the change in individual risk attributed to the Proposed Development (approximately 3.98×10⁻⁵ for the base case) is low compared to the background risk level for the UK sea fishing industry of 1.2×10⁻³ per year.
C.4 Pollution Risk
C.4 Pollution Risk
C.4.1 Historical Analysis
The pollution consequences of a collision in terms of oil spill depend upon the following criteria:
- Spill probability (i.e., the likelihood of outflow following an incident); and
- Spill size (quantity of oil).
Two types of oil spill are considered within this assessment:
- Fuel oil spills from bunkers (all vessel types); and
- Cargo oil spills (laden tankers).
Research undertaken as part of the UK’s DfT MEHRAs project (DfT, 2001) has been used as it was comprehensive and based upon worldwide marine oil spill data analysis. From this research, the overall probability of a spill incident per accident was calculated based upon historical accident data for each accident type as presented in Figure C.16.
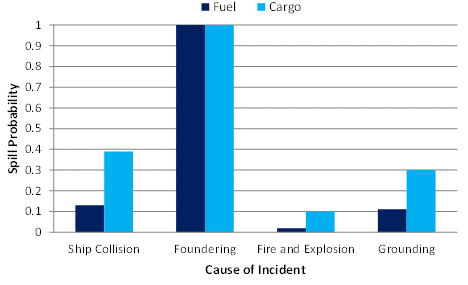
Figure C.16 Probability of an Oil Spill resulting from an Incident
Therefore, it was estimated that 13% of vessel collisions result in a fuel oil spill and 39% of collisions involving a laden tanker result in a cargo oil spill.
In the event of a bunker spill, the potential outflow of oil depends upon the bunker capacity of the vessel. Historical bunker spills from vessels have generally been limited to a size below 50% of bunker capacity, and in most incidents much lower.
For the types and sizes of vessels exposed to the Proposed Development, an average spill size of 100 tonnes of fuel oil is considered to be a conservative assumption.
For oil spills from laden tankers, the spill size can vary significantly. The International Tanker Owners Pollution Federation (ITOPF) reported the following spill size distribution for tanker collisions between 1974 and 2004:
- 31% of spills below seven tonnes;
- 52% of spills between seven and 700 tonnes; and
- 17% of spills greater than 700 tonnes.
Based upon this data and the tankers transiting in proximity to the Proposed Development array area, an average spill size of 400 tonnes is considered conservative.
For fishing vessel collisions comprehensive statistical data is not available. Consequently, it is conservatively assumed that 50% of all collisions involving fishing vessels will lead to oil spill with the quantity spilled being on average five tonnes. Similarly, for recreational vessels, owing to a lack of data 50% of collisions are assumed to lead to a spill with an average size of one tonne.
C.4.2 Pollution Risk due to the Proposed Development
Applying the above probabilities to the annual collision and allision frequency by vessel type and the average spill size per vessel, the estimated amount of oil spilled per year due to the presence of the Proposed Development would equate to 0.51 tonnes of oil per year for the base case. For the future case scenarios, this estimate increases to 0.56 tonnes and 0.61 tonnes for traffic increases of 10% and 20%, respectively.
The estimated increase in tonnes of oil spilled, distributed by vessel type, for the base and future cases are presented in Figure C.17.

Figure C.17 Estimated Change in Pollution by Vessel Type
The annual oil spill results are dominated by fishing vessels due to the high annual collision frequency associated with fishing vessels. Tankers also contribute significantly to the annual oil spill estimate, which reflects the greater spillage size anticipated in incidents involving tankers.
C.4.3 Significance of Increase in Pollution Risk
To assess the significance of the increased pollution risk from vessels caused by the Proposed Development, historical oil spill data for the UK has been used as a benchmark.
From the MEHRAs research, the annual average tonnes of oil spilled in UK waters due to maritime incidents in the 10-year period from 1989 to 1998 was 16,111 tonnes. This is based upon a total of 146 reported oil pollution incidents of greater than one tonne (smaller spills are excluded as are incidents which occurred within port or harbour areas or as a result of operational errors or equipment failure). Commercial vessel spills accounted for approximately 99% of the total while fishing vessel incidents accounted for less than 1%.
The overall increase in pollution estimated due to the Proposed Development of 0.51 tonnes for the base case represents a 0.003% increase compared to the historical average pollution quantities from marine incidents in UK waters.
C.5 Conclusion
This appendix has quantitatively assessed the fatality and pollution risk associated with the Proposed Development in the case of a collision or allision incident occurring. It is concluded, based upon the results, that the collision and allision risk of the Proposed Development on people and the environments is very low compared to the existing background risk levels.
Appendix D Regular Operator Consultation
Appendix D Regular Operator Consultation
Appendix D Regular Operator Consultation
As part of the consultation process for the Project, Regular Operators identified (from the vessel traffic surveys and long-term vessel traffic data) that would be required to deviate their routes due to the presence of the Proposed Development array area were consulted via email. An example of the correspondence sent to the Regular Operators (which shows the extent of the Proposed Development array area and export cable corridor at that time) is presented below.
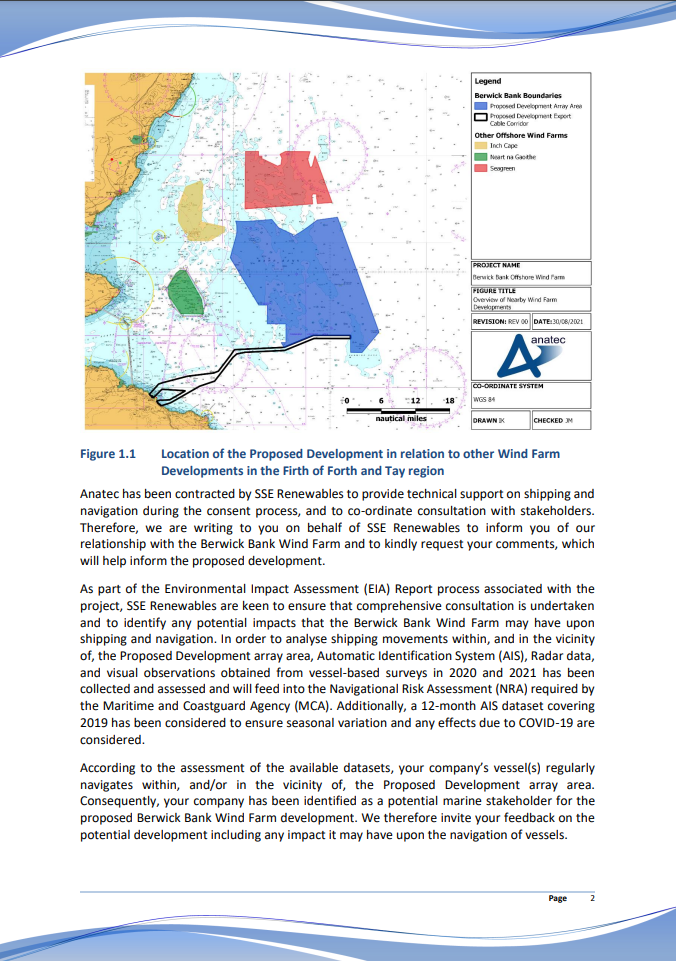
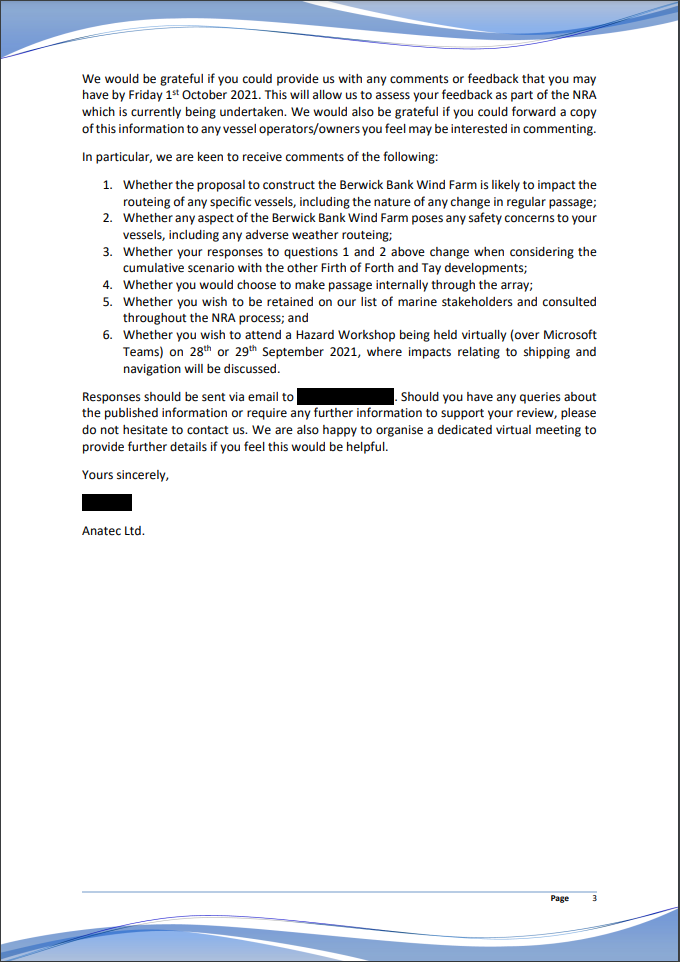
Appendix E Long-Term Vessel Traffic Movements
Appendix E Long-Term Vessel Traffic Movements
E.1 Introduction
E.1 Introduction
This annex assesses additional long-term vessel traffic data for the Proposed Development. As required under MGN 654 (MCA, 2021), the NRA and volume 2, chapter 13 consider 28 days of AIS, radar and visual observation data as the primary vessel traffic data source. However, it should be considered that studying a 28-day period in isolation may exclude certain activities or periods of pertinence to shipping and navigation. Therefore, in line with good practice assessment procedures, this NRA has also considered a longer-term dataset covering all of 2019 to ensure a comprehensive characterisation of vessel traffic movements can be established, including the capture of any season variation.
This approach (i.e., the use of both short- and long-term data) has been agreed with the MCA, NLB and Forth Ports.
E.1.1 Aims and Objectives
The key aims and objectives of this appendix are as follows:
- Identify seasonal variations in vessel traffic via assessment of the long-term vessel traffic data;
- Determine which variations are not reflected within the short-term vessel traffic survey data (and therefore should be fed into the NRA baseline);
- Assess which dataset (long-term, survey, or a combination of both) should be utilised for each key NRA element that requires vessel traffic data input; and
- Identify and account for any potential effects of the COVID-19 pandemic situation on the winter 2021 vessel traffic survey data (acknowledging the data limitation outlined in section 5.2.
- COVID-19 Pandemic Situation
It is noted that while the primary purpose of the long-term dataset is to ensure a comprehensive baseline can be established by ensuring seasonal variations are captured, in the case of the Proposed Development, the consideration of long-term vessel traffic data also ensures that any tangible effects of the COVID-19 pandemic situation on the short-term vessel traffic survey data can be identified, noting that the winter and summer surveys were undertaken in January 2021 and August 2022, respectively, and as such some associated impact upon shipping levels or patterns may be present within the 2021 data (but is not considered relevant for the 2022 data).
As per section 5.2 the MCA, NLB and Forth Ports were content with the vessel traffic surveys on the assumption that additional long-term vessel traffic data prior to the COVID-19 pandemic was considered in tandem with appropriate consultation with the relevant stakeholders. The summer 2022 vessel traffic data has been collected since this consultation and ensures that the effects of COVID-19 pandemic on the baseline characterisation are further negated.
E.2 Methodology
E.2 Methodology
E.2.1 Study Area
This appendix has assessed the long-term vessel traffic data within the Proposed Development array area shipping and navigation study area introduced in section 5 (i.e. a 10 nm buffer around the Proposed Development array area).
E.2.2 Data Period and Temporary Vessel Traffic
Notable levels of wind farm and survey traffic were recorded associated with the Proposed Development and Seagreen to the north, as well as at the nearby NnG and Inch Cape offshore wind farms nearer shore. As these offshore wind farms are not yet operational, this traffic has been excluded as temporary on the basis that 2019 movements may not accurately reflect that of future traffic. Vessels transiting to other offshore wind farms outside the Proposed Development array area shipping and navigation study area were retained. Temporary traffic that has been filtered out of the rest of the analysis is presented below in Figure E.1.
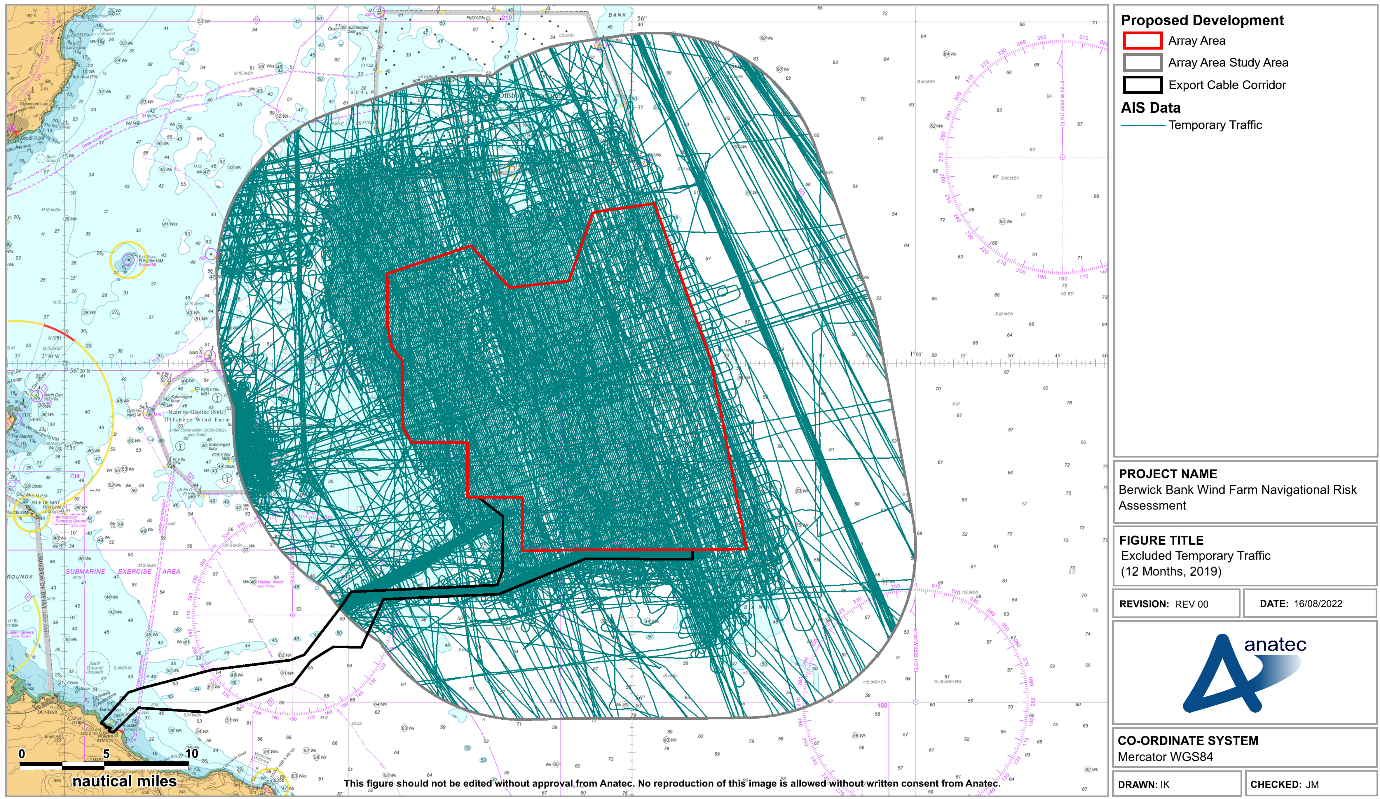
Figure E.1 Long-Term AIS Data – Excluded Temporary Traffic (12 Months, 2019)
Data coverage was observed to be good, however it should be considered that approximately 7% of downtime was observed throughout the entirety of 2019.
E.2.3 AIS Carriage
General limitations associated with the use of AIS data (for example, carriage requirements) are discussed within section 13.8.2.
E.3 Long-Term Vessel Traffic Movements
A plot of the vessel tracks recorded within the Proposed Development array area shipping and navigation study area during the data period, colour-coded by vessel type and excluding temporary traffic, is presented in Figure E.2. The vessel density within the Proposed Development array area shipping and navigation study area is then presented in Figure E.3.
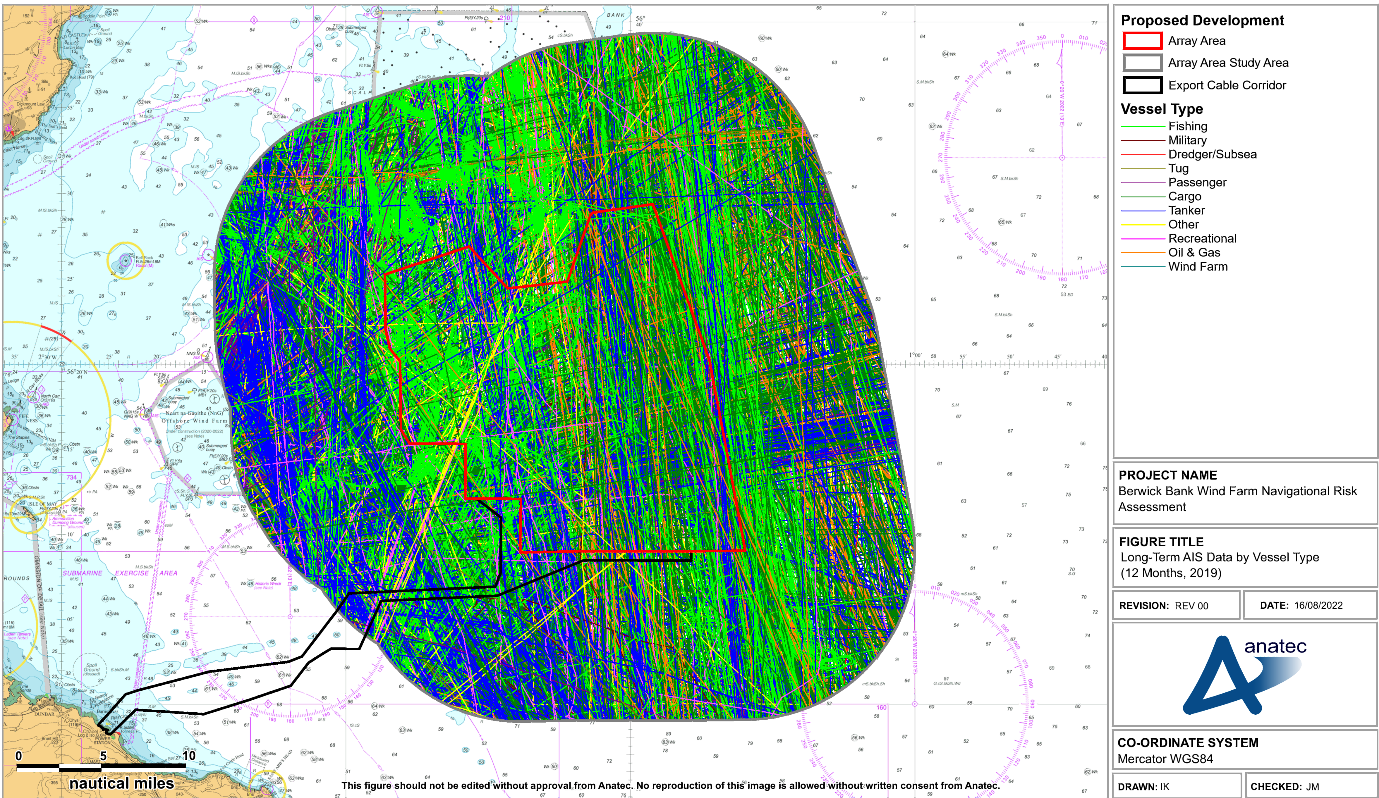
Figure E.2 Long-Term AIS Data by Vessel Type (12 Months, 2019)
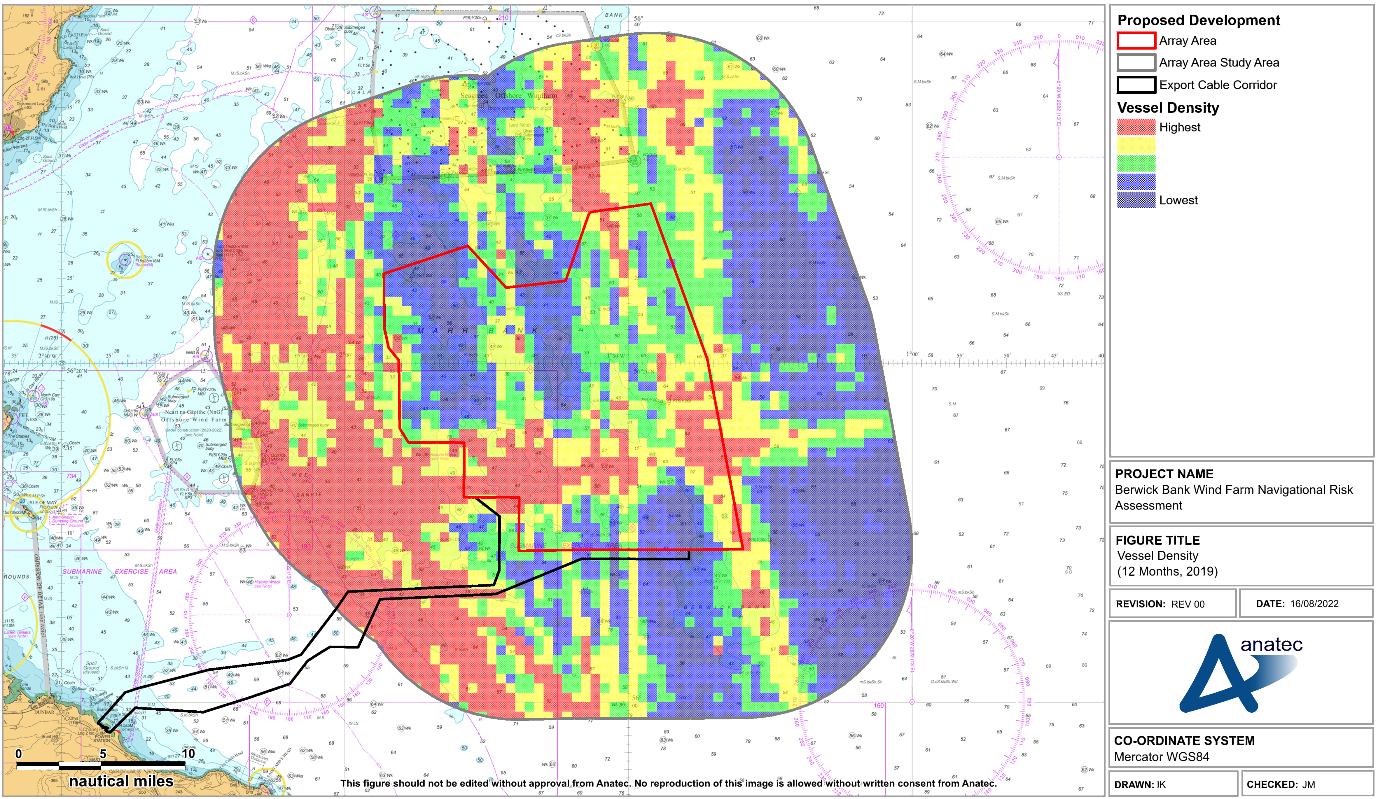
Figure E.3 Vessel Density Heat Map (12 Months, 2019)
E.3.1 Vessel Count
The average daily number of vessels within the Proposed Development array area and the shipping and navigation study area are presented in Figure E.4. The downtime in each given month was accounted for when calculating the average daily vessels.

The busiest month recorded within the Proposed Development array area shipping and navigation study area was June with 20 unique vessels recorded per day, while the quietest month was January with approximately 13 vessels per day (factored for downtime).
E.3.2 Vessel Type
The distribution of the main vessel types recorded during the data period are presented in Figure E.5.

Figure E.5 Main Vessel Type Distribution (12 Months, 2019)
The most common vessel type recorded was tankers, accounting for approximately 33% of all traffic recorded. Other common vessel types included cargo vessels (26%) and commercial fishing vessels (22%).
E.3.3 Commercial Vessels
Figure E.6 presents the commercial vessels recorded within the Proposed Development array area study area during the study period, colour-coded by vessel type.
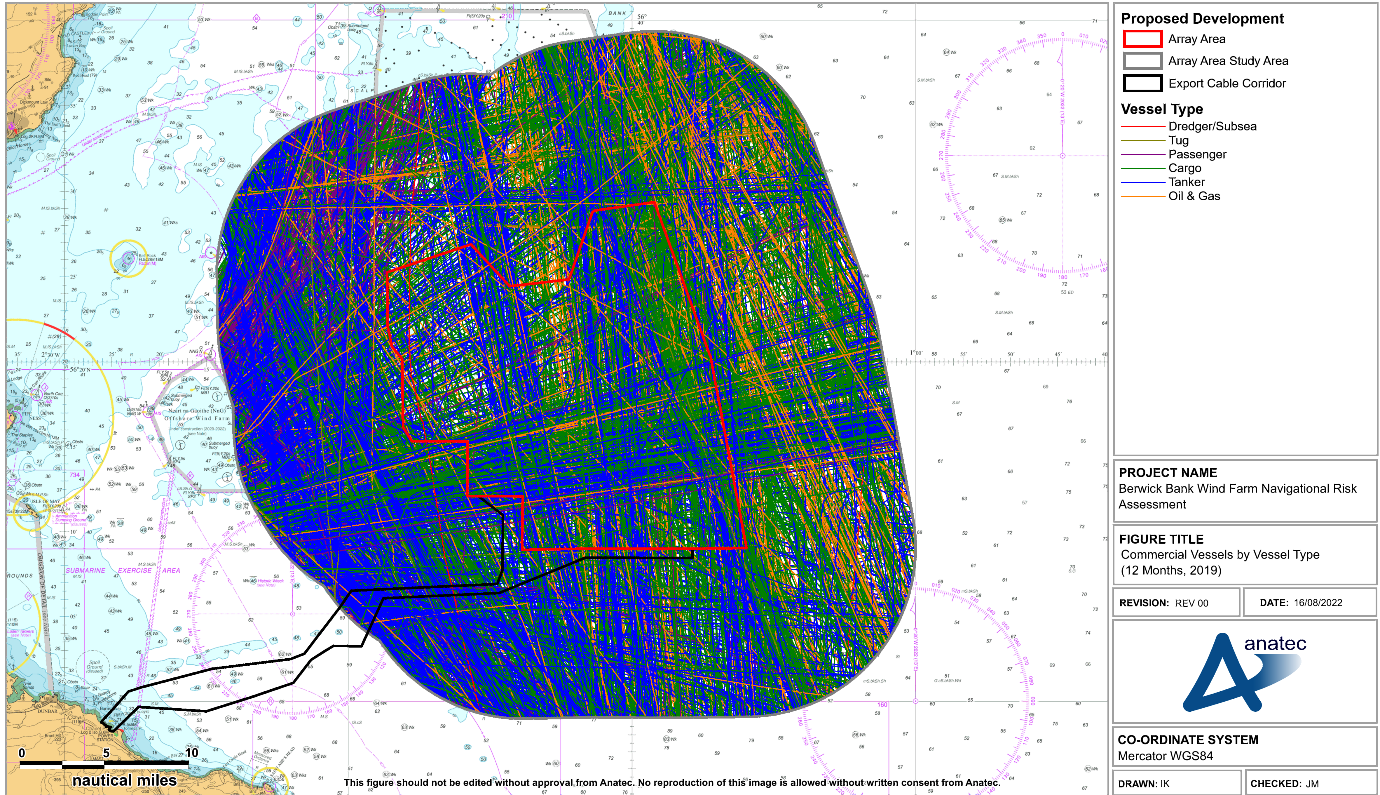
Figure E.6 Commercial Vessels by Type (12 Months, 2019)
A high density of commercial traffic was noted, as it accounts for over half of the total vessel activity within the Proposed Development array area shipping and navigation study area. The majority of the commercial traffic is on well-defined routes. Routeing was predominantly in a north-south direction or out of the Firth of Forth.
Figure E.7 presents the average number of unique commercial vessels for each vessel type detected per month within the Proposed Development array area shipping and navigation study area during the study period factored to account for downtime.

Passenger vessels highlighted the seasonal variation within the Proposed Development array area shipping and navigation study area, as higher counts were recorded between May and September.
Cargo vessels showed minimal seasonal variation. The busiest month for cargo vessels was March with 181 recorded, while the quietest was January with approximately 92 cargo vessels recorded (factored for downtime).
Tankers similarly showed minimal seasonal variation. The busiest months for tankers were, factoring for downtime, March and May, with 166 vessels recorded during March (in which there was no downtime recorded) and a projected vessel count of 178 vessels was estimated for May based on downtime.
Table E.1 presents a summary of the average number of vessels within the Proposed Development array area shipping and navigation study area during the busiest month, quietest month, and the average throughout the full data period.
Table E.1 Quietest, Busiest and Average Daily Unique Vessel Counts for Commercial Vessels (2019)
Vessel Type | Quietest Month | Busiest Month | Average |
|---|---|---|---|
Tankers | 4-5 | 5-6 | 5 |
Cargo vessels | 3 | 5-6 | 4 |
Oil and gas vessels | 0-1 | 1-2 | 1 |
Passenger vessels | 0 | 1-2 | 0-1 |
Marine aggregate dredgers | 0 | 0 | 0-1 |
Tugs | 0 | 0 | 0 |
In summary, the most common type of commercial vessel recorded within the Proposed Development array area study area was tankers. Cargo vessels and tankers showed little seasonal variation while passenger vessel activity was greater in the summer months.
E.3.4 Passenger Vessels
Figure E.8 presents in isolation the passenger vessels recorded within the Proposed Development array area shipping and navigation study area during the study period.
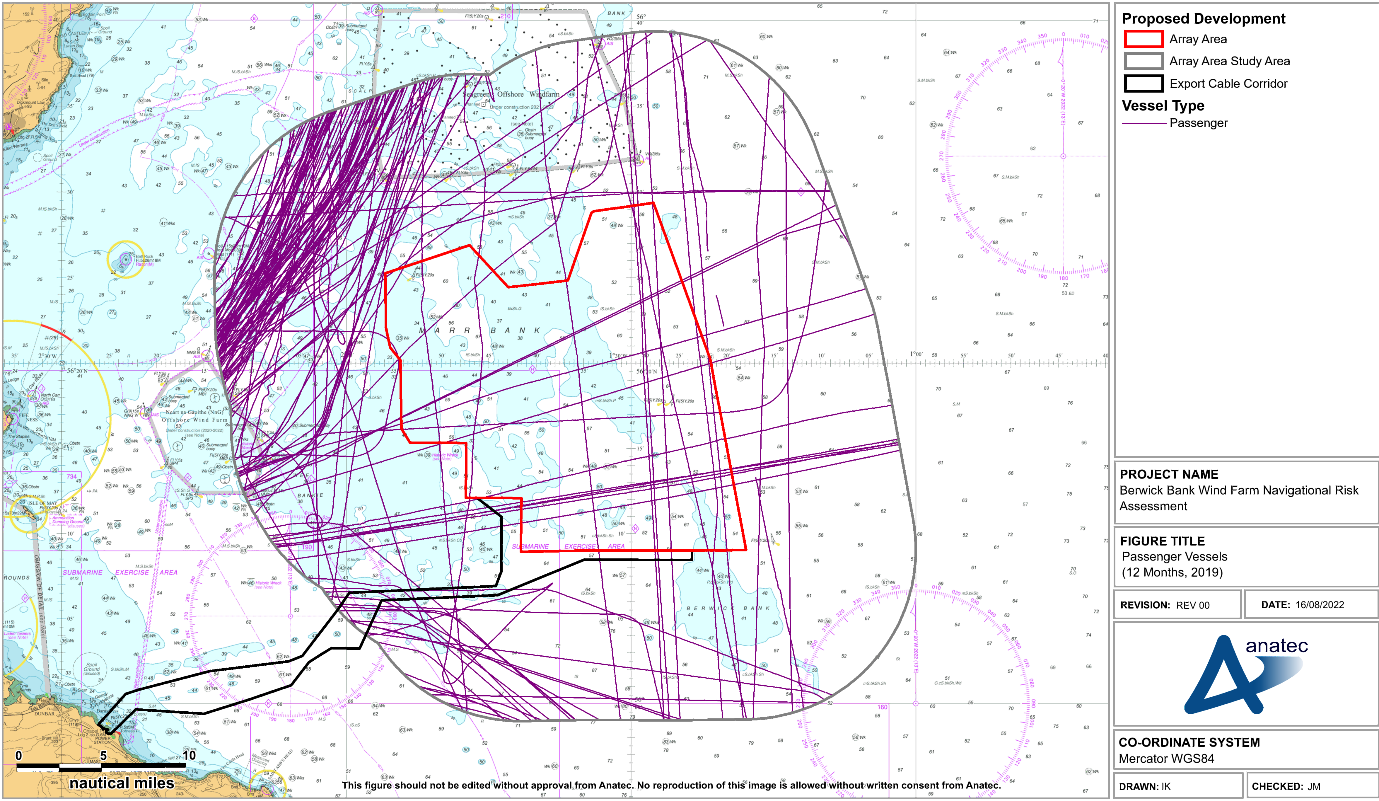
Figure E.8 Passenger Vessels (12 Months, 2019)
Passenger vessel traffic was not captured during the winter 2021 survey period (but was during the summer 2022 survey period). This may be attributed to the seasonal variation of traffic (see Figure E.7), or the effects of the COVID-19 pandemic.
E.3.5 Oil and Gas Vessels
Figure E.9 presents the oil and gas vessels recorded on AIS within the Proposed Development array area shipping and navigation study area during the study period.
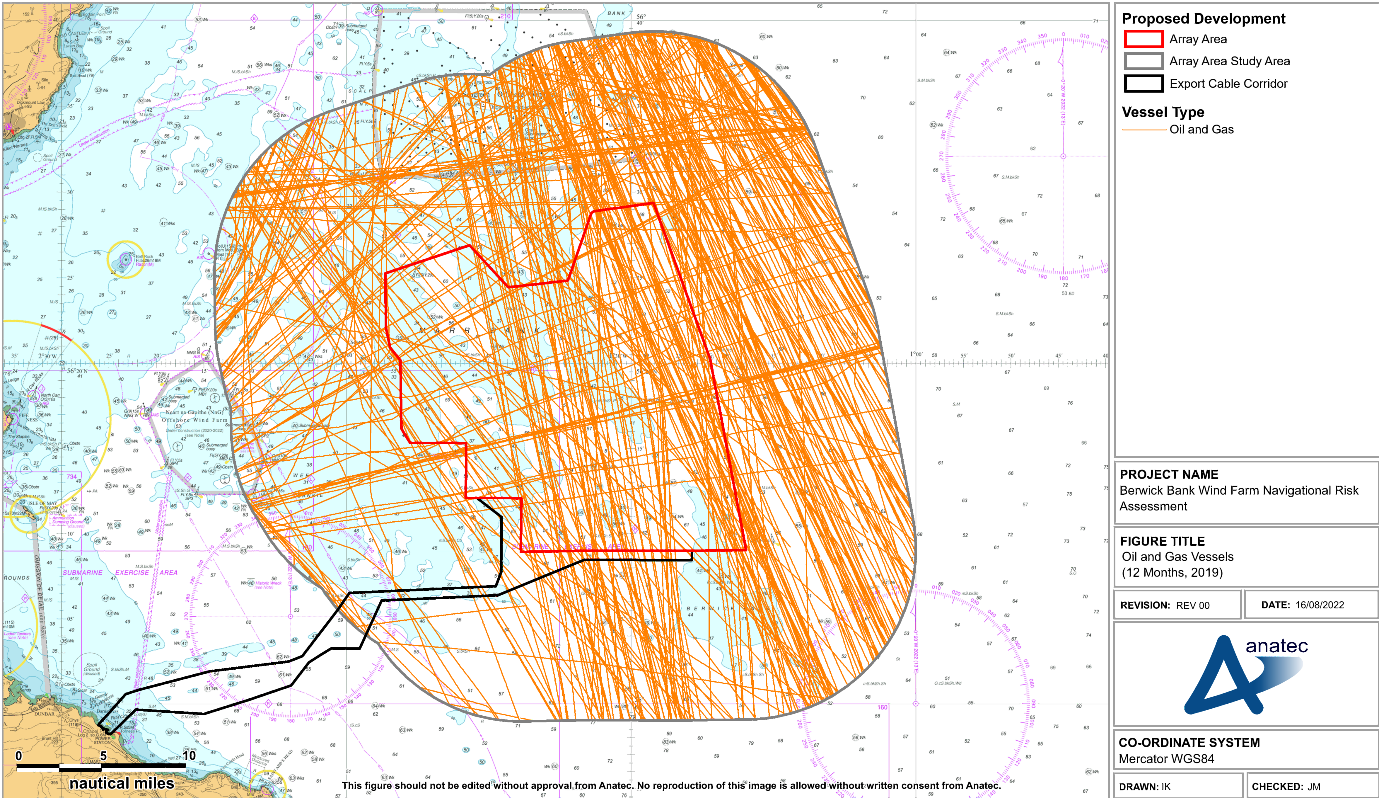
Figure E.9 Oil and Gas Support Vessels (12 Months, 2019)
Oil and gas support vessels were typically observed on transit, utilising a number of routes similar to that of commercial vessels (see Figure E.6). No oil and gas infrastructure is situated within the Proposed Development array area shipping and navigation study area.
A breakdown of the average number of daily unique oil and gas support vessels within the Proposed Development array area shipping and navigation study area per month is presented in Figure E.10.

Within the Proposed Development array area shipping and navigation study area, an average of approximately one unique oil and gas vessel was recorded per day.
The busiest month for oil and gas vessels throughout the study period within the Proposed Development array area shipping and navigation study area were March and May with 55 vessels recorded each, while the quietest month was November with 22 recorded. On average, 38 oil and gas vessels were recorded each month (factoring for downtime).
During the long-term study period, one instance of an offshore installation passing in proximity to the Proposed Development array area was recorded. An FPSO was recorded being towed by two tugs (supported by two other vessels) east-west into Dundee, passing the Proposed Development array area at a minimum distance of approximately 1.8 nm. This activity is presented in Figure E.11.
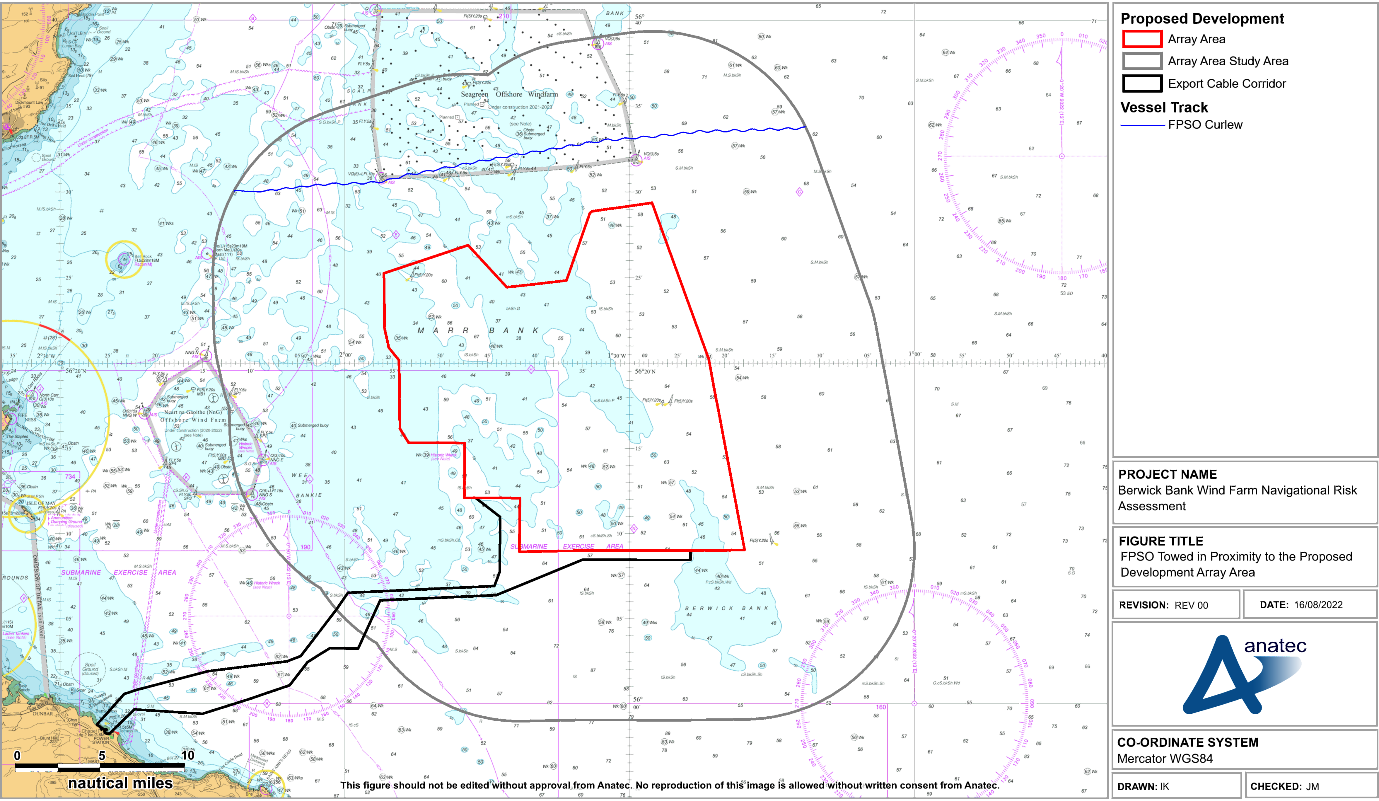
Figure E.11 FPSO Towed in proximity to the Proposed Development Array Area
E.3.6 Commercial Fishing Vessels
Figure E.12 presents the commercial fishing vessels recorded via AIS within the Proposed Development array area shipping and navigation study area during the study period colour-coded by activity. Based on the vessel speed, destination and navigational status broadcast, commercial fishing vessels were categorised as either on transit or actively fishing. It is noted that a proportion of commercial fishing vessels were recorded on transit before and after being identified as actively fishing.
Commercial fishing vessels were typically in transit to the eastern portion of the Proposed Development array area shipping and navigation study area while vessels were recorded actively fishing to the western portion of the Proposed Development array area shipping and navigation study area. It should be considered that as this assessment is AIS only; it is likely that commercial fishing vessel activity is underrepresented (see section 10.1.2.3).
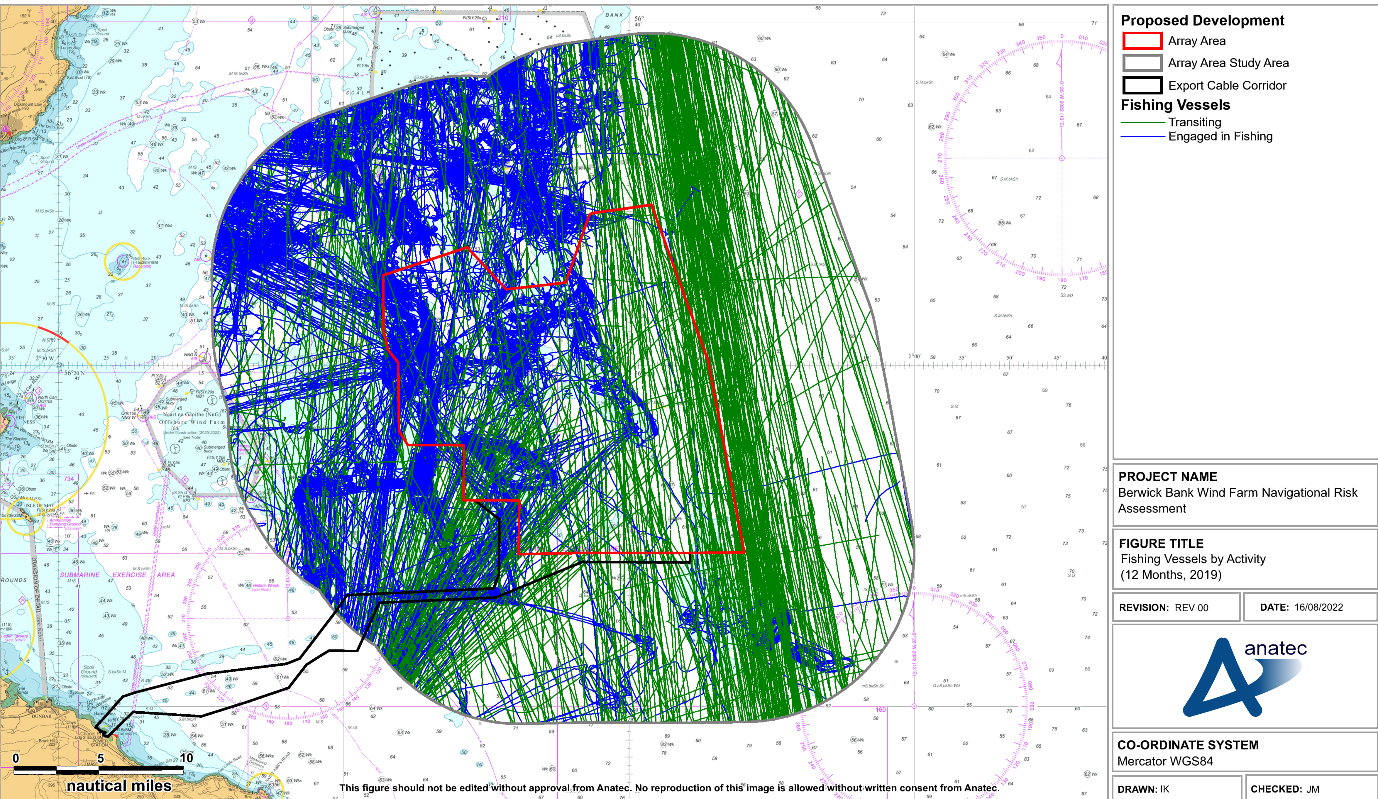
Figure E.12 Commercial Fishing Vessels by Activity (2019)
During the study period, 47% of commercial fishing vessels were estimated to be actively engaged in fishing activities within the Proposed Development array area shipping and navigation study area. The majority of these vessels were observed to be in the western half of the Proposed Development array area shipping and navigation study area. The average daily number of commercial fishing vessels recorded per day per month is summarised in Figure E.13.

The busiest month for fishing vessels within the Proposed Development array area shipping and navigation study area was June, with approximately 156 commercial fishing vessels recorded. The quietest month for commercial fishing vessels (factoring for downtime) was August, with 60 recorded. On average, 105 commercial fishing vessels per month were recorded within the Proposed Development array area shipping and navigation study area.
E.3.7 Recreational Vessels
Figure E.14 presents the recreational vessels recorded within the Proposed Development array area shipping and navigation study area during the study period.
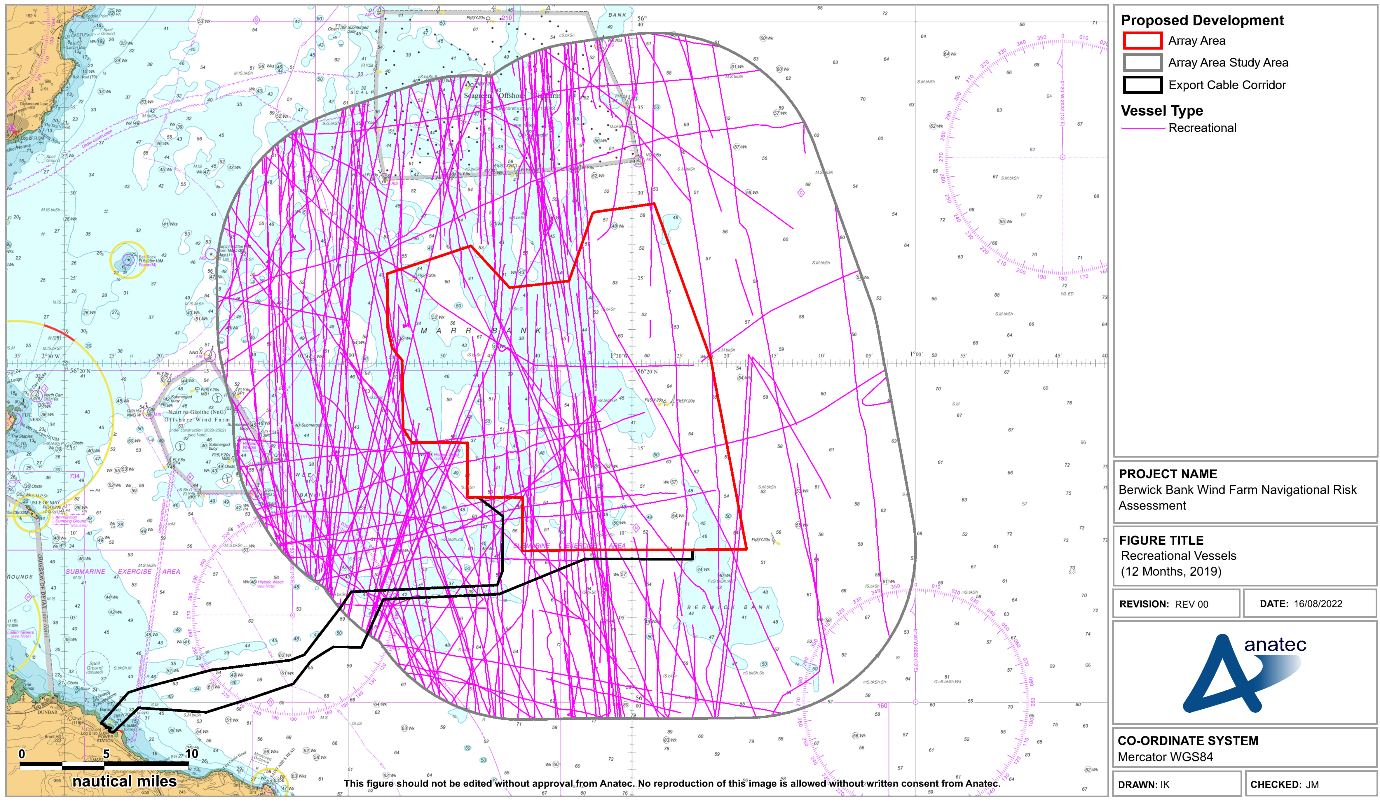
Figure E.14 Recreational Vessels (12 Months, 2019)
Recreational vessel activity was typically observed within the western portion of the Proposed Development array area shipping and navigation study area (i.e., closer to shore), with the majority of recreational activity recorded transiting in a north-south direction.
The distribution of daily unique recreational vessels recorded per month within the Proposed Development array area study area is presented in Figure E.15.

An average of approximately one recreational vessel every two days was recorded within the Proposed Development array area shipping and navigation study area. The seasonal variation in vessel numbers can be clearly seen, with limited numbers of recreational vessels recorded in the winter months and the vast majority of activity recorded during the summer months.
The busiest month for recreational vessels within the Proposed Development array area shipping and navigation study area was June, with 47 vessels recorded, while the quietest months were January, February, March, and December in which no vessels were recorded (although it is noted that significant downtime occurred during January 2019).
E.4 Site Specific Analysis
The vessel tracks intersecting the Proposed Development array area during the study period are presented in Figure E.16.
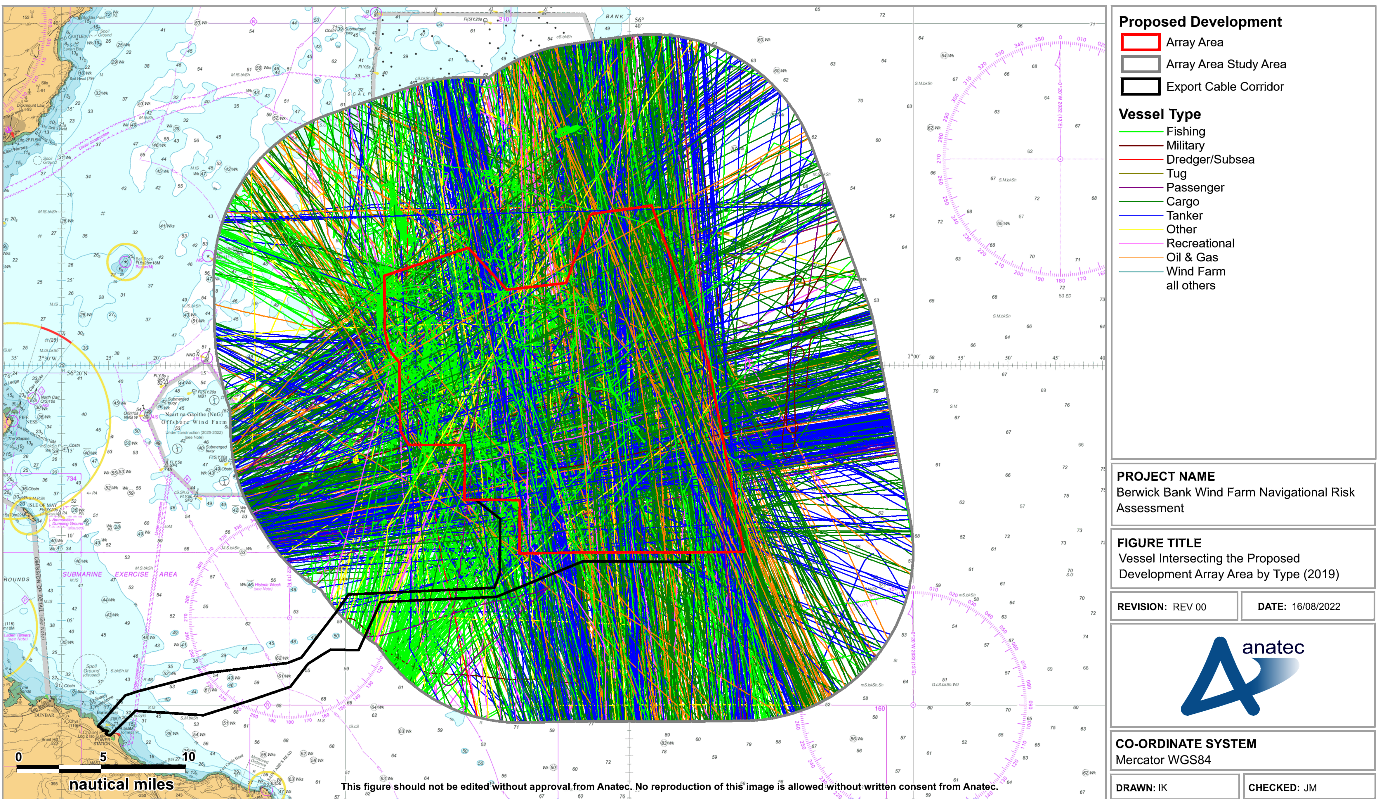
Figure E.16 Vessels intersecting the Proposed Development Array Area by Vessel Type (12 Months, 2019)
On average, five to six unique vessels per day were recorded intersecting the Proposed Development array area during 2019. The busiest day was the 30th of April, on which 14 unique vessels were recorded intersecting the Proposed Development array area.
A breakdown of the daily unique vessel count intersecting the Proposed Development array area is presented in Figure E.17 by vessel type.

Figure E.17 Distribution of Vessels intersecting the Proposed Development array area by Vessel Type
The most common vessel types recorded within the Proposed Development array area were cargo vessels (comprising 33% of all vessels), followed by tankers (29%), and commercial fishing vessels (23%).
It can be seen from Figure E.17 that significant levels of commercial activity were observed within the Proposed Development array area. On average, two cargo vessels and one to two tankers per day passed through the Proposed Development array area, while an average of one passenger vessel every two weeks was also recorded.
E.5 Survey Data Comparison
Survey data recorded during 14-day periods in August 2022 and January 2021 were collected using a combination of AIS, radar, and visual observations. This subsection provides comparison of the 28-day survey period (summer and winter combined) against the long-term 2019 AIS data.
A comparison of the average number of each main vessel type recorded during the long-term 2019 data period and the 14-day survey periods is presented in Table E.2.
Table E.2 Average Daily Vessel Counts by Type for Survey Data and Long-Term Data
Vessel Type | Long-term 2019 AIS Data (Vessels per Day) | Winter Survey (January 2021) | Summer Survey (August 2022) | ||
|---|---|---|---|---|---|
Quietest Month | Busiest Month | Average Vessels per Day | Average Vessels per Day | Average Vessels per Day | |
Tankers | 4-5 | 5-6 | 2 | 5 | 4 |
Cargo vessels | 3 | 6 | 2 | 4 | 3 |
Commercial fishing vessels | 2 | 4 | 1 | 3 | 1-2 |
Oil and gas vessels | 0-1 | 1-2 | 1 | 1 | 0-1 |
Recreational vessels | 0 | 1-2 | 0 | 0 | 1 |
Passenger vessels | 0 | 1 | 0 | 0 | 1-2 |
The average daily vessel count within the long-term data was consistently slightly higher than for the survey periods; this may be attributed to the effects of the COVID-19 pandemic during the winter survey period, with traffic numbers in the process of recovering in the summer survey period. The absence of regularly scheduled passenger vessels in the vessel traffic surveys is also noted.
E.6 Conclusion
A year of AIS data during 2019 has been analysed to validate the winter 2021 and summer 2022 vessel traffic survey data recorded within the Proposed Development array area shipping and navigation study area.
The main type of vessels detected within the Proposed Development array area shipping and navigation study area during 2019 were tankers (33%), followed by cargo vessels (26%) and fishing vessels (22%). Similarly, main vessel types detected during the winter 2021 period were cargo vessels (36%), tankers (32%), and fishing vessels (16%). During summer 2022, the most common vessel types were tanker (30%) and tanker (23%), with increased passenger vessel numbers seen (12%) – fishing vessel numbers remained relatively high however (11%). Overall, the vessel types detected within the Proposed Development array area study area were similar between the vessel traffic survey data and long-term data, with differences in volumes of passenger vessel and recreational vessel traffic noted.
Appendix F Summer 2020 Vessel Traffic Data
Appendix F Summer 2020 Vessel Traffic Data
Appendix F Summer 2020 Vessel Traffic Data
Vessel traffic survey data covering a seasonal summer 2020 survey period comprising AIS, Radar, and visual observation data has been collected in addition to the main dataset assessed within the NRA. This appendix provides full assessment of the additional data and compares it to the findings of the NRA assessment.
On this basis the aims of this appendix are:
- Assess the summer 2020 survey data; and
- Compare the findings against the 2019 data used to inform the NRA.
It should be considered when viewing the analysis that COVID-19 pandemic may have impacted the 2020 data.
The AIS and Radar tracks from the summer 2020 survey period are presented in Figure F.1.
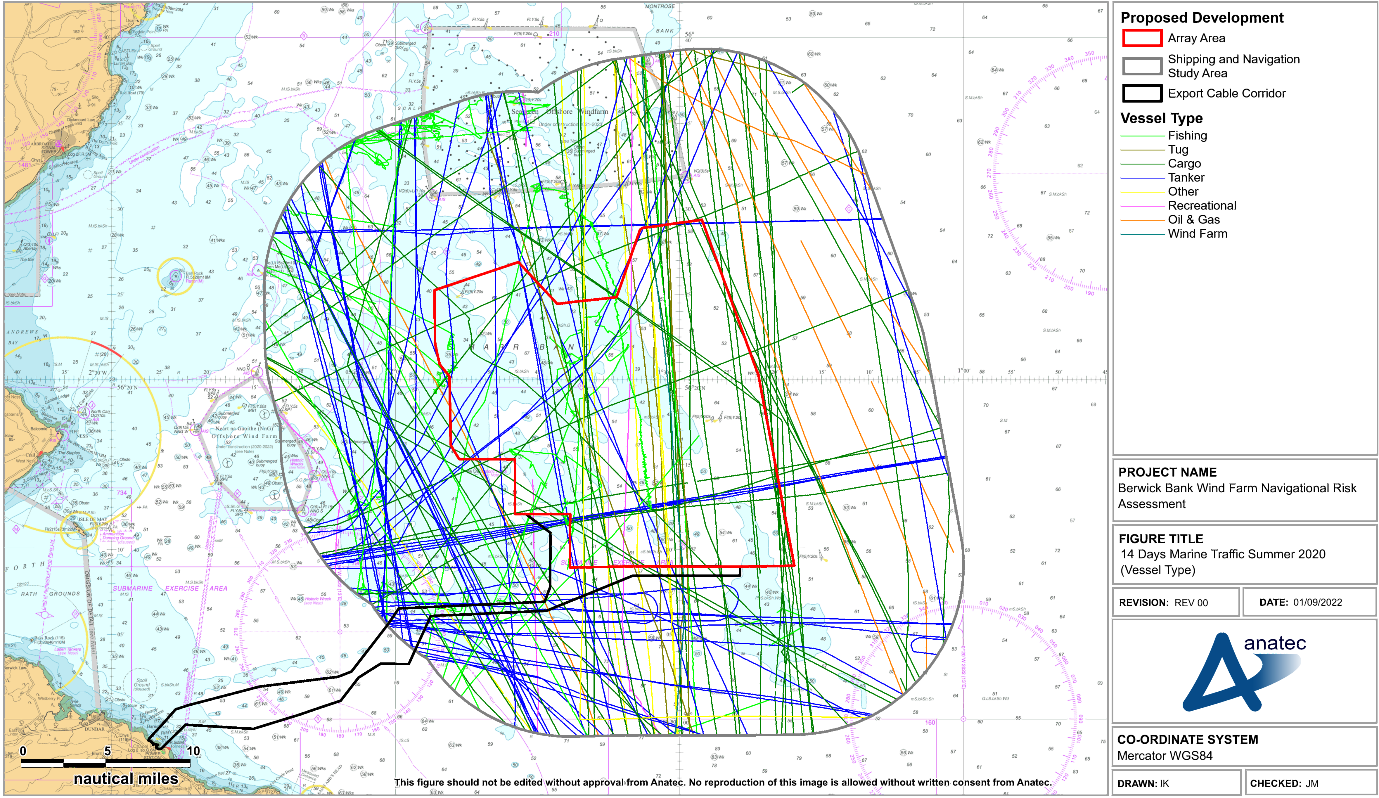
Figure F.1 14 Days Vessel Traffic Summer 2020 by Vessel Type
F.1 Vessel Count
For the 14 days analysed in the summer 2020 survey period, there was an average of 12 unique vessels per day recorded within the Proposed Development array area shipping and navigation study area. In terms of vessels intersecting the Proposed Development array area itself, there was an average of five unique vessels per day.
The daily number of unique vessels recorded within the Proposed Development array area shipping and navigation study area and the Proposed Development array area itself during the summer 2020 survey period are presented in Figure F.2. Since the survey commenced and concluded midway through the first and last days of the summer survey period, the first and last days are partial.

Throughout the summer survey period, approximately 43% of unique vessel tracks recorded within the Proposed Development array area shipping and navigation study area intersected the Proposed Development array area itself.
The busiest day recorded within the Proposed Development array area shipping and navigation study area throughout the summer 2020 survey period was 24 July when 18 unique vessels were recorded. The busiest day recorded within the Proposed Development array area itself throughout the summer survey period was 23 July when nine unique vessels were recorded.
The quietest full day recorded within the Proposed Development array area shipping and navigation study area throughout the summer 2020 survey period was 28 July when seven unique vessels were recorded. The quietest full day recorded within the Proposed Development array area itself throughout the summer 2020 survey period was 19 July when one unique vessel was recorded.
F.2 Vessel Type
The percentage distribution of the main vessel types recorded within the Proposed Development array area shipping and navigation study area during the summer 2020 survey period is presented in Figure F.3.

Throughout the summer period, the most common vessel types in the Proposed Development array area shipping and navigation study area were tankers (33%), cargo vessels (32%), and commercial fishing vessels (15%).
It is noted that no commercial ferries were identified in the summer 2020 vessel traffic survey data, which aligns with feedback provided by Forth Ports during consultation (see 10 June 2020 entry in Table 4.1 Open ▸ ).
F.2.1 Cargo Vessels
The tracks of cargo vessels recorded within the Proposed Development array area shipping and navigation study area throughout the summer 2020 survey period are presented in Figure F.4.
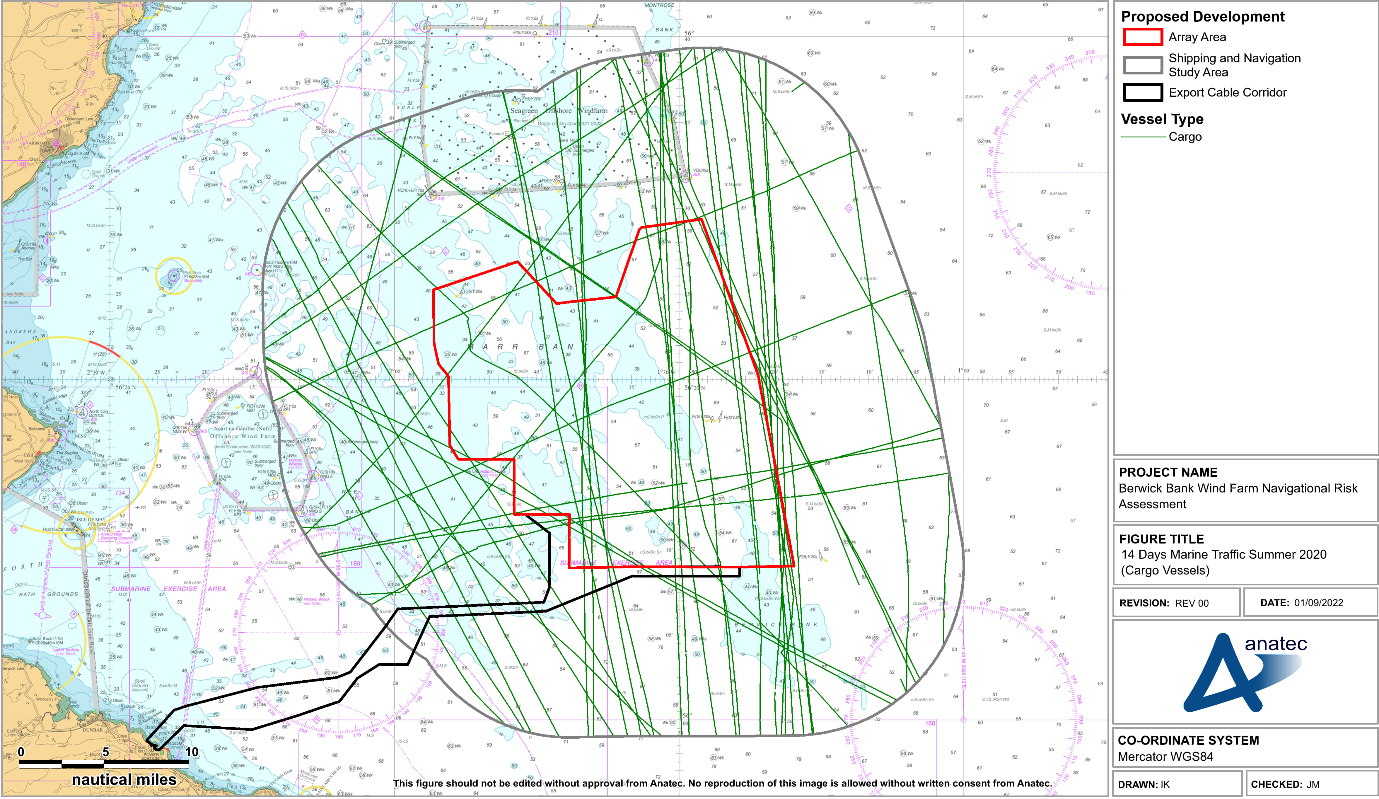
Figure F.4 14 Days Vessel Traffic Summer 2020 (Cargo Vessels)
Throughout the summer 2020 survey period an average of four unique cargo vessels per day were recorded within the Proposed Development array area shipping and navigation study area.
F.2.2 Tankers
The tracks of tankers recorded within the Proposed Development array area shipping and navigation study area throughout the summer 2020 survey period are presented in Figure F.5
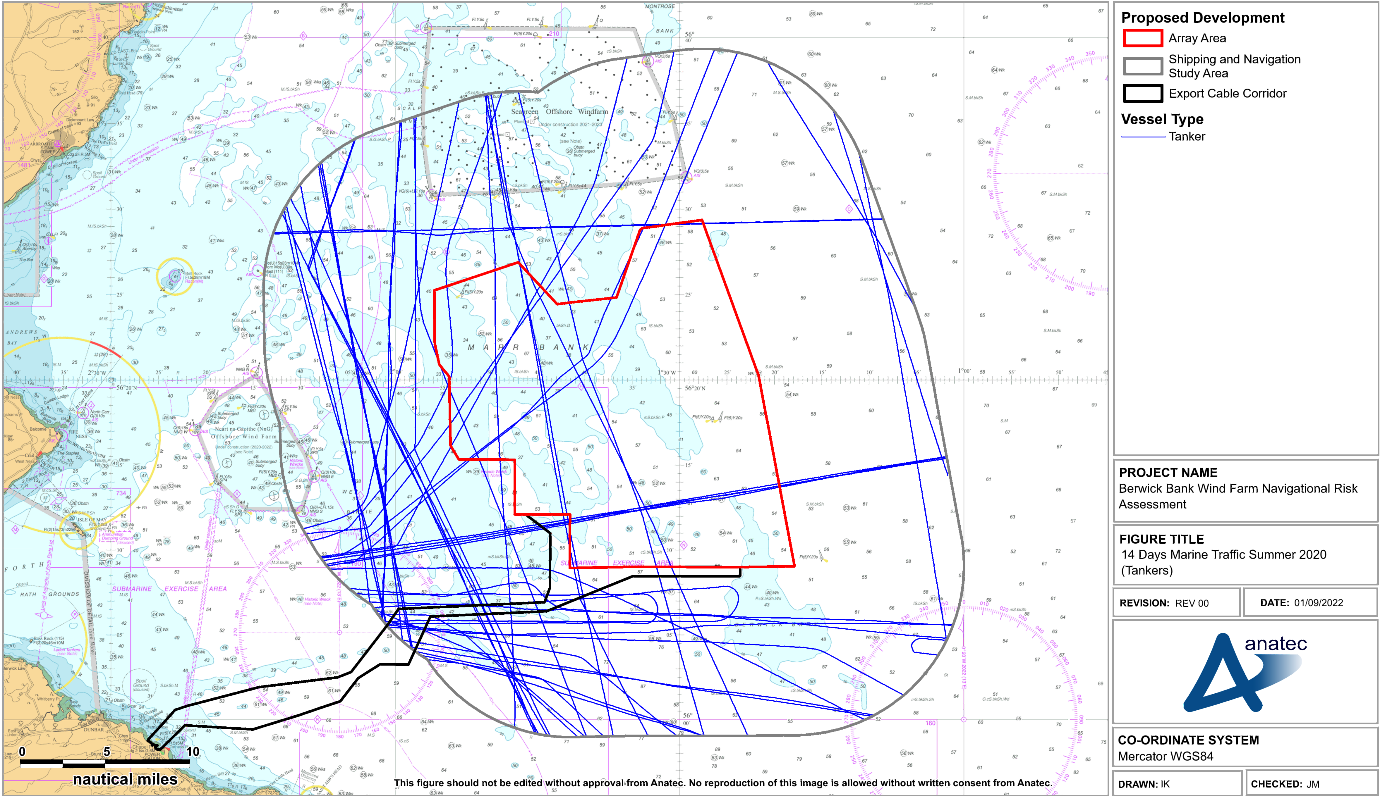
Figure F.5 14 Days Vessel Traffic Summer 2020 (Tankers)
Throughout the summer 2022 survey period an average of four unique tankers per day were recorded within the Proposed Development array area shipping and navigation study area.
F.2.3 Commercial Fishing Vessels
The tracks of commercial fishing vessels recorded within the Proposed Development array area shipping and navigation study area throughout the summer 2020 survey period are presented in Figure F.6.
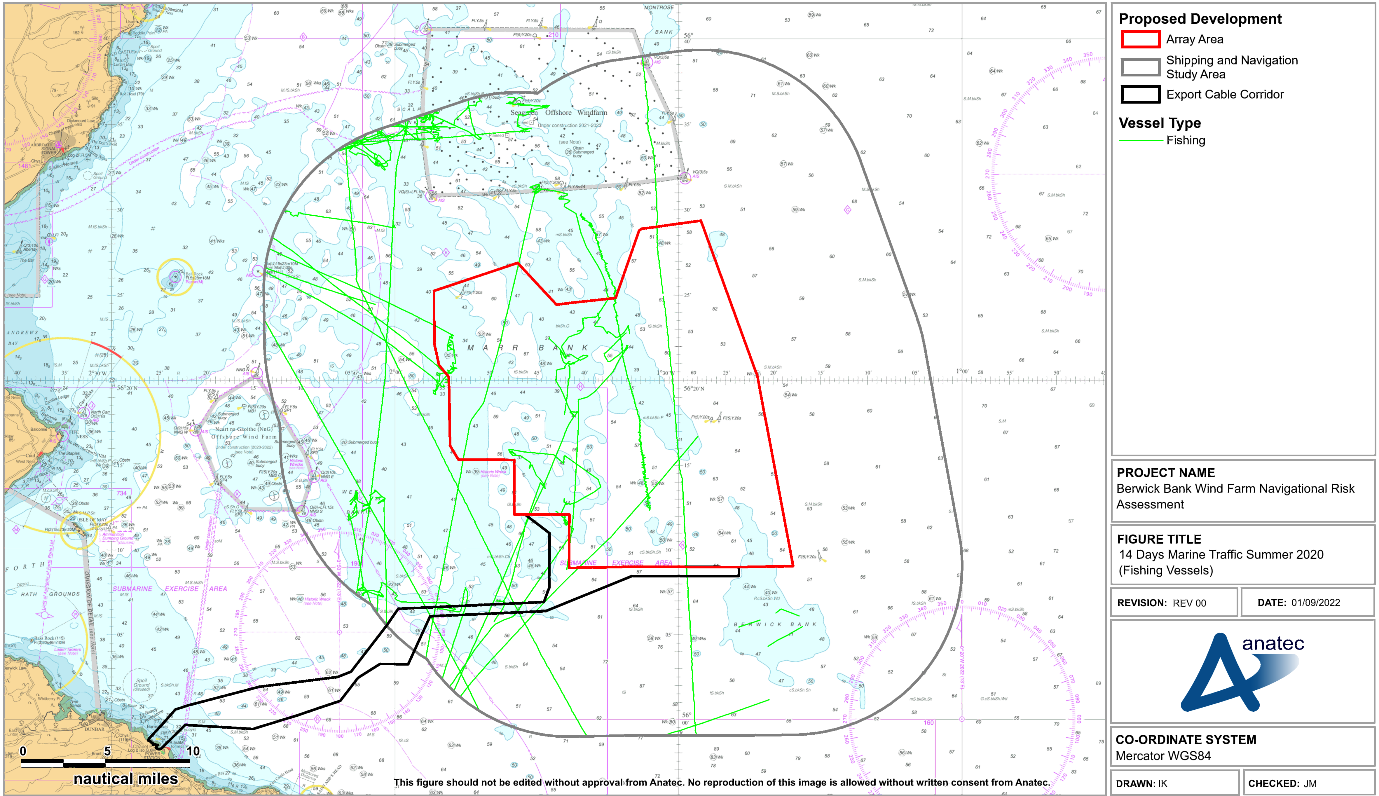
Figure F.6 14 Days Vessel Traffic Summer 2020 (Commercial Fishing Vessels)
Throughout the summer 2020 survey period an average of four unique commercial fishing vessels per day were recorded within the Proposed Development array area shipping and navigation study area.
F.2.4 Oil and Gas Vessels
The tracks of oil and gas vessels recorded within the Proposed Development array area shipping and navigation study area throughout the summer 2020 survey period are presented in Figure F.7.
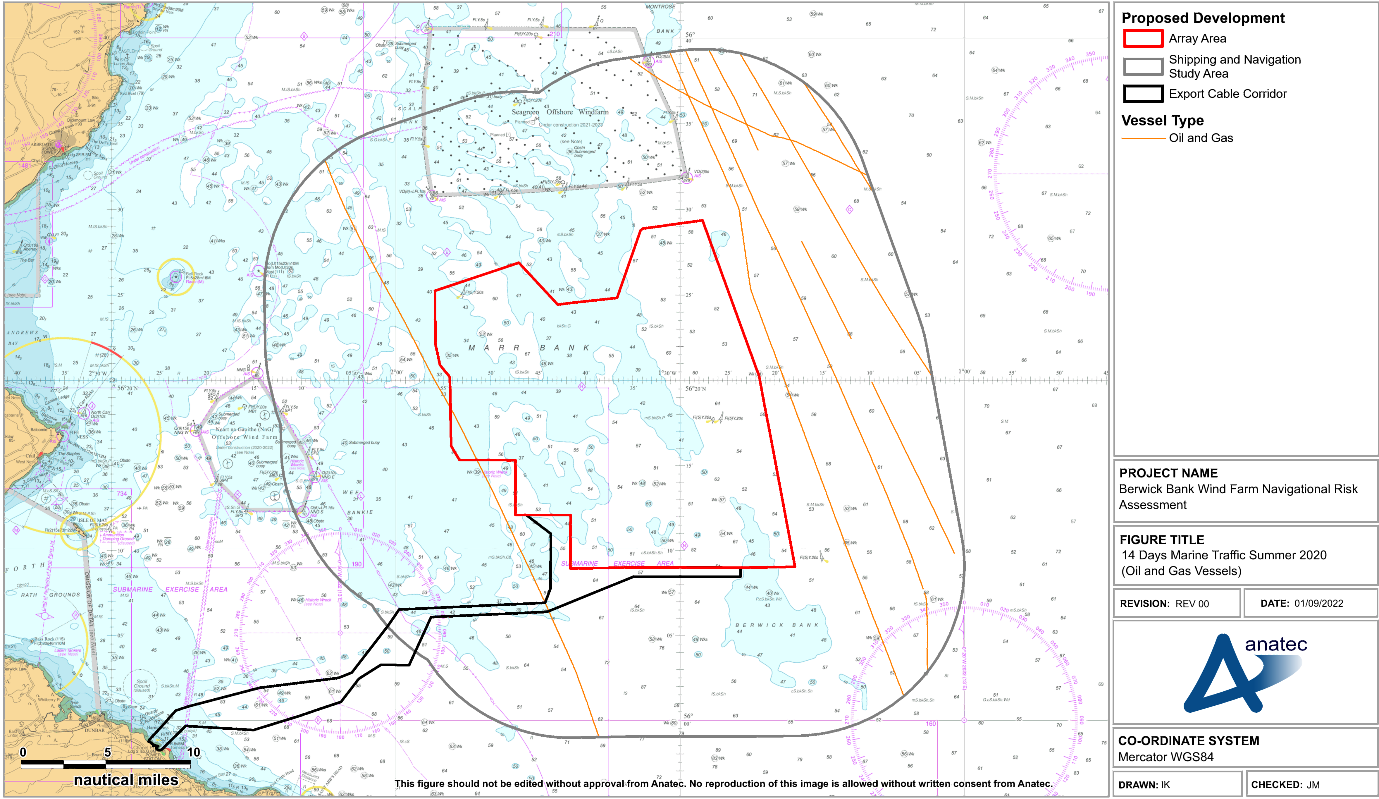
Figure F.7 14 Days Vessel Traffic Summer 2020 (Oil and Gas Vessels)
Throughout the summer 2020 survey period an average of four unique oil and gas vessels per day were recorded within the Proposed Development array area shipping and navigation study area.
F.2.5 Recreational Vessels
The tracks of recreational vessels recorded within the Proposed Development array area shipping and navigation study area throughout the summer 2020 survey period are presented in Figure F.8
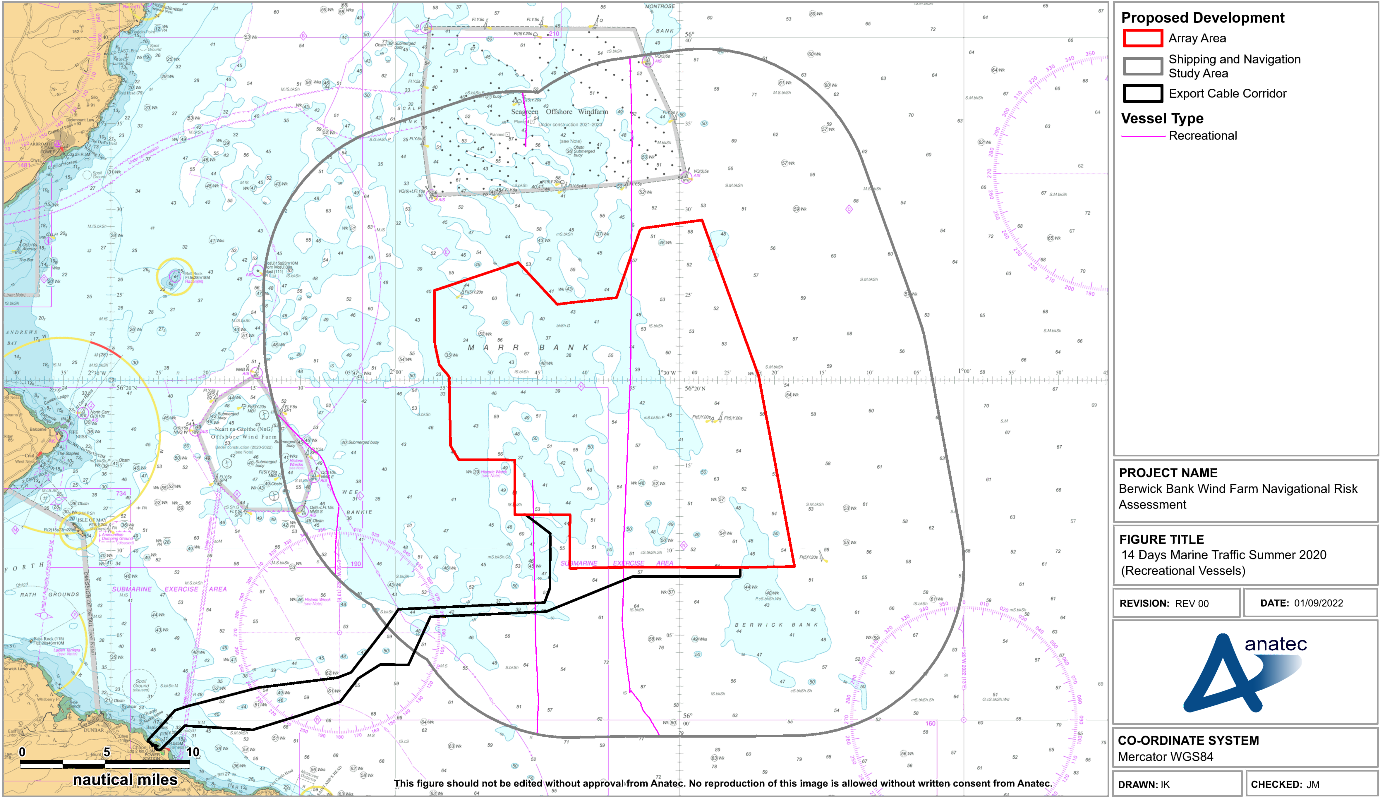
Figure F.8 14 Days Vessel Traffic Summer 2020 (Recreational Vessels)
Throughout the summer 2020 survey period an average of four unique recreational vessels per day were recorded within the Proposed Development array area shipping and navigation study area.
The following section details vessel traffic within the Proposed Development array area itself. The distribution of vessel types within the Proposed Development array area is presented in Figure F.9.

Figure F.9 Vessel Type Distribution within Proposed Development Array Area (14 Days Summer 2020)
The most common vessel types recorded within the Proposed Development array area were cargo vessels (42%), followed by tankers (23%), and commercial fishing vessels (12%).
It can be seen from Figure F.9 that significant levels of commercial activity were observed within the Proposed Development array area. On average, two cargo vessels and one tanker per day passed through the Proposed Development array area.
Survey data recorded during 14-day periods in August 2022 and January 2021 were collected using a combination of AIS, radar, and visual observations. This subsection provides comparison of the 28-day survey period (summer and winter combined) against the summer 2020 survey data.
A comparison of the average number of each main vessel type recorded during the summer 2020 survey data period and the 14-day survey periods is presented in Table F.1.
Table F.1 Average Daily Vessel Counts by Type for the 14-Day Survey Periods
Vessel Type | Summer 2020 | Winter 2021 | Summer 2022 |
|---|---|---|---|
Tankers | 4 | 5 | 4 |
Cargo vessels | 4 | 4 | 3 |
Commercial fishing vessels | 2 | 3 | 1-2 |
Oil and gas vessels | 0-1 | 1 | 0-1 |
Recreational vessels | 0-1 | 0 | 1 |
Passenger vessels | 0 | 0 | 1-2 |
The average daily vessel count within the summer 2020 survey data was broadly similar to the summer 2022 survey data, and slightly lower than for the winter survey periods. As with the winter 2021 dataset there were no passenger vessels recorded in the summer 2020 data, which is likely related to the COVID-19 pandemic.
F.5 Conclusion
14 days of AIS, Radar, and visual observation data during summer 2020 has been analysed to validate the winter 2021 and summer 2022 vessel traffic survey data recorded within the Proposed Development array area shipping and navigation study area.
The main type of vessels detected within the Proposed Development array area shipping and navigation study area during summer 2020 were tankers (33%), followed by cargo vessels (32%) and fishing vessels (15%). Similarly, main vessel types detected during the winter 2021 period were cargo vessels (36%), tankers (32%), and fishing vessels (16%). During summer 2022, the most common vessel types were cargo vessels (30%) and tanker (23%), with increased passenger vessel numbers seen (12%) – fishing vessel numbers remained relatively high however (11%). Overall, the vessel types detected within the Proposed Development array area study area were similar between the vessel traffic survey data and summer 2020 data.
[1] It is noted that contact was also sought for Princess Cruises and Viking Ocean Cruises but neither was able to be reached.
[2] The Project is an amalgamation of two previously proposed and separate offshore wind farms – Berwick Bank Wind Farm and Marr Bank Wind Farm, which were initially to be located next to each other in the Firth of Forth Zone. An Offshore EIA Scoping Report for the 2020 Berwick Bank was shared with stakeholders in August 2020 and a corresponding Scoping Opinion was received in March 2021. The amalgamated Berwick Bank Wind Farm is assessed in this NRA. A new Scoping Report was issued to MS-LOT in October 2021, but a Scoping Opinion has not been published by MS-LOT at the time of writing. The content of the Scoping Opinion for the 2020 Berwick Bank is considered relevant, but not directly applicable for the Proposed Development.
[3] In the event that the Project brings forward a single line of orientation layout post-consent, it is acknowledged that additional assessment will be required in line with MGN 654 requirements. This includes the undertaking of a safety justification to demonstrate that risk to navigation and SAR is ALARP, in consultation with the MCA.
[4] Assuming that a cable repair vessel or excavator/backhoe dredger are not required more than once per year.
[5] The closest distance to the final array layout for Seagreen is approximately 2.3 nm measured from the centre of the closest structure location. A final array layout for Inch Cape has not yet been published.
[6] Reported to an accident investigation branch or an anonymous reporting service. Unconfirmed incidents have not been considered noting that to date only one further alleged incident has been rumoured but there is no evidence to confirm.
[7] Hamburg is identified as the leading destination for the route, noting that there are alternative destinations in the North Sea.
[8] The summer period has been given priority over the winter period where there are differences in vessel traffic movements resulting from the construction of Seagreen given that these changes are reflective of the baseline to be expected post construction of Seagreen.
[9] The cumulative screening of the Cambois connection is based on information presented in the Scoping Report submitted in October 2022.
[10] The minimum blade clearance will be 37 m above LAT as outlined as part of the maximum design scenario in Section 6.2.2.
[11] NLB are currently minimising use of Intermediate Peripheral Structures (IPS) which have typically been used for nearshore developments in the past.
[12] The hazard log is the outputs of the Hazard Workshop and feeds into the final assessment of risk contained within Table 18.1 Open ▸ .
[13] Four vessels side by side equates to three gaps between vessels, so two times 131 m three times totalling 786 m.
[14] As per SI 2007 No 1948 “The Electricity (Offshore Generating Stations) (Safety Zones) (Application Procedures and Control of Access) Regulations 2007.
[15] For the purposes of this assessment, UK waters is defined as the UK Exclusive Economic Zone (EEZ) and UK territorial waters refers to the 12 nm limit from the British Isles, excluding the Republic of Ireland.