

EXECUTIVE SUMMARY
- Effects of the Project on climate through greenhouse gas (GHG) emissions; and
- Vulnerability and resilience of the Project to climate change.
The effects of the Project in combination with anticipated future climate change on relevant environmental receptors, i.e. potential in-combination climate impacts (ICCI), are included in annex A to the Climate Assessment Report (volume 4, appendix 5.2, annex A).
EFFECTS OF THE PROJECT ON CLIMATE THROUGH GHG EMISSIONS
This report provides an assessment of the likely significant effects of the Project on climate through GHG emissions. This Effects on Climate assessment has been undertaken in accordance with the Institute of Environmental Management and Assessment (IEMA) (2022) Environmental Impact Assessment Guide to: Assessing Greenhouse Gas Emissions and Evaluating their Significance.
The UK Government is legally bound to achieve net zero carbon emissions by 2050 and the Scottish Government has a statutory target to achieve this by 2045. ‘Net zero’ means that the total GHG emissions produced would be equal to or less than the amount removed from the atmosphere, through a combination of GHG emission reduction and removal. The UK Government has introduced a series of carbon ‘budgets’ for five-year periods, which act as stepping-stones to achieve the overall reduction in GHG emissions by 2050. The five-year budgets are currently set up to 2037.
The baseline for GHG emissions is a ‘do nothing’ scenario whereby the Project is not implemented. The site for the Project is comprised of the offshore Proposed Development (as described in the Offshore EIA Report, Overarching Glossary, volume 1, chapter 1)[1] and the onshore Proposed Development (as described in the Onshore EIA Report; Overarching Glossary, volume 1, chapter 1)[2]. There are minor GHG emissions associated with the ‘do nothing’ scenario. As such, for the purposes of this assessment, a conservative GHG emissions baseline of zero is applied, which represents a robust conservative scenario.
The Project will produce approximately 505,589,525 MWh of low carbon electricity during its 35-year operation and maintenance phase. Over its lifecycle the Project will produce an emission intensity of 15 gCO2e/kWh. The electricity generated by the Project will save 9,178,312 tCO2e from being emitted into the atmosphere that would otherwise have been emitted from conventional, higher carbon emitting forms of energy generation (i.e. fossil fuels). When construction phase GHG emissions are included (6,226,793 tCO2e), the Project will save 2,951,519 tCO2e from being emitted into the atmosphere over its lifecycle. The Project will not contribute more than 0.24% to any currently forecast UK carbon budget.
It will take the Project 8 years and 2 months to ‘pay back’ the GHG emissions relating to the construction phase from the start of operation. This ‘payback’ period is in line with both the UK and Scottish governments’ net zero ambitions as the carbon savings will start in 2036. Due to the carbon savings that the operation and maintenance phase will produce from low carbon electricity generation, the Project is assessed as having a significant beneficial effect on the climate.
It should be noted that the projected carbon savings are likely to be greater than predicted in this assessment as it uses a publicly available load factor from RenewableUK, that is based on performance of existing offshore wind turbines. However this load factor is expected to increase in the future due inclusion of actual site wind data measurements, improvements in wind turbine technology and associated operation and maintenance activities that are included in the load factor.
The implementation of the Cambois connection, which is related to the Project but will be consented separately, will be dependent on the completion of the Project. Therefore, the estimated GHG emissions resulting from the Cambois connection have been assessed cumulatively with the GHG emissions from the Project.
The Cambois connection is estimated to produce an additional 337,953 tCO2e during its construction phase. It is assumed that there are no operational GHG emissions associated with the transmission of electricity along the route.
As the construction phase for the Cambois connection takes place entirely during the 5th UK carbon budget (2028-2032), the total GHG emissions from the Project and the Cambois connection will be 4,523,604 tCO2e during this budget. Together, the projects will contribute 0.26% to the 5th UK carbon budget. These GHG emissions will not materially affect the UK or Scottish governments from achieving their net zero targets.
The Project’s significant beneficial effect on the climate during the operation and maintenance phase is also not changed when taking the Cambois connection into account, nor is the overall significant beneficial effect of the Project on the climate during its lifetime.
VULNERABILITY OF THE PROJECT TO CLIMATE CHANGE
This report also provides an assessment of the vulnerability of the Project to climate change, including:
- An examination of the current climate baseline using the UK Met Office’s latest regional dataset of 30-year averages and data from a nearby long running meteorological station (UKCP18 data);
- A consideration of the projected future climate baseline for the period 2061-2080;
- An assessment of how the Project may be vulnerable to the impacts of climate change during its construction and operation and maintenance phases;
- Identification of specific mitigation to adapt the design and operational processes to reduce the Project’s potential vulnerability to climate change; and
- An assessment of the residual climate change vulnerability of the Project that considers potential vulnerability impacts by quantifying their likelihood and consequence of each potential vulnerability.
The examination of climate projections has confirmed that the Climate Vulnerability study area’s climate is expected to change in the future. This assessment finds that the Project could be vulnerable to potential impacts linked to these changes in the climate. Impacts on three receptor groups are considered for this assessment, they are: Project assets (offshore and onshore), energy production, and staff wellbeing, including health and safety. The Applicant has designed the Project to withstand anticipated future climate change. Embedded mitigation measures that avoid potential impacts, minimise them or reduce their consequences to an acceptable level are therefore presented. After consideration of these mitigation measures, none of the potential Climate Vulnerability impacts are found to be significant adverse.
1. INTRODUCTION
1. INTRODUCTION
This document presents the assessment of the likely significant effects of the Berwick Bank Wind Farm offshore and onshore infrastructure (hereafter referred to as “the Project”) on climate through greenhouse gas (GHG) emissions (Effects on Climate). This document also presents the assessment of the Project’s vulnerability and resilience to climate change (Climate Vulnerability).
Human activities contribute to GHG emissions, such as carbon dioxide (CO2) to the atmosphere, primarily by the combustion of fossil fuels. GHGs trap heat in the atmosphere, with higher concentrations leading to increasing global temperatures. Atmospheric CO2 concentrations now exceed 400 parts per million for the first time in around 3 million years (The Royal Society, 2020), and increased GHG emissions have led to global average surface temperatures of 1°C higher than pre-industrial levels (World Meteorological Organisation (WMO), 2021). There is a global consensus on the need to tackle climate change and for accelerating GHG emissions reductions (Climate Change Committee (CCC), 2021). The impact of climate change is already being felt around the world with changing rainfall patterns and rising sea levels, increasing the risk of heatwaves, floods, droughts and fires, and has already caused damage to ecosystems, people, settlements and infrastructure (Intergovernmental Panel on Climate Change (IPCC), 2022).
Climate change requirements are outlined in the Electricity Works (Environmental Impact Assessment) (Scotland) Regulations 2017; the Marine Works (Environmental Impact Assessment) (Scotland) Regulations 2017; the Marine Works (Environmental Impact Assessment) Regulations 2007; and the Town and Country Planning (Environmental Impact Assessment) (Scotland) Regulations 2017, which state that the assessment should consider the likely significant effects of the Project arising from:
- The impact of the Project on climate (GHG emissions); and
- The vulnerability of the Project to climate change and the impacts relevant to adaptation.
The effects of the Project in combination with anticipated future changes to the climate on environmental receptors (an in-combination climate change impacts assessment) has also been undertaken in accordance with IEMA Guidance (IEMA, 2020).
The potential impact of the Project on climate, as a result of GHG emissions during construction and operation and maintenance, is termed Effects on Climate.
The vulnerability of the Project to climate change, in particular the impacts of extreme weather caused by climate change during construction and operation and maintenance, and adaptation to mitigate the effects of these impacts, is termed Climate Vulnerability.
The potential effects of the Project in combination with anticipated future climate change on relevant environmental receptors is termed in-combination climate impacts (ICCI). The potential ICCI of the Project and anticipated further climate change are presented in annex A to this report (volume 4, appendix 5.2, annex A).
1.1. PURPOSE OF THE ASSESSMENT
The Effects on Climate and Climate Vulnerability assessments have been undertaken in accordance with the following IEMA guidance:
- Assessing Greenhouse Gas Emissions and Evaluating their Significance, February 2022 (IEMA,2022); and
- Environmental Impact Assessment Guide to Climate Change Resilience & Adaptation, June 2020 (IEMA,2020).
This assessment:
- Sets the scope and boundaries of the Effects on Climate and Climate Vulnerability assessments;
- Presents the existing environmental baseline and the future baseline for both the Effects on Climate and Climate Vulnerability assessments;
- Identifies assumptions and limitations in compiling the environmental/climate information;
- Presents the likely significant effects on the climate arising from the Project through GHG emissions, and the effects of climate change on the Project; and
- Highlights any mitigation measures which are recommended to prevent, minimise or reduce the likely significant effects of the Project on the climate, and any measures which are recommended to be taken by the Project in addition to any measures already designed into the Project to prevent, minimise or reduce to acceptable levels any likely significant effects on the Project from climate change.
1.2. CONSULTATION
A meeting was held with East Lothian Council to present the method and the interim findings of the Effects on Climate and Climate Vulnerability assessments (March 2022). The Council did not have any comments to be addressed.
Responses to the offshore Scoping Report (SSER, 2021) relevant to carbon are provided in Table 1-1 Open ▸ .
Table 1-1 – Scoping Comments (Offshore Scoping Opinion, MS-LOT, February 2022)
In relation to flood risk and drainage design a detailed Flood Risk Assessment (FRA) has been prepared as part of the Onshore EIA Report. It has been completed in accordance with guidance presented within Scottish Planning Policy (SPP), the National Planning Framework for Scotland 3 (NPF3) and taking cognisance of the Flood Risk Management (Scotland) Act 2009. The assessment also takes due consideration of the revised draft National Planning Framework for Scotland 4 (NPF4) which was laid before the Scottish Parliament in November 2022 and is currently under consultation. The FRA uses the latest climate change allowances published by SEPA (2022). Consultation has been undertaken with SEPA on the FRA to agree its scope and specific approaches regarding:
- Assessment of the baseline flood risk; and
- Assessment of the with-scheme conditions to evaluate the impacts and determine any additional mitigation.
2. POLICY & LEGISLATIVE CONTEXT
2. POLICY & LEGISLATIVE CONTEXT
Policy and legislation specifically in relation to climate are provided in Table 2-1 Open ▸ . UK carbon reduction targets and carbon budgets are provided in Table 2-2 Open ▸ and Scotland carbon reduction targets are provided in Table 2-3 Open ▸ .
Table 2-1 – Summary of Legislation and Policy Relevant to Climate
Table 2-2 – UK Carbon Reduction Targets as Set in Carbon Budget Orders 2009, 2011, 2016 and 2021
Table source: Advice on reducing the UK’s emissions - Climate Change Committee (theccc.org.uk)
Table 2-3 – Scotland Carbon Reduction Targets as Set by Climate Change (Emissions Reductions Targets) (Scotland) Act 2019
Table source: Climate change: Reducing greenhouse gas emissions - gov.scot (www.gov.scot) Note: There are yearly carbon reduction targets up until 2045. They are not shown here to reduce table length.
3. EFFECTS ON CLIMATE
3. EFFECTS ON CLIMATE
3.1. STUDY AREA
The Effects on Climate study area includes the Project, all carbon emitting activities within the site, relevant carbon emitting activities beyond the site boundary that contribute to the total carbon footprint of the site area (e.g. production of construction materials) and energy generation from alternative sources.
Effects on Climate is a wide-ranging topic in terms of potential sources, both originating at the Project and from much further afield and is not limited to the geographic extent of the Project.
3.2. BASELINE
3.2.1. METHODOLOGY TO INFORM BASELINE
The baseline conditions for the Effects on Climate assessment are informed by the total background emissions of GHGs from all sources, i.e. all UK and Scottish GHG emissions, as provided by national statistics. In addition, baseline environmental characteristics for the Project with specific reference to GHG emissions are provided for the existing situation and in the future, assuming the Project is not constructed.
3.2.2. National GHG emissions
As of May 2022, the UK is the world’s fifteenth largest emitter of carbon dioxide equivalent[3] (CO2e), with the total UK emissions for 2020 (last reported year) being 406 million tonnes (Mt) CO2e (BEIS, 2022a). Provisional figures have been released for 2021, with the total UK emissions for 2021 being 424.5 Mt CO2e (BEIS, 2022b).
The UK has in place carbon budgets for five-year periods up to 2037, as shown in Table 2-2 Open ▸ . Whilst budgets have not yet been set beyond 2037, there is a legal requirement for the UK to reach net zero emissions by 2050, as set in the Climate Change Act 2008 and for Scotland to reach net zero emissions by 2045 as set in the Climate Change Scotland Act 2009 (as amended by the Climate Change (Emissions Reduction Targets) (Scotland) Act 2019).
3.2.3. Regional GHG emissions
The total GHG emissions for Scotland for 2020 (the last reported year) were 40.0 MtCO2e (Scottish Government, 2022a).
Scotland has a legislated target to achieve net zero by 2045. To help the delivery of this long-term target, Scotland’s climate change legislation also includes annual targets for every year until 2045 (see also Table 2-3 Open ▸ ). This includes a target of a 71.2%[4] reduction in GHG emissions from the 1990 baseline emissions by 2028 (first partially operating year of the Project). This percentage reduction increases by 1.5% each year until reaching a 90% reduction in 1990 baseline emissions by 2040. It then increases by 2% each year until reaching a 100% reduction in GHG emissions by 2045, i.e. net zero.
In 2020, 61.8% of Scotland’s electricity generation came from renewable energy sources with a total of 12.1 GW of installed capacity across the country, largely from onshore wind and hydroelectric power (Scottish Government, 2022b).
3.2.4. Site specific baseline GHG emissions
Currently the onshore Proposed Development (Onshore EIA Report; Introduction, volume 2, Figure 5.1) is in agricultural use and spans three large fields that are primarily used for growing crops. The current agricultural use of the land within the site has minor levels of associated GHG emissions. Baseline GHG emissions are dependent on soil and vegetation types And present and fuel use for the operation of agricultural vehicles and machinery. As the current onshore GHG emissions are unknown, it is assumed that baseline emissions are zero to apply a worst-case scenario.
The total current baseline emissions are unknown but are considered to be negligible when compared to the construction GHG emissions resulting from the Project. Therefore, for the purposes of the assessment, a conservative GHG emissions baseline of zero is applied, which represents a robust worst-case approach.
3.2.5. Future baseline scenario
If the Project is not constructed, the current agricultural use of the onshore Proposed Development would likely continue. Offshore, the MPA is considered likely to continue in its current state unless any other development comes forward that may impact it. The vessel movements that currently occur within the offshore Proposed Development will continue along the current routes that exist, taking into account any changes caused by the construction of the Seagreen Wind Farm to the north. A robust, conservative approach estimates that total vessel traffic will grow by 20% by 2050 (Offshore EIA Report, volume 2, chapter 13, Section 13.7.2).
As mentioned in section 3.2.2 the emissions factor for UK energy generation is projected to continuously decrease until 2049 when it reaches 0.006 kgCO2e/kWh. This rate of decrease is based on a variety of factors and is altered every year based on changes in policy, current energy generation capacity, economics and planned projects. The projection would remain similar in future years, without the Project, and would only be materially impacted by large scale changes in government policy, geopolitical events or economic issues.
3.3. ASSESSMENT METHODOLOGY
The potential impacts of GHG emissions are very specific in terms of receptors and impacts because:
- There is only one receptor, the atmosphere, which is non-site-specific;
- There is only one direct impact, global warming, which is also non-site-specific; and
- All units of CO2e can be considered to have the same impact no matter where they are emitted.
Therefore, assessment of the effects of the Project on climate is limited to quantification of the magnitude of GHG emissions, from individual sources and in total, and comparisons of these to the baseline. Different GHGs have different global warming potentials, and to account for this they will be reported throughout this assessment as their CO2e value.
3.3.1. GUIDANCE
The assessment has been undertaken in accordance with the following guidance:
- IEMA (2022) Environmental Impact Assessment Guide to: Assessing Greenhouse Gas Emissions and Evaluating their Significance; and
- PAS 2080: Carbon Management in Infrastructure.
3.3.2. IMPACTS TO BE ASSESSED
Table 3-1 presents the elements included in the Effects on Climate assessment, including their data sources.
Table 3-1 – Elements Included in the Assessment
Table 3-2 Open ▸ presents the elements not included in the assessment, and the justification for their exclusion. The elements excluded are not anticipated to materially affect the outcomes resulting from this assessment. This is in line with a proportionate approach which considers that where expected GHG emissions are less than 1% of total GHG emissions they can be excluded from assessment, provided that the combined exclusions are not more than a maximum of 5% of total GHG emissions, in accordance with IEMA guidance.
Table 3-2 – Elements Not Included in Assessment
3.3.2.1. GHG Emissions Resulting from the Loss of Blue Carbon
The Scoping Opinion (MS-LOT, 2022) and advice from Marine Scotland Science (MSS) as part of the scoping process requested that the Applicant undertake an evaluation of the potential loss of carbon sequestered into marine sediments within the footprint of the offshore Proposed Development.
The surficial sediments (i.e. top 10 cm of sediment) of the mapped extended Scottish Exclusive Economic Zone (EEZ), an area of approximately 554,755 km2, holds an estimated 1,515 ± 252 Megatonnes (Mt) of carbon. The majority of this carbon is in the form of calcium carbonate (CaCO3), with an estimated 1,294 ± 161 Mt of inorganic carbon being held within the surficial sediments (Smeaton et al., 2020). A significantly lower quantity of carbon in these surface sediments is stored in the organic form, with an estimated 221 ± 92 Mt of organic carbon currently held within the top 10 cm of sediment within Scotland’s mapped extended EEZ (Smeaton et al., 2020).
One of the challenges in assessing blue carbon is the lack of agreed or consistently applied terminology, and the differences in timescales when discussing carbon sequestration (Burrows et al., 2017). For example, for fine grained sediments the relative proportion of inorganic carbon and organic carbon in these sediments varies greatly, depending on the rate at which organic carbon is remineralised and recycled as carbon dioxide or buried within the sediment, and the rate at which carbonate containing phytoplankton are deposited as detritus (Burrows et al., 2017). The offshore Proposed Development is located across a wide range of different seabed types including areas of hard substrate including rock, areas of boulders and cobbles. Where sediment is present the composition of sediment ranges from sandy gravel to muddy sand, with 36% of samples taken as part of site-specific surveys classified as slightly gravelly sand (see Benthic Subtidal and Intertidal Ecology Technical Report in the offshore EIA, volume 3, appendix 8.1). Therefore, given the range of habitat types and uncertainty in organic content, it makes undertaking a meaningful assessment challenging, particularly given that the specific locations and nature of construction activities will not be known until post consent following detailed design work. Whilst an assessment for blue carbon loss could be undertaken for a worst case scenario by considering the carbon levels in sediments within the offshore Proposed Development array area and in the offshore Proposed Development offshore export cable corridor, despite the associated uncertainty around carbon levels in sediments, the locations for offshore components and installation methods are highly relevant for carrying out a meaningful assessment because of the sediment types impacted.
It should however be noted that survey samples taken within the offshore Proposed Development benthic and subtidal study area (see figure 3.5 in volume 3, appendix 8.1) were tested for Total Organic Carbon (TOC) as the amount of carbon found in a sediment sample is often used as a non-specific indicator of water quality (rather than for the purpose of evaluating carbon sequestration). Levels of TOC were low (<1%) across all samples, except for one sample which was still <5%, which may indicate that the offshore Proposed Development site is not particularly important for carbon sequestration. Further detail is provided in the Benthic Subtidal and Intertidal Ecology Technical Report (Offshore EIA Report, volume 3, appendix 8.1).
The maximum area of the offshore Proposed Development site is 1,178.1km2 within which all offshore Proposed Development infrastructure will be located. This constitutes a very small proportion (less than 0.2%) of the Scottish EEZ, that are used in Smeaton et al. (2020) to calculate the availability of carbon in Scottish Waters. Furthermore, the actual area which may be impacted by construction activities which may result in the disturbance of sediment and the release of carbon into the water column is significantly smaller (approximately 114 km2; see Benthic and Subtidal Ecology chapter in volume 2, chapter 8). Therefore, set in the context of the wider marine environment, the offshore Proposed Development has limited potential for the release of sediment containing carbon in into the marine environment.
The physical processes chapter (volume 2, chapter 7) has assessed the potential for the increase in suspended sediment concentrations (SSC) and sediment deposition as a result of the offshore Proposed Development. It is considered that the impact of increased suspended sediment levels and associated sedimentation is predicted to be of local spatial extent, short term duration, intermittent and of high reversibility. Following suspension of material, it is predicted that a significant amount of sediment will be redeposited within the boundary of the offshore Proposed Development in close proximity to the release site, with further redistribution of sediment occurring during proceeding tides, retaining sediment within the area it originated from. No significant effects were concluded in EIA terms. The chapter also considers the potential alteration to hydrodynamics i.e. waves, tides and sediment transport which may result in indirect release of sequestrated carbon but similarly the effects were assessed as either negligible or negligible to minor and not significant in EIA terms.
An evaluation of blue carbon and possible effects in carbon has been undertaken including the consideration of:
- Uncertainty around carbon levels in sediments and the lack of information available on the level of carbon stored within sediments within the footprint of the offshore Proposed Development and the potential significant variability across the offshore Proposed Development site;
- The relatively small footprint and local scale of impacts of the offshore Proposed Development when set in the broader marine environment and therefore limited potential for significant release of carbon from sediments;
- Uncertainty at pre-application stage on the detailed design of the offshore Proposed Development including locations and final installation methods and therefore which sediment types may be disturbed during construction, which is highly relevant for a meaningful assessment; and
- Non-significant effects in EIA terms of SSC and deposition and alterations to hydrodynamics, with significant volumes of sediment being redeposited within the offshore Proposed Development boundary and retained within the spatial area.
Based upon the above, it is considered the contribution from release of carbon from marine sediments is negligible and hence has not been further considered in the Effect on Climate assessment. There is no indication that the sediments within the offshore site boundary are of particular importance for carbon storage (and to the contrary TOC analysis indicates carbon levels are low), the disturbance of sediment is of local scale, temporary and of short duration with much of the disturbed sediment being redistributed and retained in the local area.
3.3.3. CALCULATING CONSTRUCTION GHG EMISSIONS
This section applies to the construction phase of both the onshore Proposed Development and offshore Proposed Development of the Project unless otherwise stated.
The data for the assessment has been provided by the Applicant and is up to date for this stage of the design. As the Applicant follows the Project Design Envelope (PDE) approach for both the offshore EIA (see volume 1, chapter 3) and onshore EIA (see volume 1, chapter 5), it should be noted that several options exist for various elements of the design (e.g. total number and size of wind turbines). The PDE approach applies a ‘maximum design scenario’ that considers a realistic range of Project parameters (or scenarios). The PDE describes a range of parameters that apply to a Project technology design scenario (e.g. largest wind turbine option).
Where there are several design options, the elements chosen in this assessment are those that are likely to create a reasonable worst-case scenario (i.e. lead to the highest quantity of GHG emissions) for the Project. This is to ensure that the assessment considers the greatest magnitude of impact as a result of constructing the Project, and that the final design option would not exceed the impacts that have been assessed.
A quantification of construction phase GHG emissions has been calculated using the Atkins’ Carbon Knowledgebase tool, which contains a detailed library of calculation formulae and over 1,000 emissions factors from authoritative sources such as the Inventory of Carbon and Energy (ICE, versions 1.6(a), 2.0 and 3.0) (Circular Ecology, 2022), the Department for Environment, Food and Rural Affairs (Defra) Greenhouse Gas Reporting Conversion Factors (Defra, 2022), and the EMEP/CORINAIR Emission Inventory Guidebook (EMEP/EEA, 2019). The tool calculates the construction phase emissions in accordance with PAS 2080: Carbon Management in Infrastructure, the international standard for assessing carbon emissions throughout a project’s lifecycle.
For the onshore Proposed Development, worst case assumptions over the material quantities have been made. This information will become available at the detailed design stage of the Project. It has been assumed that materials will be transported 100 km to the site. This is a robust and conservative assumption based on the likelihood that the majority of materials will be sourced from within the UK.
Several components of the offshore Proposed Development do not have a detailed design at this stage. Where it has not been possible to identify the material composition of Project components, conservative assumptions have been made. This includes basing wind turbine material volumes on the Vestas V164 9.5MW wind turbine, one of the largest wind turbines that exists in the market (Vestas, 2022). Assumptions regarding the construction phase GHG emissions are listed in Section 3.3.6.
It is not determined where the wind turbine elements will be produced or sourced from. Given the size and scale of the wind turbines, it is likely that all or some of the wind turbine elements will be produced outside of the UK. Due to its distance from the site, Asia was chosen as the worst case as the source for the wind turbine components. It is assumed that all elements are manufactured close to the coast and shipped directly to the offshore site.
As mentioned in section 3.2.4 there are several shipping routes running through or close to the offshore Proposed Development array area (see Offshore EIA Report, volume 2, chapter 13). To avoid collisions during the construction and operation and maintenance phase, these routes will be diverted. As part of the Navigational Risk Assessment (NRA) for the Offshore EIA Report (volume 3, appendix 13.1), vessel surveys were undertaken and new shipping routes have been determined and the length of diversion from the original routes have been calculated. The data from the January 2021 & June 2020 surveys have been extrapolated to provide an estimate of the GHG emissions resulting from the diversions. The August 2022 survey data were not used in the calculations but a review showed that the information from the surveys was similar and should not make a material difference to the outcome of the assessment. A decarbonisation rate has also been applied to these vessels since the sector is required to reach net zero by 2050[5]. This rate applies a steady, yearly decrease in GHG emissions from vessels.
3.3.4. CALCULATING OPERATION AND MAINTENANCE GHG EMISSIONS
The operation and maintenance phase of the Project has three key areas:
- Operational electricity production;
- Operational electricity, water, and material consumption; and
- Maintenance and repair.
The Project has a maximum generating capacity of 4.1 GW of electricity. However, due to a variety of factors, the Project will not operate at maximum generating capacity for the majority of the time. This is called the ‘Load Factor’ of the Project. The load factor for the Project is estimated to be 40.22% (RenewableUK, undated). This is considered to be the worst-case scenario as the efficiency of wind turbines has increased over time and is likely to continue to do so. The GHG emissions saved by the generation of renewable electricity has been calculated using the anticipated marginal emissions factor for 1kWh of national grid electricity generation for each operating year as projected by BEIS (BEIS, 2021). The factor for 2028 (first partially operating year of the Project) is calculated to be 0.156 kgCO2e/kWh decreasing to 0.063 kgCO2e/kWh in 2033 (first full operating year of the Project). This value decreases year-on-year until 2050 as the sources of energy generation across the country change.
Losses of energy from the transmission and distribution of the energy generated have not been calculated. This is due to the level of uncertainty and lack of data that exists for calculating such losses so far into the future. Additionally, such loses are not incurred solely due to the Project but also from the transmission and distribution across the National Grid to where the energy is required at that point in time and therefore would not provide a fair comparison of the carbon savings that the Project would provide.
The Project will consume electricity, water and materials during the operation and maintenance phase to maintain vital equipment, provide back-up emergency power, and support personnel operating on both offshore and onshore elements. The following elements of the design have known or estimated consumption values during the operation and maintenance phase:
- Wind turbine lubricants and emergency back-up fuel; and
- Offshore substation emergency back-up fuel.
The level of maintenance and repair that the onshore Proposed Development would require is unknown at this stage of the design. Due to the lack of certainty about the level of repair and maintenance required, the material emissions associated with this aspect have been scoped out of this assessment.
The level of maintenance and repair for the offshore Proposed Development has been extrapolated from data of the maintenance and repair of Beatrice and Greater Gabbard offshore wind farms, the latter of which has been operating for 10 years. From this data, the likely replacement of major components for the wind turbines (except for blades), all cables and offshore substation platforms has been estimated. The data has also been used to determine the number, type and trip frequency of vessels that will be used during this phase. A conservative estimate of 1% of all wind turbine blades requiring replacement over the 35-year lifespan of the Project has been applied.
The number of maintenance vessels and their respective trips has been calculated by the design team and modelled on the worst-case assumption that all these vessels will require diesel fuel to operate, but with a decarbonisation rate applied year on year as noted above in section 3.3.3.
It should be noted that the load factor for the production of electricity from the wind turbines (based on industry research) does include a maintenance and repair factor when being calculated.
A quantification of operation and maintenance GHG emissions has been calculated using the Atkins’ Carbon Knowledgebase tool, as described above in section 3.3.3.
3.3.5. Significance Assessment
The method of assessment of whether the calculated GHG emissions from the Project will have a significant effect on climate has been determined in accordance with IEMA’s 2022 guidance. There is no legal limit for GHG emissions for any one development. The guidance suggests that the level of significance should be related to how a project contributes to reducing GHG emissions relative to a comparable baseline consistent with a trajectory towards net zero by 2050, as stated in section 6.2 of the guidance: “The crux of significance…is not whether a project emits GHG emissions, nor even the magnitude of GHG emissions alone, but whether it contributes to reducing GHG emissions relative to a comparable baseline consistent with a trajectory towards net zero by 2050.”
The IEMA 2022 guidance document notes that practitioners need to consider whether project GHG emissions are aligned to achieving net zero by 2050, using the science based 1.5°C trajectory. Where this is not the case, then the effects are judged to be moderate adverse or major adverse, and thus can be classed as a significant effect. Projects that are compatible with the trajectory can have their effects classed as minor adverse, or where the project achieves GHG emission mitigation that goes beyond the trajectory, negligible. In both cases, the effects are not considered to be significant. Projects that result in GHG emissions being avoided or removed from the atmosphere can be considered to have a significant beneficial effect.
The percentage contribution of the Project to the national carbon budget has been determined in accordance with IEMA 2022 guidance on significance. Although the IEMA guidance suggests that for context, it would be good practice to consider a project’s GHG emissions in relation to sector-based targets, there are currently no sector budgets for electricity generation or any other sector, provided by the UK Climate Change Committee, the body responsible for developing the UK and devolved administrations’ carbon budgets. Sector-based targets have therefore not been considered in accordance with current UK legislation.
3.3.6. Limitations and Assumptions
The key limitation of the Effect on Climate assessment is the information available within the Project Design Envelope to enable estimations of GHG emissions at the time of the assessment. This has required assumptions to be made, and some industry standard data to be used as a proxy. The following assumptions have been made during the carbon assessment:
- Carbon factors are drawn from the Inventory of Carbon and Energy (ICE versions 2.0 and 3.0);
- The Project will start construction in 2025 and finish by Q4 2032;
- The first partial operation of the Project will commence in 2028, with the Project becoming fully operational in Q1 2033;
- The Project will be operational for 35 years;
- There will be a maximum of 239 wind turbines with an individual generating capacity of up to 18 MW. This wind turbine option is considered the worst-case scenario based on all the possible wind turbine options considered in the Offshore EIA Report. There would be no material change in the assessment outcome if another wind turbine option was used as part of the Effect on Climate assessment;
- The material composition and component weights of the wind turbines are referenced from the Vestas V164 9.5 MW offshore wind turbine (Vestas, 2022) and Smoucha et al. (2016);
- All wind turbine components are assumed to be manufactured in Asia under a worst-case scenario, and transported to the site via sea routes;
- The Project will have up to ten Offshore Substation Platforms/Offshore converter station platforms, eight weigh 2,500 tonnes each and 2 weighing up to 10,000 tonnes each;
- The load factor for the Project is assumed to be 40.22%. This is the current industry average for offshore wind (RenewableUK, undated)[6]. This is considered conservative and likely to increase in future due to inclusion of actual site wind data measurements, improvements in wind turbine technology and associated operation and maintenance activities that are included in the load factor. Hence the load factor for the Project is likely to be higher once the Project is operating;
- Data has been extrapolated from shipping surveys undertaken as part of the Navigational Risk Assessment for the offshore Proposed Development (volume 3, appendix 13.1) to inform part of the assessment. Surveys were undertaken in June 2020, January 2021 and August 2022. The June 2020 and January 2021 survey data were considered for the assessment. Survey data from August 2022 indicated that the August 2022 findings are not significantly different to those obtained in the previous survey;
- GHG emissions from shipping will decrease at a steady rate year-on-year until reaching net zero in 2050 due to the anticipated decarbonisation of shipping vessels in line with the UK government’s net zero legislation (UK Chamber of Shipping, undated);
- It is assumed as a worst case that all fuel used in vessels operating at the site will be diesel in the offshore Proposed Development’s first year of construction, and a year on year decarbonisation rate has been applied to these vessels as required to reach the UK Government’s net zero by 2050; and
- It is assumed that no wind turbine nacelle or tower components will need to be replaced during the operation and maintenance phase of the Project. A conservative estimate of 1% of all wind turbine blades requiring replacement over the 35-year lifespan of the Project has been applied.
3.4. Assessment
3.4.1. Construction
An assessment has been carried out based on the elements scoped into the assessment. The results in Table 3-3 Open ▸ and Table 3-4 Open ▸ provide the predicted GHG emissions arising from the Project.
The offshore Proposed Development is estimated to generate 6,226,793 tCO2e during the construction phase (2025 – 2032). The onshore Proposed Development construction phase is estimated to generate 33,769 tCO2e during the same period. In both cases the greatest GHG emissions are derived from the embodied carbon resulting from the production of the materials.
Table 3-3 – Offshore Proposed Development Construction Phase GHG Emissions
Table 3-4 – Onshore Proposed Development Construction Phase GHG Emissions
3.4.2. Operation and maintenance
An assessment has been carried out based on the elements scoped into the assessment. This includes the lubricants and fuel required to operate the offshore substation platforms and wind turbines, and the additional distance travelled by ships using the alternative shipping routes. These GHG emissions constitute the operation and maintenance phase GHG emissions and are shown in Table 3-5 Open ▸ . The Project is expected to operate for 35 years.
The consumption of materials during operation from the offshore Proposed Development is estimated to generate 5,197 tCO2e per year of operation. This will equate to 181,895 tCO2e during the entire operation and maintenance phase.
The GHG emissions resulting from the diversion of shipping routes would be 113,235 tCO2e in the first year of partial operation. GHG emissions are anticipated to decrease year-on-year for shipping in line with net zero targets for 2050. This assumes that the level of shipping on these routes stays at the same level as current.
Maintenance vessels will transit between port and site during the operation and maintenance phase of the Project. These vessels will begin this process in the first year of partial operation. During this first year, 12,500 tCO2e GHG emissions will be generated. It is assumed that the shipping sector will decarbonise at a steady rate in line with the UK Government’s net zero target and will be net zero by 2050.
Table 3-5 – Operation and Maintenance Phase GHG Emissions
Overall, the total GHG emissions resulting from the construction and operation and maintenance of the Project will be 7,638,930 tCO2e and are shown in Table 3-6 Open ▸ .
Table 3-6 – Project Lifecycle GHG Emissions
3.4.3. ELECTRICITY GENERATION
Due to the lower operational GHG intensity of the Project compared to the national grid GHG intensity projections, a net reduction in GHG emissions will be achieved as a result of the Project as offshore wind power is a less GHG intensive form of energy generation than the projected marginal generation in 2028 onwards, which includes a small residual amount of generation using unabated fossil fuels.
Electricity generation from the Project during the first full year of operation (when 4.1 GW of capacity is installed) is estimated to be 14,445,415 MWh. The Project is anticipated to produce 505,589,525 MWh of electricity over its 35-year operation and maintenance phase.
The average operational GHG intensity of the Project has been calculated at 2.8 grams of CO2 equivalent per kWh (gCO2e/kWh) by dividing the total operational GHG emissions by the total electricity generation of the Project. Construction GHG emissions have not been included within this calculation to allow a like-for-like comparison with the projected grid intensity, as the BEIS GHG intensity projections also only account for operational GHG emissions.
When compared to the current projections for the GHG intensity of marginal generation on the national grid from 2028 to 2067 (BEIS, 2021) as noted in Table 3-7 Open ▸ , the GHG intensity of the Project is much lower throughout the entire operation and maintenance phase. This means that the Project will produce fewer GHG emissions per kWh of energy generated than the marginal generation sources it displaces from national grid supply.
Table 3-7 – GHG Intensity and GHG Emissions Saved by the Project
Based on the difference between the operational GHG intensity of the Project and the projected marginal GHG intensity for each year of operation, published by BEIS, it is estimated that the Project would save the amount of 9,178,312 tCO2e from being emitted into the atmosphere during its operation and maintenance phase (see Table 3-7 Open ▸ ).
3.4.4. COMPARISON TO ALTERNATIVE FORMS OF ELECTRICITY GENERATION
The beneficial impact of the Project is further realised in relation to alternative forms of electricity generation.
This comparison uses a different GHG intensity to that presented in section 3.4.3 and accounts for construction GHG emissions to provide a like-for-like comparison from a lifecycle perspective.
Based on the total electricity generation of the Project and the lifecycle GHG emissions of 7,638,930 tCO2e, the lifetime GHG intensity of the Project is 15 gCO2e/kWh. This compares favourably with other low carbon energy generation and is significantly better than fossil fuel energy generation. Table 3-8 Open ▸ outlines energy intensity ranges of alternative forms of energy generation (CCC, 2013).
Table 3-8 – Comparison of Lifecycle GHG Intensities of Various Forms of Electricity Generation
3.4.5. COMPARISON TO UK CARBON BUDGETS
The Applicant is committed to reducing GHG emissions wherever practicable and to supporting the UK and Scottish Governments in meeting their carbon reduction targets.
It is assumed that the construction phase takes place from 2025 to 2032 and that the GHG emissions resulting from this phase are spread evenly over this period. This period falls over the 4th (2023-2027) and 5th (2028-2032) carbon budgets of the UK Government.
The Project will operate during the entire 5th and 6th carbon budget periods. The operation and maintenance phase will extend until after the 2050 net zero target date.
Table 3-9 Open ▸ shows the proportion of the relevant carbon budgets that the Project would contribute to the UK Government’s 5-year budget period.
Table 3-9 – Comparison of Project to UK Government Carbon Budgets (tCO2e)
Note: This table does not include the GHG emissions resulting from the replacement of key offshore Proposed Development components as it is not known at this stage when any replacements might take place and hence into which carbon budget they would fall.
Table source: Advice on reducing the UK’s emissions - Climate Change Committee (theccc.org.uk)
3.4.6. ASSESSMENT OF SIGNIFICANCE
The annual GHG emissions from the construction and operation and maintenance of the Project do not contribute to more than 0.24% to any of the UK Carbon Budgets that fall within this phase. Therefore, it is considered that the Project’s GHG emissions at no point will impact the UK Government’s ability to meet its Carbon Budgets. The UK Carbon Budgets align with the GHG emissions reduction trajectory required to limit warming to 1.5C, in line with IEMA guidance (2022) for determining significance, as noted in section 3.3.5.
Therefore, the GHG emissions resulting from the construction phase of the Project are considered to have a non-significant, minor adverse effect on the climate.
Despite the GHG emissions produced during the operation and maintenance phase, the Project is anticipated to save 9,178,312 tCO2e from being emitted into the atmosphere due to its lower GHG intensity than the grid’s marginal generation sources it displaces in the future baseline scenario. Without the Project, higher GHG emitting sources of energy generation will be required. Even when construction emissions are included in this equation, the Project would still save 2,951,519 tCO2e from being emitted into the atmosphere over its lifecycle.
The Project would take 8 years and 2 months to ‘pay back’ the GHG emissions relating to the construction phase from the start of the operation and maintenance phase.
The Project would begin providing carbon savings in 2036 and would continue to do so throughout its operational life. This would provide a beneficial contribution to both the UK and Scottish Governments in reaching their net zero targets by avoiding the release of GHG emissions to the atmosphere that would have been released by conventional sources of energy generation with higher GHG emissions.
This demonstrates how low-carbon energy generation sources such as this Project are crucial to the National Grid GHG intensity of electricity generation in the UK decreasing as projected.
The anticipated 9,178,312 tCO2e savings during the operation and maintenance phase mean that the Project would directly contribute to the UK and Scotland meeting their carbon reduction targets and results in GHG emissions being avoided from being emitted into the atmosphere. Therefore, the operation and maintenance phase of the Project is considered to have a significant beneficial effect on the climate.
Overall, the assessment has found that the Project would save 2,951,519 tCO2e GHG emissions from being emitted over the lifetime of the Project. This would provide a beneficial impact in relation to the UK and Scotland meeting their carbon reduction targets and cause GHG emissions to be overall avoided from the atmosphere. Therefore, the Project is considered to have a significant beneficial effect on the climate.
3.4.7. CUMULATIVE EFFECTS
The effects of GHG emissions are essentially cumulative; it is their concentration in the atmosphere, not the actual level of GHG emissions, that determines the warming effect (i.e. it is the ‘stock’ rather than the ‘flow’ which is important). In addition, it is the global excess of GHG emissions from human activities all over the world that contributes to the overall effect on climate, not only local GHG emissions. And it is the global atmosphere that is the receptor for these GHG emissions. For these reasons, the impact of the Project should be considered in the context of overall GHG emissions from the UK and globally. As noted in the IEMA guidance, the effects of GHG emissions from specific cumulative projects should not be individually assessed as there is no basis for selecting any particular project over any other.
The Cambois connection[7] will export electricity from the offshore Proposed Development array area to the National Grid via a grid connection at Blyth substation, Northumberland. The Cambois connection will be constructed during a two-year period between 2028 and 2031. It would only be constructed if the Project is implemented. Since the Cambois connection is therefore directly dependent on the implementation of the Project, a cumulative assessment of the GHG emissions associated with the Cambois connection together with the onshore Proposed Development and the offshore Proposed Development is presented here in order to provide a precautionary, worst-case assessment of potential GHG emissions.
Since the Cambois connection is at the scoping stage, full design details are not known at this stage, but the worst-case scenario for the construction phase GHG emissions is estimated to be 337,935 tCO2e. The vast majority of these GHG emissions are embodied GHG emissions from the four export cables used along the up to 170 km offshore export cable route.
The GHG emissions for the operation and maintenance phase are not known at this stage but are considered to be minor. This is due to the likely limited operational energy and maintenance requirements associated with the export of electricity.
Table 3-10 Open ▸ compares the cumulative GHG emissions of the two projects with the UK carbon budgets. As the Cambois connection is due to be constructed within a two-year period between 2028 to 2031, the cumulative GHG emissions will only occur during the 5th UK carbon budget. The two projects combined will release 4,523,604 tCO2e during the 5th carbon budget. This equates to only 0.26% of this UK carbon budget.
Table 3-10 - Comparison of Cumulative GHG Emissions to UK Government Carbon Budgets (tCO2e)
The cumulative GHG emissions from the two projects do not contribute to more than 0.26% of any of the UK Carbon Budgets that fall within the construction and operation and maintenance phases of the Project. Therefore, it is considered that these cumulative GHG emissions will not impact the UK Government’s ability to meet its Carbon Budgets. The UK Carbon Budgets align with the GHG emissions reduction trajectory required to limit warming to 1.5C, in line with IEMA guidance (2022) for determining significance.
Taking the GHG emissions from the Cambois connection into account results in saving 2,613,584 tCO2e from being emitted into the atmosphere during the lifecycle of the Project.
Whilst the GHG emissions resulting cumulatively from the Project and the Cambois connection are considered to have a non-significant, minor adverse cumulative effect on the climate, they only occur cumulatively during the construction phases of both projects. The Project’s significant beneficial effect on the climate during the operation and maintenance phase is not changed when taking the Cambois connection into account, nor is the overall significant beneficial effect of the Project on the climate during its lifetime.
3.5. MITIGATION MEASURES
Mitigation against effects on climate is the reduction in GHG emissions released in association with the Project, both during the construction and operation and maintenance phases. Mitigation should be applied to both the onshore Proposed Development and offshore Proposed Development where practicable.
Mitigation measures set out in Table 3-11 Open ▸ require consideration during the construction phase to reduce GHG emissions resulting from construction activities. However, these measures do not need to be implemented for the results and outcomes in Section 3.4.6 to be achieved. Their implementation would result in further GHG emissions savings.
Table 3-11 – Mitigation Measures During Construction
Mitigation measures set out in Table 3-12 Open ▸ should be considered during the operation and maintenance phase to reduce GHG emissions resulting from operation and maintenance activities of the Project. The proposed mitigation measures do not need to be implemented for the results and outcomes in Section 3.4.6 to be achieved but to improve the results further. Several of the mitigation measures are already being considered by the Applicant.
Table 3-12 – Mitigation Measures During Operation and Maintenance
3.6. SUMMARY
The construction of the Project will contribute 6,226,793 tCO2e of GHG emissions during the construction phase. Once fully operational the Project will generate 1,412,137 tCO2e during its 35 year operation and maintenance phase, of which the vast majority (1,044,431 tCO2e) will be emitted by diverted shipping routes.
Based on the difference between the operational GHG intensity of the Project and the projected GHG intensity of marginal generation sources on the national grid for each year of operation, published by BEIS, it is estimated that the Project will save 2,951,519 tCO2e from being emitted over its lifecycle.
As the operational GHG intensity of the Project (2.8 gCO2e/kWh) is considerably lower than the projected marginal grid energy mix, the Project would directly aid both the UK and Scottish governments in meeting their carbon reduction targets.
The Project would take 8 years and 2 months to ‘pay back’ the construction phase GHG emissions from the start of operation. After this period, the Project would save 2,951,519 tCO2e from being emitted into the atmosphere by replacing conventional forms of energy generation (i.e. fossil fuels). This ‘payback’ period is in line with both governments’ net zero ambitions.
Therefore, the renewable energy generation of the Project would have a significant beneficial effect on the climate.
A cumulative assessment was completed for the Project and the Cambois connection as the implementation of the Cambois connection is determined by the implementation of the Project. The additional estimated GHG emissions from the Cambois connection (337,953 tCO2e) will result in the cumulative GHG emissions from the two projects to contribute 0.26% to any of the UK’s carbon budgets.
It is considered that these cumulative GHG emissions at no point will impact the UK Government’s ability to meet its Carbon Budgets. Therefore, the GHG emissions resulting from the cumulative assessment are considered to have a non-significant, minor adverse cumulative effect on the climate which occurs during the construction phase of both projects. The Project’s significant beneficial effect on the climate during the operation and maintenance phase is not changed when taking the Cambois connection into account, nor is the overall significant beneficial effect of the Project on the climate during its lifetime.
Without low-carbon energy generation, such as the Project, the average grid GHG intensity will not decrease as is projected, which could adversely affect the UK’s and Scotland’s ability to meet its carbon reduction targets.
4. CLIMATE VULNERABILITY
4. CLIMATE VULNERABILITY
4.1. APPROACH
The IPCC describes climate vulnerability as the tendency or predisposition of a receptor to be adversely affected by changes to the climate. It therefore encompasses a variety of concepts and elements including sensitivity or susceptibility to harm and lack of capacity to cope and adapt (IPCC, 2018) .
The climate vulnerability assessment covers the Project’s design life (35 years). It is noted that it is not unusual for a development’s design life to be exceeded by its life span as many developments remain in situ after they have fulfilled their original objectives. With this in mind the climate vulnerability baseline uses long term climate projections.
4.1.1. Study Area
The Climate Vulnerability study area consists of both the onshore Proposed Development and offshore Proposed Development.
4.2. Baseline
4.2.1. METHODOLOGY TO INFORM BASELINE
Information on the current climate of the Climate Vulnerability study area was collected using the Met Office’s regional dataset of 30-year averages and data from the nearby meteorological station at Dunbar[8].
Consideration of the future climate for the Climate Vulnerability study area has been undertaken using climate projections from United Kingdom Climate Projections 2018 (UKCP18 (Met Office, 2018)). These projections have been developed by the Met Office Hadley Centre Climate Programme which is supported by BEIS and Defra. They provide the most up-to-date assessment of how the climate of the UK may change over the 21st century. The UKCP18 dataset used is Local (2.2 km) projections, the highest resolution data. UKCP18 uses a range of possible scenarios, classified as Representative Concentration Pathways (RCPs), which reflect future atmospheric concentrations of GHGs resulting from different emissions trends (IPCC, 2014). These RCPs “…specify the concentrations of greenhouse gases that will result in total radiative forcing increasing by a target amount by 2100, relative to preindustrial levels.” RCP 8.5 refers to a temperature increase of about 4.3˚C by 2100, relative to pre-industrial temperatures. Referred to as the business-as-usual scenario, and hence the worst-case scenario for climate change, this is the emission scenario used in this assessment. Other RCPs are provided in Table 4-1 Open ▸ .
Table 4-1 – Representative Concentration Pathways (RCPs)
The local climate projections that are made available through UKCP18 are limited to RCP8.5 and two time periods (2021-2040 and 2061-2080). This precludes assessment of the changes in local climate risks over continuous time series for multiple scenarios. RCP8.5 represents the highest concentration scenario and is indicative of a mean global temperature rise of 4.3°C (range 3.2–5.4°C) by 2100. Although the latest IPCC assessment states that recent developments in climate policy and renewable energy make RCP8.5 less likely, it cannot be entirely ruled out due to uncertainties in both human actions and climate feedbacks (IPCC, 2021). Therefore RCP8.5 can be used to define a cautious worst case for climatic risks. Moreover, since the warming trajectory of RCP8.5 passes through conditions that are more representative of end-of-the-century temperature rises under lower concentration scenarios, mid-century projections under RCP8.5 can also be informative of other warming scenarios and used as a proxy for other RCPs.
The operational life of the Project is 35 years. The Climate Vulnerability assessment has considered a conservative scenario that considers the potential for operation beyond this design life horizon by using a high level of global GHG emissions up to the 2061-2080 period, based on the UK Climate Change Projections 2018 and Regional Climate Models[9].
4.2.2. Current baseline
Historic average climate data obtained from the Met Office website recorded by the closest meteorological station to the Project, Dunbar, and the East Scotland region for the 30-year climate period of 1991-2020 is summarised in Table 4-2 Open ▸ below. The data show that Dunbar has, on average warmer temperatures, fewer days of air frost, more hours of sunshine, and less rainfall compared to East Scotland as a whole.
Table 4-2 – Historic Climate Data for Dunbar and East Scotland, 1991-2020 [10] [11]
The Met Office historic 30-year averages for the East Lothian region identify gradual but consistent warming across each 30-year period between 1961 and 2020 with gradual and consistent increases in rainfall.
4.2.3. Future baseline
This section presents the output of the UKCP18 climate change models that cover the Climate Vulnerability study area spanning the life of the Project’s infrastructure, anticipated to last until the 2060s (based on a 35-year operational life of the Project). This is used to describe the climate risk profile.
Projections of future temperatures, precipitation, sea levels and wind speed are provided below. As described above, data from the 2061-2080 period is used to inform the future baseline.
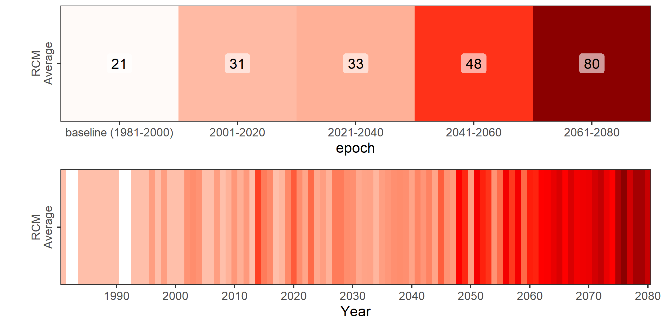
Temperatures
An increase in temperatures across all months in the Project area in the latter half of the 21st century is projected, with increases greatest in summer months. By 2061-2080, average temperature increases could exceed 5°C in summer months and 3°C in winter months under the high emissions scenario (RCP8.5) (Figures 4-1 and 4-2 respectively).
Maximum temperatures show a consistent warming trend throughout the century, with the hottest day of the year consistently exceeding 30°C by 2061-2080 under the high emissions scenario (RCP8.5), shown in Figure 4-3.
Heatwaves are defined by the Met Office as a period of at least three consecutive days with daily maximum temperatures meeting or exceeding 25°C. Heatwaves are projected to become around four times more frequent in the latter half of the 21st century. The current hottest temperature record will be surpassed, and maximum temperatures of 35°C or above are possible. Heatwaves are projected to become more frequent (Met Office, 2021), as shown in Figure 4-4.

Figure 4-2 - Average Monthly Temperatures for the Baseline and Future Baseline Period Under the High Emissions Scenario

Figure 4-3 - Maximum Annual Temperature (degrees Celsius) in Edinburgh
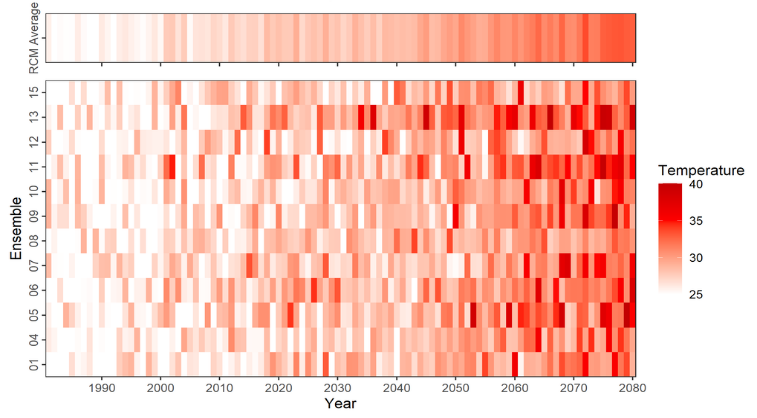
Figure 4-4 – Number of Heatwave Events (from 1990 to 2080)
Precipitation
UKCP18 projections indicate that Scottish winters will become wetter, with more heavy rainfall and a greater number of wet days, although this increase is less extreme in east Scotland than in the west. In summer months, total rainfall amounts are expected to decrease, while convectional rainfall will trigger storms between 10% and 45% more extreme than at present (Dale, 2021; Chan et al., 2022). Average summer rainfall in the Climate Vulnerability study area is projected to decrease in the coming decades, as shown in Figure 4-5, with average winter rainfall projected to increase in the latter half of the 21st century.
Summer heavy rainfall events are, however, also projected to become more extreme. This is a new finding from the latest UKCP18 ‘Local’ projections that use a 2.2 km climate model and include an improved representation of convective rainfall (the type of rainfall that drives summer storms). This is not evident in other UKCP climate products at coarser resolutions.
Local projections have been used to derive rainfall uplifts for specific storm return periods for the Climate Vulnerability study area. These are presented in Table 4-3 Open ▸ for the 2050s and 2070s. These uplifts demonstrate that a notable increase in storm intensity can be expected over the next 30 years, with further increases in the subsequent 20 years ( Table 4-3 Open ▸ ).
Figure 4-5 - Daily Average Precipitation for the Baseline and Future Baseline Period Under the High Emissions Scenario
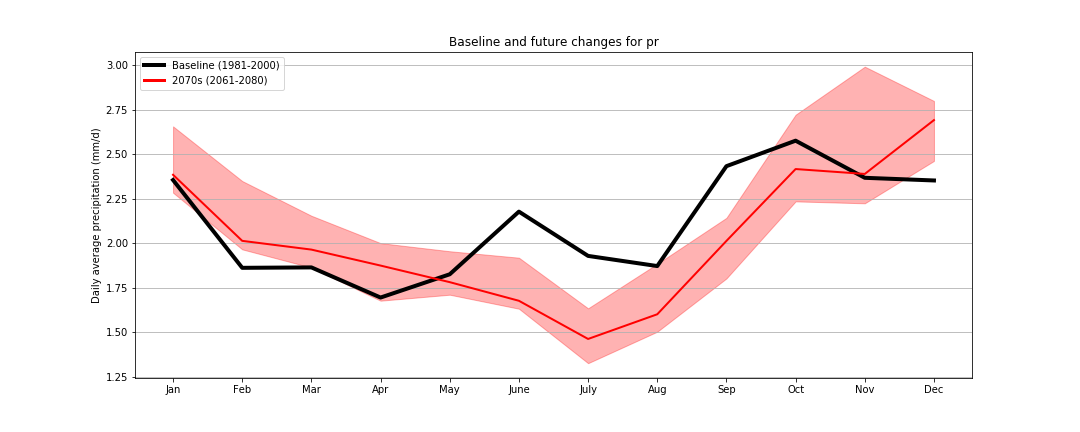
Table 4-3 – Heavy Rainfall Uplifts
Sea Levels
Sea levels around the UK rose at a rate of around 1.4 mm/year in the 20th century. This trend is projected to continue to the end of the 21st century and beyond. Rates of increase are largely independent of emissions scenarios over the next 20 years, with increases of 16-20 cm possible by 2040 relative to the 1981-2000 baseline. However, under RCP8.5, rates could increase by 38 cm by 2060 and by 62 cm by 2080 (Met Office, 2018).
Extreme sea levels are expected to increase due to the rise in mean sea level, as well as the risk of coastal flood events, but there is greater uncertainty in projecting these extreme levels. The estimated still water (the average sea level at any instance, excluding local variations due to waves) return levels are also provided for each return period. Rates vary notably in the latter half of the century, with possible increases as high as 90 cm under the high emissions scenario (RCP8.5). Figure 4-6 shows the visual representation of projected sea level rise in Edinburgh (Leith) under RCP8.5, RCP4.5 and RCP2.6. The bold lines show the 50th percentile[13] projections with the lower and upper dotted lines showing the 5th and 95th percentile[14] for each RCP.
Figure 4-6 – Sea Level Rise Rates Based on Different RCPs
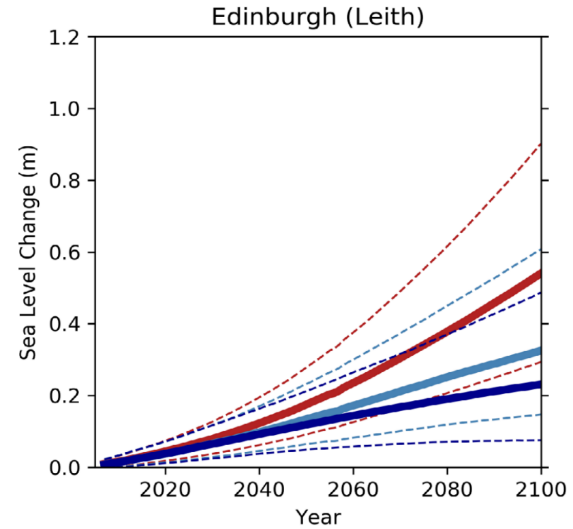
Note: Red line is RCP8.5, light blue line is RCP4.5 and dark blue line is RCP2.6
Wind Speed and Waves
Wind speeds around the UK are difficult to project; however, studies have shown that wind resources are projected to change seasonally with increases in winter and decreases in summer (Hdidouan, & Staffell, 2017). The latest UKCP18 global projections indicate an increase in near surface wind speeds over land over the UK during the winter season for the second half of the 21st century accompanied by an increase in frequency of winter storms over the UK. However, the increase is small when compared to interannual (year-to-year) variability (Met Office, 2019).
Waves in climate models are driven by the winds of the atmospheric model, where typically, the global model winds drive the seas well in open water in oceans like the Atlantic and in sea basins like the North and Baltic Seas. The challenges lie in coastal regions where high-resolution winds and better representation of the local coastline and bathymetry are needed. With current scientific understanding and uncertainty, it is difficult to ascertain changes in wave climate.
4.3. ASSESSMENT METHODOLOGY
4.3.1. GUIDANCE
The Climate Vulnerability assessment has been undertaken in accordance with IEMA (2020) Environmental Impact Assessment Guidance for Climate Change Resilience & Adaptation assessment.
4.3.2. IMPACTS TO BE ASSESSED
The climate hazards scoped in and those not progressed for further assessment are provided in Table 4-4 Open ▸ . Further details about the potential impacts that the scoped in climate hazards could cause are provided later in Section 4.4.
Table 4-4 – Climate Hazards Scoped Into Assessment or Not Progressed for Further Assessment
4.3.3. SIGNIFICANCE ASSESSMENT
Determination of Receptor Sensitivity
In accordance with IEMA guidance receptors considered include:
- Human health receptors (e.g., construction workers and operational and maintenance staff); and
- Project Infrastructure (onshore and offshore).
Sensitivity, in relation to climate change vulnerability, for each receptor has been determined using quantifiable data as well as professional judgement. In accordance with IEMA guidance the following have been considered:
- Susceptibility – ability for the receptor to be affected by climate change;
- Vulnerability – potential exposure of receptor to climate change; and
- Value – importance of receptor.
Susceptibility and vulnerability have been determined based on the criteria set out in IEMA guidance and shown in Table 4-5 Open ▸ and Table 4-6 Open ▸ . Criteria for defining a receptor’s value are set out in Table 4-7 Open ▸ .
Table 4-5 – Criteria for Determining Susceptibility
Table 4-6 - Criteria for Determining Vulnerability
Table 4-7 - Criteria for Determining Value
The receptor’s sensitivity is a combination of its vulnerability, susceptibility and value score. It is determined by summing these scores and then categorising as follows:
- Score 0-4 Negligible
- Score 5-7 Low
- Score 8-9 Medium
- Score 10-12 High
Determination of Impact Magnitude
Due to the inherent uncertainty of future climate change predictions, a risk-based approach has been used to identify impact magnitude, after mitigation, which considers a combination of the consequence of a climate change impact occurring and the probability of occurrence.
The probability of a specific climate variable changing is determined using available data and professional judgement. The categories range from negligible through low and medium to high. When defining probability, consideration has been given to the projected return periods of future events (where known), and the confidence in the direction of projected changes.
The consequence of climate change impacts has been defined as shown in Table 4-8 Open ▸ .
Table 4-8 – Criteria for Determining Impact Consequence
The impact magnitude is determined by considering the impact’s consequence and probability in combination as shown in Table 4-9 Open ▸ .
Table 4-9 – Determining Impact Magnitude
Determination of Significance
The significance of effect is determined by considering the relationship between the sensitivity of the receptor and the impact magnitude. Major or Major/Moderate effects are deemed to be significant. Everything less than this (Moderate, Moderate/Minor, Minor, Minor/Negligible and Negligible) are deemed to be not significant. Table 4-10 Open ▸ acts as a guide and professional judgement is used at each step to make a reasoned judgement on whether an effect is significant or not.
Table 4-10 – Determining Significance of Effect
4.4. ASSESSMENT
4.4.1. RECEPTORS
Table 4-11 Open ▸ shows the receptors that have been considered in the climate vulnerability assessment and shows how their sensitivity has been derived.
Table 4-11 - Receptors Considered in the Impact Assessment
4.4.2. POTENTIAL CONSTRUCTION IMPACTS
The Project's construction is not expected to be so far in the future that the current climate conditions will notably change. Gradual changes to average climatic conditions are therefore not expected to impact construction.
If construction coincides with extreme weather event(s), such as drought or storms, which are projected to become more frequent and more severe, there may be construction related impacts. These are set out in the following subsections.
Delayed Construction Schedule
Extreme weather events that compromise the viability of the construction site, for example, heavy rain resulting in closure of local roads and power cuts due to flooding or flood inundation of the construction site itself, could restrict working hours and delay construction.
Delays could also be linked to unsuitable weather conditions for certain construction activities or damage to construction materials, plant and equipment.
During installation, specialist vessels are required for heavy lifting and piling operations; these vessels are often jack-up vessels that are fitted with long support legs that can be raised or lowered. These vessels are particularly sensitive to wind speed, wave height and wave period when en route from port to the offshore location, transitioning between wind turbines, and heavy lifting crane operations at height.
Increased Health and Safety Risks
During severe weather events, for example, extreme heat events, there could be increased health and safety risks to the workforce.
Mitigation and Assessment
Construction impacts are addressed as required by the relevant topics within the Onshore and Offshore EIA Reports. Potential construction related surface water flood risks related to extreme weather are addressed within the Geology, Hydrology, Soils and Flood Risk Chapter (Onshore EIA Report, Volume 1, Chapter 11). Any potential construction impacts related to climate that are not covered by other chapters in the EIA Reports will be managed through the CEMP for example by the inclusion of severe weather construction plans and risk assessments.
4.4.3. POTENTIAL OPERATION AND MAINTENANCE IMPACTS
The operation and maintenance phase impact assessment for Climate Vulnerability is set out in Table 4-12 Open ▸ .
Table 4-12 – Operation and Maintenance Phase Impact Assessment
4.4.4. Potential decommissioning impacts
Climate change could affect metocean conditions. Vessels will be required for decommissioning the offshore infrastructure similar to the operation phase. A similar, suitable and appropriate level of planning to ensure safe operation will be required. Mitigation and the residual impact for this impact is the same during decommissioning as it is in the assessment presented in Table 4-12 Open ▸ .
4.4.5. CUMULATIVE ASSESSMENT
A cumulative assessment for Climate Vulnerability has not been taken forward for the following reasons:
- There are no cumulative risks when considering the onshore Proposed Development and the offshore Proposed Development combined (intra-Project cumulative risks) for Project assets, energy production, and staff since both the onshore Proposed Development and offshore Proposed Development will be different assets with their own construction and operation and maintenance programmes, management and workers;
- There is no likelihood for significant cumulative effects of the onshore Proposed Development with the onshore aspects (assets and workers) of the Cambois connection[16] due to the large geographical distance and separate management of the onshore aspects of the onshore Proposed Development (Branxton, Scotland) and the Cambois connection (Blyth, North England); and
- There is no likelihood for significant cumulative effects of the offshore Proposed Development with the offshore aspects (assets and workers) of the Cambois connection, considering that the offshore export cables of both the offshore Proposed Development and of the Cambois connection will be buried in the seabed and/or covered (see the project description of the offshore Proposed Development in the Offshore EIA report, volume 1, chapter 3) and that risks to staff wellbeing and occupational health and safety would be managed separately for both the offshore Proposed Development and the Cambois connection during construction and operation and maintenance.
An in-combination climate impact assessment is presented in volume 4, appendix 5.2, annex A.
4.5. SUMMARY
The assessment has considered the vulnerability of the Project to climate change impacts and has presented mitigation measures to manage these. No significant residual effects have been identified.
5. REFERENCES
5. REFERENCES
BEIS (2021). Green Book supplementary guidance: valuation of energy use and greenhouse gas emissions for appraisal. Available at: https://www.gov.uk/government/publications/valuation-of-energy-use-and-greenhouse-gas-emissions-for-appraisal Accessed September 2022
BEIS (2022)a. 2020 UK Greenhouse Gas Emissions. Available at:
Accessed September 2022
BEIS (2022)b. 2021 UK Provisional Greenhouse Gas Emissions. Available at: https://assets.publishing.service.gov.uk/government/uploads/system/uploads/attachment_data/file/1064921/2021-uk-ghg-provisional-figures-statistical-summary.pdf. Accessed September 2022
BEIS (2022)c. British Energy Security Strategy. Available at: https://www.gov.uk/government/publications/british-energy-security-strategy/british-energy-security-strategy#renewables
Bett, Thornton & Clark (2017). Using the Twentieth Century Reanalysis to assess climate variability for the European wind industry. Theoretical and Applied Climatology. 127, pp.61-80
Burrows, M., Hughes D., Austin, W.E.N., Smeaton, C., Hicks, N., Howe, J., Allen, C., Taylor, P., & Vare, L. (2017). Assessment of Blue Carbon Resources in Scotland's Inshore Marine Protected Area Network: Commissioned Report No 957.
Chan, S.C.; Dale, M.; Fowler, H.J.; Kendon, E.J. (2022). Extreme precipitation return level changes at 1, 3, 6, 12, 24 hours for 2050 and 2070, derived from UKCP Local Projections on a 5km grid for the FUTURE-DRAINAGE Project. NERC EDS Centre for Environmental Data Analysis, 31 October 2022. doi:10.5285/18f83caf9bdf4cb4803484d8dce19eef. http://dx.doi.org/10.5285/18f83caf9bdf4cb4803484d8dce19eef Available at: https://catalogue.ceda.ac.uk/uuid/18f83caf9bdf4cb4803484d8dce19eef?search_url=%2F%253Fq%253DFUTURE-DRAINAGE%2B%26sort_by%253Drelevance%26results_per_page%253D20
Circular Ecology (2022). Embodied Carbon – The ICE Database. Available at: https://circularecology.com/embodied-carbon-footprint-database.html Accessed September 2022
CCC (2013). Reducing the UK’s carbon footprint. Available at: http://www.theccc.org.uk/wp-content/uploads/2013/04/Reducing-carbon-footprint-report.pdf Accessed September 2022
CCC (2021). COP26: Key Outcomes and next steps for the UK. Available at: https://wwwtheccc.org.uk/publication/cop26-key-outcomes-and-next-steps-for-the-uk/. Accessed September 2022
CCC (2022). Progress in reducing emissions 2022 Report to Parliament. Available at: https://www.theccc.org.uk/wp-content/uploads/2022/06/Progress-in-reducing-emissions-2022-Report-to-Parliament.pdf. Accessed November 2022
Dale, M. (2021). Future Drainage Guidance for Water and Sewerage Companies and Flood Risk Management Authorities: Recommended uplifts for applying to design storms. Available at: https://artefacts.ceda.ac.uk/badc_datadocs/future-drainage/FUTURE_DRAINAGE_Guidance_for_applying_rainfall_uplifts.pdf
Defra (2022). Greenhouse gas reporting: conversion factors 2022. Available at: https://www.gov.uk/government/publications/greenhouse-gas-reporting-conversion-factors-2022 Accessed September 2022
Department for Transport (2022). Closed consultation. Domestic maritime decarbonisation: the course to net zero emissions. Available at: https://www.gov.uk/government/consultations/domestic-maritime-decarbonisation-the-course-to-net-zero-emissions
EMEP/EEA (2019). Air pollutant emission inventory guidebook 2019. Available at: https://www.eea.europa.eu/themes/air/air-pollution-sources-1/emep-eea-air-pollutant-emission-inventory-guidebook Accessed September 2022
Hdidouan, D., & Staffell, I. (2017). The impact of climate change on the levelised cost of wind energy. Renewable energy, 101, 575-592.
IEMA (2020). Environmental Impact Assessment Guide to: Climate Change Resilience & Adaptation. Available at: https://iema.net/resources/reading-room/2020/06/26/iema-eia-guide-to-climate-change-resilience-and-adaptation-2020
IEMA (2022). Environmental Impact Assessment Guide to: Assessing Greenhouse Gas Emissions. Available at: https://www.iema.net/resources/blog/2022/02/28/launch-of-the-eia-guidance-on-assessing-ghg-emissions
IPCC (2014). Fifth Assessment Report, Climate Change 2014. Available at: https://www.ipcc.ch/report/ar5/wg2/
IPCC (2018). Special Report: Global Warming of 1.5°C. Available at: https://unfccc.int/topics/science/workstreams/cooperation-with-the-ipcc/ipcc-special-report-on-global-warming-of-15-degc
IPCC (2021). Sixth Assessment Report, Climate Change 2021: The Physical Science Basis. Available at: https://www.ipcc.ch/report/ar6/wg1/ Accessed September 2022
IPCC (2022). Climate Change 2022: Impacts, Adaptation and Vulnerability, Summary for Policymakers of the Sixth Assessment Report. Available at: https://www.ipcc.ch/report/ar6/wg2/
Marine Scotland Licensing Operations Team (2022). Scoping Opinion for Berwick Bank Wind Farm. Available at: Scoping Opinion – Berwick Bank Offshore Wind Farm | Marine Scotland Information. Accessed: February 2022.
Met Office (2018). UKCP18 Science Overview Report, November 2018. Available at: https://www.metoffice.gov.uk/pub/data/weather/uk/ukcp18/science-reports/UKCP18-Overview-report.pdf Accessed September 2022
Met Office (2019). UKCP18 Factsheet: Wind. (2019). Met Office Hadley Centre. Source: ukcp18-fact-sheet-wind_march21.pdf (metoffice.gov.uk)
Met Office; Hollis, D.; McCarthy, M.; Kendon, M.; Legg, T.; Simpson, I. (2021): HadUK-Grid Gridded Climate Observations on a 1km grid over the UK, v1.0.3.0 (1862-2020). NERC EDS Centre for Environmental Data Analysis, 08 September 2021. doi:10.5285/786b3ce6be54468496a3e11ce2f2669c. Available at: http://dx.doi.org/10.5285/786b3ce6be54468496a3e11ce2f2669c Accessed September 2022
National Grid (2022a). How can SF6 production be reduced? Available at: https://www.nationalgrid.com/stories/energy-explained/what-is-sf6-sulphur-hexafluoride-explained Accessed September 2022
National Grid (2022b). Sulphur Hexafluoride. Available at: https://www.nationalgrid.co.uk/customers-and-community/environment/sulphur-hexafluoride-sf6 Accessed September 2022
RenewableUK (undated). Renewable UK Wind Energy Statistics Explained. Available at: https://www.renewableuk.com/page/UKWEDExplained Accessed September 2022
Scottish Government (2022a). Scottish Greenhouse Gas Emissions 2020. Available at: https://www.gov.scot/publications/scottish-greenhouse-gas-statistics-2020/ Accessed November 2022
Scottish Government (2022b). Climate Change Plan: monitoring reports – 2022. Available at: https://www.gov.scot/publications/climate-change-plan-monitoring-reports-2022/pages/3/ Accessed November 2022
Smeaton, C., Austin, W. and Turrell, W.R. (2020). Re-Evaluating Scotland’s Sedimentary Carbon Stocks. Scottish Marine and Freshwater Science, 11(2).
Smoucha, E.A., Fitzpatrick, K., Buckingham, S. and Knox, O.G. (2016). Life cycle analysis of the embodied carbon emissions from 14 wind turbines with rated powers between 50Kw and 3.4 Mw. Journal of Fundamentals of Renewable Energy and Applications, 6(4).
Solaun, K & Cerda, E. (2019). Climate change impacts of renewable energy generation. A review of quantitative projections. Renewable and Sustainable Energy Reviews. 116
SSER (2021). Berwick Bank Wind Farm Offshore Scoping Report. Available at: https://berwickbank-eia.com/offshore-scoping/
SSER (2022). Cambois connection Scoping Report.
The Royal Society (2020). Evidence & Causes of Climate Change. Available at: https://royalsociety.org/toopics-policy/projects/climate-change-evidence-causes/question-7/ Accessed September 2022
UK Government (2013). Construction 2025: industrial strategy for construction – government and industry partnership. Available at: https://assets.publishing.service.gov.uk/government/uploads/system/uploads/attachment_data/file/210099/bis-13-955-construction-2025-industrial-strategy.pdf
UK Chamber of Shipping. (2021). UK Shipping Industry Demands Net-Zero By 2050. Available at: UK Shipping Industry Demands Net-Zero By 2050 | Chamber of Shipping (ukchamberofshipping.com).
Vestas. (2022). V164-9.5 MW™ at a glance. Available at: V164-9.5 MW™ (vestas.com).
WMO (2021). WMO Greenhouse Gas Bulletin Available at: https://library.wmo.int/index.php?lvl=notice_display&id=21975#.YzF3IKTMI2y. Accessed September 2022
Atkins Limited
Woodcote Grove
Ashley Road
Epsom
KT18 5BW
Tel: +44 (0)1372 726140
Fax: +44 (0)1372 740055
[1] The offshore components of the Project include the following: the offshore wind farm (the wind turbines, their foundations and associated inter-array cabling), together with associated transmission infrastructure including Offshore Substation Platforms (OSPs)/Offshore convertor station platforms, their foundations and the offshore export cables and cable protection. The offshore Proposed Development array area is located in the outer Firth of Forth and Firth of Tay, approximately 37.8 km east of the Scottish Borders coastline (St. Abb’s Head) and 47.6 km to the East Lothian coastline. For further details see the Offshore EIA Report, volume 1, chapter 3.
[2] The onshore components of the Project include the following: cable landfall at Skateraw on the East Lothian coast, onshore substation, onshore cables within a cable corridor between the cable landfall and the new onshore substation, and between the new onshore substation and the National Grid Branxton substation; and associated ancillary infrastructure. For further details see the Onshore EIA Report, volume 1, chapter 5.
[3] Includes carbon dioxide and other greenhouse gases included with the Kyoto Protocol. Details about each of the Kyoto Protocol GHGs can be found here: Global Warming Potentials (IPCC Second Assessment Report) | UNFCCC
[4] Target not shown in Table 2-3, but noted on the website given as the table’s source.
[5] UK shipping is required to meet net zero by 2050 at the latest, and international shipping has a target to reduce emissions by at least 50% by 2050, and to decarbonise as soon as possible, as noted in the Department for Transport’s Transport Decarbonisation Plan, 2021. In addition, Operation Zero, launched in 2021, is an initiative to accelerate the decarbonisation of the operations and maintenance vessels in the North Sea offshore wind sector, with a view to making zero-emission operations and maintenance vessels a reality by 2025.
[6] The load factor for the Project is confidential and could not be used in the Effect on Climate assessment.
[7] In July 2022, National Grid Electricity Systems Operator (NGESO) announced as part of its Holistic Network Review, that the Applicant has signed an agreement for an additional grid connection at Blyth, Northumberland (referred to as the Cambois connection). Necessary consents for the Cambois connection will be applied for separately once further development work has been undertaken on this export cable corridor route and landfall. These applications will be supported by an EIA and Habitats Regulations Appraisal (HRA). The Cambois connection has been included as a cumulative project for the purposes of the EIA and assessed based on the information presented in the Cambois Connection Scoping Report submitted in November 2022 (SSER, 2022).
[8] Data available from https://www.metoffice.gov.uk/research/climate/maps-and-data/uk-climate-averages/gcynwfb7z
[9] Some of the modelled climate data are from a detailed analysis in Edinburgh to the west of the site, but changes in rainfall and windspeed can be applied as percent changes to Dunbar station to build a local picture.
[10] Met Office UK climate averages; Dunbar (East Lothian): https://www.metoffice.gov.uk/research/climate/maps-and-data/uk-climate-averages/gcynwfb7z
[11] Met Office UK climate averages: Royal Botanical Garden Edinburgh (Edinburgh): https://www.metoffice.gov.uk/research/climate/maps-and-data/uk-climate-averages/gcvwqb#?nearestTo=your%20detected%20location
[12] Q50 is the 50 percentile flow, signifying medium flows. Q95 is the 95 percentile flow, signifying low flows.
[13] The 50th percentile represents the warming midpoint for the ensemble data.
[14] The 5th to 95th percentile range in climate projections are used to analyse the range of climate responses. Including the low (5th) and high (95th) percentile ensures that the range of uncertainty within climate models is taken into account.
[15] Berwick Bank Windfarm: Technical Appendix 11.1: Flood Risk Assessment
[16] As described in section 3.4.7, the Cambois connection will export electricity from the offshore Proposed Development array area to the National Grid via a grid connection at Blyth near Cambois, Northumberland. It would only be constructed if the Project is implemented. For further details refer to section 3.4.7.