

1. Introduction
1.1 Context
1.1 Context
ITPEnergised (ITP) has been appointed by SSE Renewables (The Client) to provide support and input to the onshore component of the Environmental Impact Assessment Report (EIAR) submission to support a planning application for Berwick Bank Windfarm.
This Drainage Strategy Report has been prepared as Technical Appendix 11.2 to Chapter 11: Geology, Hydrology, Soils & Flood Risk within the onshore EIAR.
This report summarises the proposed permanent and temporary drainage strategy for both surface water and foul water and the assessment of increased surface water runoff in accordance with sustainable drainage principles. Underlying this assessment is the need to ensure there are no material impacts to offsite receptors and no deterioration of the water environment.
This report takes due cognisance of local / national drainage design guidance, CIRIA Report C753[1], East Lothian SuDS guidance[2] and various SEPA technical guidance documents where appropriate.
The Site has been visited by an experienced ITP Hydrologist and Civil Engineer on several occasions between 2020 and 2022 to inform this assessment.
1.2 Site Location
1.2 Site Location
The site is situated near Torness and the village of Innerwick, south-east of Dunbar located in East Lothian. The centre of the site is OSGB36, British National Grid (BNG) 373977, 674114 and is approximately 598 ha in size.
The extent of the site runs from the settlement of Branxton in the south, Bilsdean in the south-east, the coastline at Skateraw and Torness in the north, Oxwell Mains Cement Works and Quarry in the north-west and Fouracres in the west. The land on which the site is located is predominantly agricultural land with sparse settlements spread throughout, connected by small local roads and tracks. The A1 trunk road and East Coast Main Line (ECML) railway cut through the site in a north-west to south-east direction running parallel to the coast. Torness Power Station (Nuclear) is located to the south-east of the proposed landfall at Skateraw.
1.3 Proposed Onshore Development
1.3 Proposed Onshore Development
The Onshore Transmission Works (OnTW) shall include the following:
a new onshore substation;
one landfall location;
onshore cables within a cable corridor between the landfall and the new onshore substation, and between the new onshore substation and the SPEN Branxton substation; and
associated ancillary infrastructure.
The Branxton substation is being developed by SPEN and is subject to a separate planning application.
1.4 Topography
1.4 Topography
Ground levels within the site vary due to the scale of the site and the sloping topography towards the coastline. The highest elevations within the site are approximately 120mAOD around the location of the proposed SPEN Branxton substation whilst the lowest elevations are at sea level along the coastline. The topography across the site generally falls in a north-easterly direction.
2. Proposed Surface Water Drainage Strategy
2. Proposed Surface Water Drainage Strategy
2.1 Sustainable Drainage Systems (SuDS)
2.1 Sustainable Drainage Systems (SuDS)
To satisfy the requirements of current best national / local flood risk and surface water management guidance, SuDS are required to be incorporated into the design proposals to manage, attenuate and treat surface water runoff before discharging from the site.
Current best practice guidance relating to sustainable surface water management is outlined in the SuDS Manual (CIRIA Report C753) which provides details on the use of SuDS for managing surface water runoff.
There are four main categories of SuDS which are referred to as the ‘four pillars of SuDS design’ as depicted in Figure 1 below.

Figure 1 Four Pillars of SuDS (CIRIA Report C753)
The SuDS Manual identifies a hierarchy of SuDS for managing runoff, which is commonly referred to as a ‘management train’ as depicted in Error! Reference source not found..
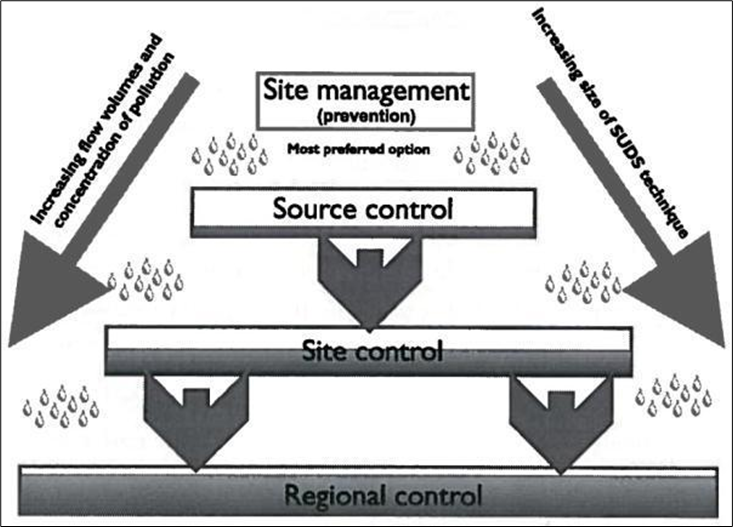
Figure 2 SuDS Management Train
Prevention – the use of good site design and housekeeping measures on individual sites to prevent runoff and pollution (e.g. minimise areas of hard standing).
Source Control – control of runoff at or very near its source (such as the use of rainwater harvesting, permeable paving and green roofs).
Site Control – management of water from several sub-catchments (including routing water from roofs and car parks to one / several soakaways or attenuation ponds for the whole site).
Regional Control – management of runoff from several sites, typically in a retention pond or wetland.
It is generally accepted that the implementation of SuDS as opposed to conventional drainage systems, provides several benefits by:
reducing peak flows to watercourses or sewers and potentially reducing the risk of flooding downstream;
reducing the volumes and frequency of water flowing directly to watercourses or sewers from developed sites;
improving water quality over conventional surface water sewers by removing pollutants from diffuse pollutant sources;
reducing potable water demand through rainwater harvesting;
improving amenity through the provision of public open spaces and providing biodiversity and wildlife habitat enhancements; and
replicating natural drainage patterns, including the recharge of groundwater so that base flows are maintained.
2.2 Proposed Permanent Surface Water Drainage Strategy
2.2 Proposed Permanent Surface Water Drainage Strategy
2.2.1 Overview
The proposed permanent surface water drainage strategy for the Proposed Development will comprise the management of surface water runoff from the onshore substation platform and associated cut embankments and intercepted surface water from the catchment upgradient of the substation via underground pipework and cut-off ditches. These drained areas will be routed to a SuDS pond that will provide adequate treatment and attenuation of the runoff prior to discharge. The proposed discharge is via a piped outfall to the unnamed watercourse (referred to as the Innerwick Burn) directly upstream from a culvert passing under the A1. Drawings DRA-001, DRA-002, DRA-003 enclosed provide further details on the proposed permanent drainage strategy.
Normally, upgradient undeveloped areas would not be collected and attenuated within the SuDS system but instead by routed around the development and discharged in a similar fashion to the pre-development regime. The purpose of routing these upgradient areas through proposed SuDS pond and providing attenuation is to mitigate a known pre-existing localised flooding issue to the northeast of the substation location. This north eastern corner is low lying, does not drain to the Innerwick Burn and is bounded by to the north by the A1 and railways, preventing any natural runoff towards the coastline. An existing drainage system is present near to the Railway Cottage property which drains this low lying area and conveys the flows to east. The drainage system is unsuitably sized to manage the overland runoff from the fields to the south and thus the low lying area regularly floods. The proposed drainage strategy shall reduce the total catchment area draining to this location and thus reduce the existing flood risk.
It is noted that the drained areas attenuated through the SuDS pond and discharged to the Innerwick Burn does not all currently drain to the watercourse. A separate assessment was prepared for East Lothian Council to demonstrate that this increase in catchment area to the watercourse will not increase the risk of downstream flooding, and this assessment is included as Appendix A.
The remaining onshore infrastructure comprises the landfall location and onshore cable route. Once constructed and in operation, this infrastructure will be buried and therefore does not require permanent drainage.
2.2.2 Design Criteria
2.2.2.1 Proposed Surface Water Discharge Location(s)
In accordance with CIRIA Report C753, the hierarchy for favoured disposal options of permanent surface water runoff from development sites is as follows:
- Infiltration to Ground;
- Discharge to Surface Waters; or
- Discharge to Sewer.
Table 1 below discusses the disposal method suitability in the context of the site and proposed development.
Table 1 Suitability of Surface Water Disposal Methods
Surface Water Disposal Method | Suitability Description | Method Suitable? (Y/N) |
|---|---|---|
Infiltration to Ground | The results of the Ground Investigation indicates the substation site is underlain by superficial material comprising clays and silts, indicating infiltration would not be a viable option. Soakaway testing undertaken during the GI campaign confirmed that discharge to ground is not viable (soakaway tests were abandoned due to negligible infiltration) | N |
Surface Water Discharge | The Innerwick Burn flows from west to east immediately to the north of the proposed substation location. | Y |
Sewer Discharge | There are no public sewers with the vicinity of the site due to its rural setting | N |
Taking the above into account it is proposed that surface water runoff from the developed site is disposed of via the Innerwick Burn through attenuated discharge. This mimics the existing hydrological regime at site albeit in a more formalised manner.
2.2.1 Water Quantity
2.2.1.1 Pre-Development Greenfield Runoff Rates
Greenfield runoff rates have been estimated through application of methodology outline in IH R124[3] (1994) as set out within the Interim Code of Practice (ICP) for catchment areas of 50ha or less.
The IH R124 method can be used to estimate Greenfield runoff release rates for a range of Annual Exceedance Probability (AEP) events, or return periods, by applying regional growth curve factors to the mean annual peak runoff (i.e. Qbar). The UK hydrological region for the East Lothian area is Region 2, therefore the appropriate growth curve factors for this region have been incorporated into the analysis undertaken in the MicroDrainage (2020) software suite[4].
Greenfield runoff modelling results are presented below in Table 2 for a range of AEP storm events.
Table 2 Estimation of the Greenfield (Pre-Development) Rate of Runoff
AEP (%) | Return Period (1 in X Years) | Unit Greenfield Runoff Rate (l/s/ha) |
50 | 2 | 2.97 |
QBAR | 3.25 | |
3.3 | 30 | 6.16 |
1 | 100 | 8.55 |
0.5 | 200 | 9.68 |
0.1 | 1000 | 12.51 |
2.2.1.2 Post-Development Discharge Rates
Current best practice for surface water management and SuDS Design (CIRIA Report C753) states the following with respect to the control of post development ‘Peak Runoff Rates’ and ‘Runoff Volume’ from ‘greenfield’ sites:

Note: as per SPP and surface water management design in Scotland, reference to the 1:100-year event in the above extract is replaced with 1:200-year event.
Therefore, taking the above into account it is proposed to limit surface water discharge from the Proposed Development area to the mean annual peak flood (i.e. Qbar) rate of runoff thus controlling the ‘peak’ discharge and discharge volume for all storm events up to and including the design 1:200-year plus climate change event.
The above design criteria adopted from CIRIA Report C753 is considered to be robust and satisfies all regulatory requirements in terms of sustainable water management and ensuring there is no increase in flood risk offsite as a result of the Proposed Development.
Determination of the contributing post-development drained areas to be managed by the SuDS system prior to discharge is detailed in Table 3 below.
Table 3 Post-Development Drained Areas Summary
Catchment | Area (ha) | Runoff Coefficient | Effective Impermeable Area (ha) | Notes |
Substation Platform and Cut Embankments | 12.72 | 0.75 | 9.54 |
|
Upgradient Catchment | 11.26 | 0.47 | 5.29 |
|
Total | 23.98 | - | 14.83 | - |
With reference to Table 2 the Qbar ‘Unit Greenfield Runoff Rate’ has been estimated to be 3.25 l/s/ha. Multiplying this unit value by the total drained catchment area (23.98 ha) provides the limiting post development peak runoff rate of 77.9 l/s for all storm events up to and including the design 0.5% AEP plus a 35% climate change allowance.
2.2.2 Water Quality Design Criteria
In accordance with CIRIA Report C753 it is necessary to undertake a ‘Water Quality Risk Management’ assessment to determine the suitability of SuDS methods from a water quality perspective. The approach outlined below is based on the ‘Simple Index Approach’ for groundwater and surface water as detailed in the SuDS Manual (Section 26.7).
Table 4 below compares the SuDS Mitigation Indices against the Pollution Hazard Indices for the Proposed Development. This is based on the application of a SuDS pond as the proposed strategy to treat post-development runoff.
Table 4 SuDS Water Quality Design Criteria: Index Approach Review
Land Use | Pollution Hazard and SuDS Mitigation Indices Comparison | |||||
Total Suspended Solids (TSS) | Metals | Hydro-Carbons | ||||
Pollution Index | Mitigation Index | Pollution Index | Mitigation Index | Pollution Index | Mitigation Index | |
Substation1 | 0.7 | 0.7 | 0.6 | 0.7 | 0.7 | 0.5 |
Note: 1 Pollution Hazard Level ‘Medium’ based on Table 26.2 (C753)
The SuDS Mitigation Index offered by the proposed SuDS is ≥ Pollution Hazard Index for both Total Suspended Solids and Metals. The internal substation drainage will include fuel interceptors prior to discharge from the substation (upstream of the SuDS pond) thus ensuring the Mitigation for Hydro-Carbons is satisfied.
Therefore, the water quality assessment criteria are considered to be satisfied.
2.2.3 SuDS Outline Performance Analysis
The proposed SuDS pond has been modelled within the industry standard MicroDrainage Source Control software to demonstrate the layout and provisional design details are sufficiently sized and that a viable SuDS scheme is feasible within the proposed site layout. The key design parameters for the proposed SuDS pond are detailed in Table 5 5 below.
Table 5 SuDS Pond Summary Design Details
Parameter | Unit | Value | Notes |
|---|---|---|---|
Total pond depth | m | 2.0 | From base to functional crest |
Permanent water depth | m | 0.5 | From base to permanent water level |
Functional pond depth | m | 1.5 | From permanent water level to crest |
Crest level | mAOD | 36.0 | From AutoCad 3D Design |
Base level | mAOD | 34.0 | From AutoCad 3D Design |
Outlet level | mAOD | 34.5 | From AutoCad 3D Design |
Limiting discharge rate | l/s | 77.9 | To be provided by Hydrobrake Optimum unit or similar approved |
Crest area | m2 | 9303 | From AutoCad 3D Design |
Area at functional base | m2 | 7570 | From AutoCad 3D Design |
Using the above design details the SuDS Pond has been modelled using the MicroDrainage software suite and the results are presented in Table 6 below and full modelling extracts are included as Appendix B.
Table 6 Hydraulic Modelling Performance of Provisional SuDS Pond Design
Annual Probability (%) | Max. Water Depth (above perm. water level) (m) | Freeboard Allowance (mm) | Max Outflow Rate (l/s) | Maximum Stored Volume (m3) |
100 | 0.348 | 1152 | 40.9 | 2572.3 |
50 | 0.418 | 1082 | 41.6 | 3103.7 |
20 | 0.501 | 999 | 45.4 | 3746.8 |
10 | 0.574 | 926 | 48.4 | 4319.0 |
3.3 | 0.712 | 788 | 53.7 | 5403.4 |
1 | 0.897 | 603 | 60.0 | 6898.5 |
0.5 | 1.022 | 478 | 64.0 | 7936.1 |
0.5 +35%CC | 1.410 | 90 | 74.7 | 11248.0 |
2.2.4 Exceedance Flow Considerations
The SuDS pond will be designed to provide an exceedance flow route for storm events larger than the design event of 0.5% AEP plus a 35% climate change allowance. The SuDS pond will include a downgradient notch within the functional crest and fill embankment to enable any overflow from exceedance events do not simply overtop the structure. Overflows will be conveyed to the Innerwick Burn via a preferential flow route in the form of a discrete, shallow grassed overflow channel that will follow the alignment of the outlet pipe.
2.3 Proposed Temporary Surface Water Drainage Strategy
2.3 Proposed Temporary Surface Water Drainage Strategy
2.3.1 Overview
Temporary construction drainage has been proposed for all elements of the Proposed Development and associated ancillary infrastructure.
In the vicinity of the onshore substation, it is proposed that an arrangement similar to the permanent drainage solution is implemented at as early a stage of the construction programme as possible, to enable what will eventually be the permanent SuDS pond to be used for temporary drainage and to control silt-laden runoff. Silt fencing and cut-off ditches (fitted with check dams) are proposed at the toe of the platform fill embankments, with flows collected and routed to appropriately sized settlement ponds.
A similar approach is proposed at the various construction and HDD compounds, with runoff intercepted using subsurface herringbone systems discharging to construction drainage ditches (fitted with check dams) and routed to settlement ponds. Should additional areas be used for laydown or material storage / stockpiles, further silt fences downstream of these areas are proposed, with cut-off ditches to direct flows to settlement ponds.
The outflows of settlement lagoons will be discharged to watercourses where available in the vicinity or to level spreaders to disperse the flow overland as per the pre-development hydrological regime where a watercourse is not located nearby.
Typical temporary drainage details have also been provided for managing runoff from stockpiles, haul roads, access and the general cable corridor. Construction drainage for the areas will include silt fencing, cut-off ditches (fitted with checks dams) and settlement ponds.
Full details of the proposed temporary drainage strategy are shown in drawings TDW-000 to TDW-009.
The temporary drainage mitigation measures proposed are not final nor exhaustive. Other alternative measures may be implemented to achieve similar objectives and this would be at the discretion of the appointed Principal Designer / Contractor at the post planning stages.
2.3.2 Design Criteria
The temporary drainage design outlined in the subsequent section and relevant drawings have been prepared to an outline detail for the full Proposed Development. Detailed design will be undertaken at the post planning stage and should be designed in accordance with the following key guidance documents:
SEPA (2021) Water run-off from construction sites (WAT-SG-75)
CIRIA (2001) Control of water pollution from construction sites (C532)
CIRIA (2006) Control of water pollution from linear construction projects (C648/C649)
The outline designs provided at this stage have been undertaken in reference to the above documents.
3. Foul Water Drainage Scheme
3. Foul Water Drainage Scheme
With reference SEPA’s Regulatory Method for Indirect Sewage Discharges to Groundwater[5], SEPA’s order of preference for means of discharge are:
Connect to public sewer
Discharge to land
Discharge to watercourse
Connection to a public sewer is not viable due to the distance and elevation difference between the wastewater generation facilities within the site (i.e. the substation) and the closest sewer. Discharge to land generally requires a percolation value (Vp) between 15 and 100 secs/mm. The results of the ground investigation indicated poor infiltration capacity of the underlying material, suggesting that VP values are likely to be >140 secs/mm; therefore, the following SEPA guidance applies:
“If the Vp value is: >140 secs/mm Consider other disposal options including appropriately treated effluent to surface waters (normally via a partial soakaway) or for a discharge to land, a filtration system or construction of a mound soakaway in accordance with the aforementioned Technical Handbook.” |
Discharge to land is therefore viable ensuring the above guidance is adhered to and the proposed secondary treatment to meet the above guidance is discussed below.
The Proposed Development will likely accommodate 1-2 persons visiting per day. However, in the event of maintenance being undertaken there may be up to 20 visitors in total. In order to provide a conservative design, the foul drainage design has been sized to accommodate a P.E. of 15.
Primary treatment of the foul flows is to be provided by a private packaged sewage treatment plant (Klargester Biodisc or similar approved).
In order to provide secondary treatment of the foul flows, a filter mound is proposed. This has been designed in accordance with BRE 478[6] and a summary of the filter mound parameters is included in Table 7 below.
Table 7 Summary of Filter Mound Parameters
Parameter | Units | Value | Notes |
|---|---|---|---|
Population Equivalent (p.e.) | No. persons | 15 | Calculated based on data provided by SSE and reference to SEPA’s guidelines |
Filter Material Percolation Rate (Vf) | s/mm | 45 | Taken from BRE 478: Filter Mound Design |
Native Soil Percolation Rate (Vp) | s/mm | >140 | Approximated, given material encountered during GI and negligible infiltration during soakaway testing |
Minimum Distribution Area | m2 | 168 | = p.e. x Vf x 0.25 |
No. Infiltration Pipes | - | 5 | - |
Infiltration Pipe Diameter | mm | 100 | 80mm is the minimum diameter for gravity fed system |
Infiltration Pipe Spacing | m | 1.50 |
|
Distribution Layer Width [A] | m | 7 | Includes 100mm cover at each end pipe |
Distribution Layer Length [B] | m | 24 | - |
Gravel Depth [F] | mm | 300 | Depth of gravel in the distribution layer |
Depth of Filter Material [D] | mm | 700 | Minimum depth for level base application |
Cap Depth at Edge of Distribution Layer [G] | mm | 300 | Minimum allowable depth |
Cap Depth at Centre of Distribution Layer [H] | mm | 450 | Minimum allowable depth for raised top |
Upslope Taper [J] | m | 3.90 | = (D+F+G) x 3:1 slope |
Downslope Taper [C] | m | 3.90 | Same calculation as [J] for level application |
Sideslope Taper [K] | m | 4.35 | = (D+F+H) x 3:1 slope |
Mound Length [L] | m | 32.7 | = B + 2K |
Mound Width [W] | m | 14.8 | = J + A + C |
Mound Base Area | m2 | 484.0 | = L x W |
It is noted that BR478 design methodology is for domestic applications. As such the population equivalent used within the design calculations and to inform filter mound sizing assumes a larger daily loading per person than would be expected for maintenance workers on a substation site. Therefore the proposed filter mound dimensions calculated provides a conservative design.
Details of the proposed foul drainage strategy and filter mound details are presented as Drawing DRA-002 and Drawing DRA-003 respectively.
4. Conclusions
4. Conclusions
ITPEnergised (ITP) has been appointed by SSE Renewables (The Client) to provide support and input to the onshore component of the Environmental Impact Assessment Report (EIAR) submission to support a planning application for Berwick Bank Offshore Windfarm.
This report provides the relevant design information relating to the permanent surface water and foul water drainage of the proposed substation including details of the proposed Sustainable Drainage Systems (SuDS) and also includes details of temporary construction drainage for the full Proposed Development.
The proposed permanent surface water drainage strategy presented within this report demonstrates that adequate SuDS space provision is afforded within the design and the scheme is feasible and compliant to appropriate best practice and regulatory requirements.
Outline temporary drainage mitigation measures for the construction phase have been presented within the report and associated supporting drawings.
The proposed foul water drainage strategy presented indicates that foul water arisings from the Proposed Development can be discharged safely to ground via a mound soakaway and secondary treatment provision.
Taking all of the above into account it is considered there is no impediment to the development being granted planning permission on the grounds of surface water and foul water drainage provision.
[1] CIRIA (2015) The SuDS Manual, Report C753
[2] East Lothian Council (2018) LDP 2018, Sustainable Drainage Systems, Supplementary Planning Guidance
[3] Institute of Hydrology Report No.124 (1994) (IH R124), Flood estimation for small catchments, June 1994
[4] MicroDrainage (2020), Innovyze Drainage Design and Modelling Software (Version 2020.1)
[5] SEPA, Regulatory Method (WAT-RM-04): Indirect Sewage Discharges to Groundwater (2017)
[6] BRE 478: Mound Filter Systems for the Treatment of Domestic Wastewater (2008)