

1. Sandeel Fisheries Compensation
1.1. Executive Summary
1.1. Executive Summary
- Poor fisheries management can have important negative effects on fish stocks that many fish-eating seabirds depend upon. There are numerous examples of the benefits of improvements to fisheries management to the demography of breeding seabirds.
- In the North Sea the sandeel (Ammodytes spp.) is a very important forage fish and a key species for the whole ecosystem. Current fisheries management of the sandeel stocks in the North Sea has depleted these stocks below the level necessary for healthy fish-eating seabird populations.
- This report demonstrates that fisheries can deplete fish stocks and that this depletion has negative effects on seabird demography. Further, it shows that improvements to fisheries management can increase stocks and improve the demography of seabirds that depend upon those stocks.
- A review of published material has provided multiple examples of the application of Marine Protected Areas (MPAs) or No-Take Zones (NTZ’s) that have increased fish stocks and seabird populations have benefited from these increases.
- Based on the information in this review, further analyses of the potential effects of improved fisheries management of sandeel stocks in the North Sea Sandeel Area 4 (SA4) as a suitable compensation measure for predicted impacts from the Proposed Development was warranted.
- Sandeels in SA4 have been exploited as a commercial fishery for many decades. Predicted sandeel Total Stock Biomass (TSB) in SA4 declined through 1990’s and early 2000’s. A no take “box” was added to SA4 in 1999 as a tool to manage the sandeel stock for fisheries exploitation. The stock in SA4 showed signs of recovery from 2006 to 2018, but recent increases in fishing outside the box has resulted in poor sandeel stock recovery in recent years.
- Multiple studies have demonstrated the importance of sandeel stocks for breeding seabirds in the North Sea. Both productivity and adult survival have been shown to be negatively affected by low sandeel availability for the species being assessed here. There was also strong evidence that the foraging range for breeding seabirds is affected by prey availability, including sandeels in the North Sea. Seabirds in SA4 are likely to rely on sandeel abundance across a large part of the area, not only the area inside the box closed to fishing.
- Evidence of strong relationships between sandeel TSB in SA4 and population size, adult survival and productivity was shown in this study from seabird data collected by UKCEH on the Isle of May for kittiwake, guillemot and puffin. For razorbill strong relationships were shown for population size and adult survival, though not for productivity. This was thought to be due to the difficulties of studying this species, which nests, partly, in cracks in cliffs, under rocks, etc. making data gathering challenging.
- It was shown that there was a strong relationship between fishing effort and sandeel spawning stock biomass in SA4, suggesting that fishing effort negatively effects the sandeel stocks in SA4. In addition, previous modelling work has shown that removal or reduction in fishing pressure on sandeels in the North Sea would result in increases in sandeel populations. This is a pattern typically seen in other fisheries on other fish species around the world.
- There is evidence that the sandeel box only provides limited benefits to seabirds and that the appropriate spatial scale of management of the fishery to benefit seabirds is at the whole stock level (i.e., SA4). Therefore, the best available evidence shows that improvements to the management of the SA4 stock could be used as a compensation measure for predicted impacts from the proposed development.
- The relationships between sandeel TSB and seabird demography from the Isle of May were used to predict the likely gains to seabirds from increasing the TSB in SA4. The additional number of birds per annum predicted from these relationships was compared with the predicted impacts on the relevant SPA populations from the proposed development alone. Five compensation scenarios were used to show the range of potentially realistic changes as a result of the proposed compensation measures. The scenario that produced the smallest benefit was the change in sandeel TSB from 300,000 to 400,000 tonnes. The largest predicted change to SPA population was from the change in sandeel TSB from 100,000 to 200,000 tonnes. This was due to the shape of the relationships between species survival and productivity on the Isle of May and sandeel TSB in SA4.
- Across the range of likely changes in sandeel TSB in SA4, it was found that reducing or removing fishing pressure would have positive effects on adult survival and productivity. The positive effects of these predicted changes in demographic parameters were compared with the negative effects of the three predicted impact scenarios from the Proposed Development alone. Three different approaches to were made:
- Predicted increase in number of adult birds in each SPA population and in the SPA network based on increased adult survival;
- Predicted change in populations growth rate and size due to the effects of compensation and impacts combined using PVA; and
- Predicted relationship between CRG and impact level compared with three impact prediction scenarios, using PVA.
- For all three approaches, for all species and all SPAs, it was clear that the predicted minimum benefit from reducing or removing fishing pressure in SA4 was sufficient to compensate for all predicted impact scenarios.
1.2. Introduction
1.2. Introduction
- There are numerous examples from around the world of the negative effects of poor fisheries management on fish stocks. In many cases these fish stocks are important for the breeding success and/or survival of seabird populations that forage on these stocks. There have been numerous examples of the benefits of improved fisheries management on fish stocks and consequent benefits to seabird populations.
- In the North Sea a key species for the whole ecosystem is sandeels. This lipid rich fish occurs in suitable sandy habitat across the North Sea. Sandeels feed on plankton and are predated by seabirds, marine mammals and other fish. Their life cycle is well known, and populations tend to be driven by occasional especially good years. Sandeel populations can be limited by availability of plankton to feed on, but also by predation from a variety of species.
- There has been a commercial fishery for sandeels in the North Sea since the 1960s. At present the fishery in the North Sea is almost entirely from Danish fishing vessels, though there are some Norwegian vessels which fish in the Norwegian sector of the North Sea. Fishing mortality on sandeel populations in the North Sea has been high, with peaks of one million tonnes per annum being landed in the 1990s. The stocks are now under management, but this is based on a “surplus production” model, which aims to remove the maximum sustainable yield. This management approach maintains stocks well below the level needed for seabirds to maintain high breeding success. The stocks are recognised as seven discrete populations, with the population off the east coast of Scotland (Sandeel Area 4 – SA4) including a closed “box”. This box was introduced as a management measure in response to declining total stock biomass (TSB). While stocks have begun to recover from lows in the early 2000s, fishing activity has increased in recent years. The stock is still managed as a single entity, with no adjustment for the presence of the box.
- Many seabirds in the North Sea are known to be dependent on sandeels, particularly in the breeding season. Evidence from the east coast of Scotland and in Shetland has shown that breeding success of many species can be affected by low sandeel abundance. There is also evidence from kittiwakes that adult survival may be reduced if sandeel stocks are sufficiently depleted.
- This report demonstrates that fisheries can deplete fish stocks and that this can harm seabird populations. It will also be shown that improved management of fisheries can increase fish stocks and improve the health of breeding seabird populations dependent on those fish stocks. This report will show that current management of sandeel stocks in the North Sea, and in SA4 specifically, has reduced sandeel stocks and that this has had a negative effect on seabird populations. However, recovering sandeel stocks will be shown to have a positive effect on both adult survival and productivity of four key seabird species by comparing the TSB of sandeels in SA4 with demographic parameters from the long-term study on the Isle of May by the UK Centre for Ecology and Hydrology (UKCEH). This study will show that the current management of the SA4 fishery using the sandeel box is not at a large enough spatial scale to provide a sufficiently reliable stock for seabirds on the east coast of Scotland. Berwick |Bank Windfarm Limited (the Applicant) therefore proposes that further removal/reduction of fishing pressure on the sandeel population in SA4 is a suitable, and sufficient, compensation measure for the predicted impact from the Berwick Bank wind farm (hereafter the Proposed Development) on Special Protected Areas (SPAs) protecting:
- Black-legged kittiwake (hereafter “kittiwake”) Rissa tridactyla;
- Common guillemot (hereafter “guillemot”) Uria aalge;
- Razorbill Alca torda; and
- Atlantic puffin (hereafter “puffin”) Fratercula arctica.
- The report assesses the levels of uncertainty in the assessment, including the uncertainty in reaching robust conclusions from correlative data. This uncertainty affects the precaution taken in assessing the efficacy of the proposed compensation measures. Through the approach of ameliorating the effects of uncertainty by applying adequate precaution, the assessment will show that there is sufficient compensation available through the proposed reduction or removal of fishing pressure on sandeels in SA4 to a high level of confidence in the conclusions reached.
1.3. The effectiveness of Marine protected areas
1.3. The effectiveness of Marine protected areas
- Compensation measures may be needed for SPA seabird populations due to predicted impacts from the Proposed Development. One of the potentially beneficial measures would be to improve the demographic parameters of seabird populations predicted to be impacted by the Proposed Development through the closure or management of fisheries of seabird prey species. As such, the influence of prey fish abundance on seabird demographics was reviewed. This review is summarised here, and the complete review is available in Annex A - Review of Marine Protected Areas.
- There are numerous reviews of the evidence that protected areas benefit the conservation of species, communities, and ecosystem services. In particular, fishery closures strongly promote the recovery of fish stock biomass following heavy exploitation (MacNeil et al. 2015, Cabral 2020). Fishery closures can take the form of technical measures (specified constraints on gear use within a fishery; McClanahan et al. 2014, Campbell et al. 2018), periodic or seasonal closures (Cohen and Alexander 2013), or rights-based controls on access into the fishery. Such constraints on fishing may be the most effective measures to achieve conservation objectives of marine protected areas (MPAs) (Campbell et al. 2018, Cabral et al. 2020, Vilas et al. 2020).
- From analysis of 87 MPAs worldwide, Edgar et al. (2014) defined five key factors that determine the effectiveness of an MPA; the extent to which fishing is limited, the level of enforcement of fisheries constraints, MPA age, MPA size, and presence of continuous habitat allowing spill over of fish or shellfish from the MPA into surrounding waters. Similarly, Zupan et al. (2018) found that the designation of MPAs alone may not result in the lessening of some human threats, which is highly dependent on management goals and the related specific regulations that are adopted.
- Baskett and Barnett (2015) concluded in relation to fishery no-take protected areas “Responses at each level depend on the tendency of fisheries to target larger body sizes and the tendency for greater reserve protection with less movement within and across populations. The primary population response to reserves is survival to greater ages and sizes plus increases in the population size for harvested species, with greater response to reserves that are large relative to species' movement rates. The primary community response to reserves is an increase in total biomass and diversity, with the potential for trophic cascades and altered spatial patterning of metacommunities. The primary evolutionary response to reserves is increased genetic diversity, with the theoretical potential for protection against fisheries-induced evolution and selection for reduced movement.” The potential for the combined outcome of these responses to buffer marine populations and communities against temporal environmental heterogeneity has preliminary theoretical and empirical support. However, while the benefits from many MPAs have been widely recognised, not all MPAs have successful outcomes. Giakoumi et al. (2018) reviewed 27 detailed case studies from around the world and concluded that the most important factor determining the success or failure of a MPA was the level of stakeholder engagement. This conclusion was also reached in a comparison between two MPAs for coral reef fish in the Philippines, one successful and one unsuccessful, because constraints on fishing failed at one site due to a lack of community support (Russ and Alcala 1999).
- Many examples of the effects of fisheries on fish stocks and the effects of MPAs on those stocks were found (e.g. Fernandez-Chacon et al. 2020, Jaco and Steele 2019, Ballantyne 2014). These are described in detail in Annex A - Review of Marine Protected Areas.
- One of the key benefits of MPAs is to create “spillover”. Many studies present evidence that spillover occurs from MPAs and so supports fisheries in the region (e.g. McClanahan and Mangi 2000, Gell and Roberts 2003, Abesamis and Russ 2005, Goni et al. 2008, Harmelin-Vivien et al. 2008, Stobart et al. 2009, Goni et al. 2010, Vandeperre et al. 2011, Florin et al. 2013, Huserbråten et al. 2013, Kerwath et al. 2013, Rossiter and Levine 2014, Alos et al. 2015, Di Lorenzo et al. 2016, Sackett et al. 2017, Kleiven et al. 2019, Kough et al. 2019, Marshall et al. 2019, Cabral et al. 2020, Di Lorenzo et al. 2020, Vilas et al. 2020, Sala-Coromina et al. 2021Further studies are reviewed in Annex A - Review of Marine Protected Areas.
- While there is much empirical evidence of increases in sizes and numbers of animals within MPAs compared with control areas outside the MPA, another approach to assessing the benefits of MPAs is to use scenario modelling. Several examples of scenario modelling are described in Annex A - Review of Marine Protected Areas.
- The success of very many MPAs and No Take Zones (NTZs) around the world has led to a more strategic approach to marine conservation designations in some countries. Examples are provided in Annex A from the State of Victoria, Australia, (, the northern Channel Islands, California. and the Great Barrier Reef, Australia (Sobel and Dahlgren 2004).
- On the high seas, 286,200 km2 of the North-East Atlantic was designated as six MPAs in international waters under the Convention for the Protection of the Marine Environment of the North-East Atlantic (the OSPAR Convention) in 2010, which is considered to be the start of a process of developing an ecologically coherent and representative MPA network in that ocean (O’Leary et al. 2012).
- In England, in addition to existing and new SPAs and SACs, 91 Marine Conservation Zones (MCZs) have been designated between November 2013 and May 2019 as an ecologically coherent network in terms of representation of species and habitats. In Scotland, a combination of marine extensions to SPAs originally designated for breeding seabirds, designation of marine areas as SPAs for nonbreeding seabirds, designation of SACs for marine mammals, MPAs for marine mammals, fish and marine invertebrates, comprise 225 sites providing protection over more than 37% of Scotland’s marine waters. Many of these sites have been designated within the last few years, so too recently for any assessment of changes that may follow as a consequence of management. Not all of these MPAs involve establishment of fisheries restrictions, depending on the objectives for individual sites. In addition to SPAs, SACs and MPAs, five other area-based measures include a temporary no-take zone for sandeel fishing off east Scotland, which has remained in force without any suggestion that this will be revoked.
Case studies of NTZs that influence seabird demography
- The review found multiple case studies of MPA’s or NTZ’s that had an influence on seabird demography. These are detailed in Annex A. Very few MPAs/NTZs have been designated with the objective to enhance conservation of seabird populations (Ronconi et al. 2012, Hentati-Sundberg et al. 2020). However, that outcome could arise if MPA/NTZ designation resulted in a reduction of seabird bycatch in fisheries, or if the MPA/NTZ resulted in a bottom-up increase in energy flow through the food web up to seabirds (i.e. increased the abundance or quality of their preferred foods; Hentati-Sundberg et al. 2020), or if MPA/NTZ designation improved the quality of breeding habitat for seabirds (for example by reducing human disturbance, removing threats from alien invasive mammal predators, or improving nest site quality).
- Several studies have focused on the potential of designating or managing marine protected areas for seabird conservation (Lascelles et al. 2012, Ronconi et al. 2012, Sherley et al. 2017). Studwell et al. (2021) presented a habitat prioritization approach for identifying critical areas for wildlife conservation action, including seabirds. Silva et al. (2020) investigated spatial overlap between a key forage fish species (sandeel) and humpback whale and great shearwater in the Gulf of Maine, USA. Both the cetacean and the seabird showed very strong and consistent match in spatial distribution with that of sandeel. They proposed managing protected areas for these top predators on the basis of the key role of sandeel habitat in determining predator distributions in that system.
- In a review of the pressures and threats to global populations of penguins, Boersma et al. (2020) identified marine spatial planning as the highest ranked conservation need to conserve endangered penguin populations, for which they particularly emphasize the need for MPAs to manage fisheries to ensure that adequate prey resources for penguins remain in areas critical to their breeding success (i.e. close to colonies) and survival (i.e. over larger spatial scales when penguins are dispersed from the colony sites).
- Requena et al. (2020) used tracking data from nine seabird species and one marine mammal to identify marine hotspots around Tristan da Cunha, South Atlantic Ocean. They concluded that tracking data provide reliable information that could be used to define MPAs for these top predator populations. Analyses of seabird tracking data in UK waters was considered to provide effective identification of seabird hotspots that could be designated as MPAs (Cleasby et al. 2020). Critchley et al. (2019) used seabird tracking data to test whether simple foraging radius models from colonies provide a cost-effective alternative to large-scale surveys or tracking studies. They showed that foraging radius distribution broadly matched foraging areas identified from tracking breeding adults from colonies or from aerial surveys..
- Perrow et al. (2015) also used a combination of tracking of breeding adults, a boat-based survey, and a foraging radius approach to define the at-sea MPA (in this case a SPA marine extension) for breeding little terns. Similarly, tracking data from marine mammals have been used to justify decisions on boundaries of MPAs, in some cases providing retrospective justification (e.g. Kirkman et al. 2016). Arias-Del-Razo et al. (2019) showed that MPAs with large populations of marine mammals still provided large gains in fish biomass (which increased with the age of the MPA), despite the presence of marine mammals that could be a major predator on those fish. However, Kelaher et al. (2015) concluded that reef fish increased less in MPAs with large seal populations than in MPAs without large numbers of seals and suggested that if the aim is to recover reef fish populations, designating MPA sites away from seal colonies may be preferable. An implication of this, of course, is that if the aim is to improve conditions for top predators, then marine habitat management that enhances populations of fish on which the predators can feed will be an effective conservation measure.
- Bertrand et al. (2012) showed that the foraging efficiency of breeding seabirds in Peru may be significantly affected by not only the global quantity, but also the temporal and spatial patterns of fishery removals of forage fish (in this case, anchoveta). They concluded that, together with an ecosystem-based definition of the fishery quota, an ecosystem approach to fisheries management should limit the risk of local depletion around breeding colonies using, for instance, adaptive marine protected areas around colonies of forage-fish dependent seabirds.
- Hentati-Sundberg et al. (2020) developed a bioenergetics model linking top predators (such as seabirds) breeding biology and foraging ecology with forage fish ecology and fisheries management. They applied their framework to the case study example of common guillemots and razorbills at a Baltic Sea colony where they depend on sprat and juvenile herring as key prey species. They showed that a fishery management target of ‘one-third-for-the-birds’ (Cury et al. 2011; see section 1.6 for further details on the “Cury threshold”) is sufficient to sustain successful breeding by the seabirds. However, the results also highlight the importance of maintaining sufficient prey densities in the vicinity of the colony, suggesting that fine-scale spatial fisheries management is necessary to maintain high seabird breeding success, and therefore indicating the value of a MPA that limits forage-fish fishery harvests in areas close to the seabird colony.
- The following example case studies are reviewed in detail in Annex A - Review of Marine Protected Areas:
- British Indian Ocean Territory (BIOT) MPA;
- South Georgia and South Sandwich Islands (SGSSI) MPA and seabirds;
- Mediterranean MPAs and foraging Yelkouan shearwaters (Puffinus yelkouan);
- The Namibian Islands’ Marine Protected Area, designated specifically for its seabirds; and
- Habitat management plans to conserve African penguins in South Africa
Discussion and Conclusions
- This review found numerous examples that changes to fisheries management improved prey species populations resulting in positive demographic change for seabird population that foraged on those prey. This was across a wide variety of seabird taxa, fish taxa, fisheries type and locations around the world. These results suggest that changes to the fisheries of key prey fish populations has a good potential provide suitable compensation measures for impacts predicted to affect protected seabird populations.
- This review therefore establishes a good baseline to explore the potential benefits to sandeel stocks from changes to fisheries management in the North Sea and whether this could result in positive outcomes for seabirds, as carried out in the remainder of this report.
1.4. Sandeels in the North Sea
1.4. Sandeels in the North Sea
- There are several species of sandeel, but the abundant species in UK waters is the lesser sandeel Ammodytes marinus. This is a lipid-rich short-lived shoaling fish, widely distributed in UK waters where suitable sandy seabed habitat occurs (Heessen et al. 2015). The biology of sandeel is well understood. It is a key component of North Sea marine ecosystems. It feeds on small planktonic animals and itself is eaten by seabirds, marine mammals, and many large predatory fish (ICES 2017, Wright et al. 2018, Furness & Tasker 2000, Dunn 2021). Adult sandeels (mostly two years old or older) spawn in late winter, the eggs drift with local currents, and the larvae that hatch then feed on small plankton, grow rapidly and store lipids. In July-August the larvae metamorphose into adult fish and bury themselves in sandy areas of seabed to overwinter, living off their stored lipid reserves. The timing of this varies considerably, presumably depending on food availability and therefore how quickly the larvae grow and how much lipid they are able to store. These juvenile sandeels tend to remain in the water column much longer than the older fish do, so that seabirds mostly switch to feeding on these juveniles later in the breeding season. They may continue to feed on juveniles post-breeding, but there is less evidence on diet after the breeding season. Adult sandeels emerge to spawn in winter so may be available to seabirds then, but some diving species can dig sandeels out of the seabed so can potentially continue to feed on this food supply throughout the winter. In spring they start feeding on the seasonal zooplankton bloom, moving between their sandy sediment and the plankton layer near the sea surface where they feed. Once they have accumulated enough lipid, they bury themselves in the sand and live off their stored lipid; usually this is in June-July, before the young of the year have completed their development. In some years survival of sandeel larvae is low, and relatively few join the adult population. In some years high survival leads to high recruitment. The biomass of the sandeel stock therefore tends to be driven by occasional especially good years (ICES 2017). In sandeel stocks with low fishing mortality, there is evidence of density-dependence; years with high stock biomass tend to show low recruitment, whereas high recruitment is more likely when adult stock biomass is lower (ICES 2017, Lindegren 2018). That implies “bottom-up” control, with sandeel abundance constrained by plankton production (which is in turn influenced by climate change) (Lindegren et al. 2018, Frederiksen et al. 2007). In 1950s-80s stocks of large predatory fish in the North Sea (cod, haddock, whiting) were depleted by high fishing effort. Those predatory fish fed heavily on sandeels and their depletion will have reduced natural mortality of sandeels (Sherman et al. 1981). There is evidence that sandeel abundance in the North Sea increased in the 1970s-80s, particularly after stocks of herring and mackerel had been reduced drastically by overfishing (Sherman et al. 1981). Herring and mackerel compete with sandeels for zooplankton food, but adult herring and mackerel also feed on sandeel larvae. That implies “top-down” control, with sandeel abundance constrained by impacts of predation (Frederiksen et al. 2007, Sherman et al. 1981). The evidence suggests that strength of “bottom-up” and “top-down” control of sandeel abundance may vary in different years and different regions, but each can be important (Frederiksen et al. 2007).
The North Sea sandeel fishery
- The North Sea sandeel fishery began in the 1960s, to provide raw material for production of fish meal and fish oils after the North Sea herring and mackerel stocks had been overfished and depleted, so could no longer provide that resource. The fishery is almost entirely fished by Danish boats, with a small catch taken by Norwegian boats. At its peak in the 1990s this largely unregulated fishery was removing a sandeel biomass of one million tonnes per year. In the early 2000s the stock biomass declined rapidly, and so did landings and profitability of the fishery (Engelhard et al. 2014, Lindegren et al. 2018, Hill et al. 2020). Stock biomass has remained low and not returned to the productive levels of the 1980s despite the fishery now being under quota regulations (ICES 2017, Lindegren et al. 2018). However, despite regulation, the imposed fishing mortality on sandeel stocks has often been high (ICES 2017). This is because management of the fishery is based on a “surplus production” model. That model aims to remove as many sandeels as possible, consistent with leaving enough adult fish to produce future recruitment (ICES 2017). The threshold quantity thought to be necessary to achieve future recruitment (known as Blim) is a spawning stock biomass that is far below the abundance needed to allow kittiwakes to achieve high breeding success (ICES 2017, Dunn 2021, Cury et al. 2011, Hill et al. 2020). Current management of the sandeel stock permits a reduction of sandeel biomass well below levels needed by dependent seabirds, but not below the much lower threshold of Blim. However, because there is considerable uncertainty in the modelling of short-lived fish such as sandeel, in practice the stocks can even be reduced below Blim for some years. This problem was identified and highlighted in the ICES Benchmark Working Group on sandeels (ICES 2017) but the problem persists (Dunn 2021, ICES 2022).
- The North Sea sandeel is now managed as seven distinct stocks (ICES 2017; Figure 1.1 Open ▸ ). ICES sandeel area 1r (SA1r) is relevant to seabirds in the southern North Sea and much of the fishery is on that stock, especially around Dogger Bank. ICES SA7r is around Shetland. ICES SA4 is off east Scotland and north-east England and is the area of relevance to the Proposed Development.
- The stock in ICES SA1r was subject to high fishing mortality levels (F=0.8 to 1.2) during 1999-2009 and declined considerably in abundance. In recent years the spawning stock biomass (SSB) in this area has been less than 10% of its highest historical level and slightly below the limiting spawning stock biomass at which ICES should recommend closure of the fishery (Blim of 110,000 tonnes SSB) because there is an increased risk of recruitment failure in this stock (ICES 2021). The SSB was below Blim in 2019 and 2020 and only marginally above that limit in 2021. In 2021, ICES advised that the total allowable catch (TAC) should be less than 5,464 tonnes and the TAC agreed was 5,351 tonnes (ICES 2022). However, the catch taken was 16,944 tonnes (ICES 2022), nearly three times the size of the set TAC. A hindcast analysis of the ICES SA1r sandeel stock to assess the consequence of the high fishing mortality estimated that sandeel spawning stock biomass would have been about twice as large now as it is, if the fishery had maintained fishing mortality (F) at F=0.4 rather than at the levels of F=0.8 to 1.2 as seen during 1999-2009 (Lindegren et al. 2018). By implication it would have been even larger if there had been no fishing on sandeels.
- The Shetland stock was the first to collapse, in the late 1980s (Furness & Tasker 2000). At the time, the collapse was attributed as possibly due to climate change and changes in ocean currents bringing sandeel larvae to Shetland from Orkney, as it was thought that fishing pressures would not affect short-lived fish with recruitment driven by environmental factors. The fishery was abandoned due to low sandeel biomass and the stock is no longer monitored, but seabird breeding success has been very slow to recover at Shetland (JNCC 2021 and annual Shetland Bird Reports and Fair Isle Bird Observatory reports). It is possible that recovery of this stock has been inhibited by increased abundances of adult herring and adult mackerel in the northern North Sea and increases in stocks of large predatory fish, as well as by high natural mortality imposed on the depleted stock by marine mammals and seabirds (Saraux et al. 2020). Lack of any assessment of sandeel stock at Shetland (because it is no longer of commercial importance) makes further interpretation speculative.
Figure 1.1 Sandeel in the North Sea: Stock areas for the seven sandeel stocks. The border of the Norwegian Exclusive Economic Zone (EEZ) is also shown. The closed part of Sandeel Area 4 is shown with hatched markings.
- The stock in ICES SA4 declined between 1992 and 1999 when subject to high fishing mortality ( Figure 1.2 Open ▸ ). An area off east Scotland was closed to sandeel fishing as a result of evidence from breeding failures of kittiwakes at colonies in the region (especially the Isle of May where this was studied in detail) indicating that the sandeel stock had been severely depleted. The closure was intended to protect the depleted sandeel stock to allow recovery, not specifically to protect kittiwakes and other seabirds. However, fishing was allowed within ICES SA4 outside the closed box, so that fishing mortality on the stock was not necessarily reduced by the box but was concentrated on an area of the same stock that was more distant from seabird colonies. The stock in ICES SA4 recovered from a very low level in 2000-05, with a progressive increase in abundance up to 2018 ( Figure 1.3 Open ▸ ).
Figure 1.2 Abundance (TSB in tonnes) of sandeels in ICES SA4 (which includes the no-take zone off east Scotland that was established in 2000) in the period 1993 to 2001. Data from ICES 2022.
Figure 1.3 Abundance (TSB in tonnes) of sandeels in ICES SA4 (which includes the no-take zone off east Scotland that was established in 2000) in the period 2007 to 2018. Data from ICES 2022.
- The sandeel box has somewhat limited fishing impact on the SA4 stock since 2000 and the TSB in SA4 has increased from a low of 33,000 tonnes in 2008 to 481,000 tonnes in 2020 (ICES 2022). While it seems unlikely that TSB in SA4 would be allowed to drop as low as the levels in 2008, there is no mechanism in place to prevent the fishery from returning to TSB levels this low. Indeed, in 2021 the fishery extracted 51,882 tonnes of sandeels from the open part of SA4 from an estimated TSB of 288,685 tonnes in the whole of SA4 (including the closed box) before this catch was taken. Despite ICES setting a cap on fishing mortality for this stock for the 2021 season, fishing mortality increased to a level far above that cap and was therefore at a level considered by ICES to be unsustainable, even if fishing effort had been distributed across the whole of ICES SA4 ( Figure 1.4 Open ▸ ). The red line in Figure 1.4 Open ▸ shows Fcap, the limit on fishing mortality that, according to ICES, should not be exceeded because the escapement strategy [by which sandeel stocks are managed] is not sustainable for short-lived species unless the strategy is combined with a ceiling (Fcap) on fishing mortality. Fcap for ICES SA4 is set at 0.15. The cap on fishing mortality should be incorporated into stock management. However, this is impossible as the value of fishing mortality is computed from the stock assessment after the fishing has occurred. Thus, a cap on fishing mortality cannot be enforced under this management regime. Since a large part of ICES SA4 is closed to sandeel fishing, the fact that fishing mortality greatly exceeded the cap set for the whole area, while limited to only the open part of the area, was recognised by ICES as unsatisfactory but was still not taken into account within the existing management and assessment process (ICES 2022). Following the high fishing mortality in 2021, sandeel TSB fell dramatically, and spawning stock biomass was assessed to be so low at the end of 2021 that the TAC advised for 2022 was set at zero in January 2022 (ICES 2022).
Figure 1.4 ICES estimates (ICES 2022 Table 9.5.10) of imposed fishing mortality (F1-2) on the ICES SA4 sandeel stock (including the part of the stock that is in the ‘closed’ box).
- RSPB reviewed the latest evidence regarding impacts of sandeel fishing on seabirds in the North Sea (Dunn 2021) and stated, “we identify three serious flaws in the current management of the fishery:
- The sandeel fishery is permitted to operate within the foraging range of red-listed species like kittiwake and puffin breeding at internationally important and legally protected seabird colonies on the UK coast.
- The current approach to setting maximum annual catch levels aims to protect the sandeel stock itself, but not the wildlife that depends on it. Even fishing in accordance with the scientific advice can lead to depletion of sandeel stocks to levels likely have a negative impact on top predators like seabirds.
- Scientific advice on catch levels within sandeel management areas takes no account of zones that are closed by law to sandeel fishing, thus fishing effort is concentrated into a smaller area, potentially leading to overfishing and localised depletion of sandeel.”
- In a recent prepublication study for Defra (unpublished), Natural England have shown that full closure of the North Sea sandeel fishery would increase sandeel biomass by 40%. This was predicted to result in a 42% increase in seabird populations in the North Sea, and a 20% increase in predatory fish that feed on sandeels.
Discussion and Conclusions
- There is strong evidence that the sandeel population in the North Sea, including in SA4, is negatively affected by high levels of fishing mortality. Hindcast modelling by ICES (Lindegren et al. 2018) showed that the sandeel population in SA1r would be larger if fishing mortality had been lower. The Ecopath with Ecosim model of the North Sea sandeel population (unpublished Natural England report to Defra) shows that the sandeel population would be 40% larger if the fishery were closed. In SA4 the sandeel TSB declined prior to the introduction of the sandeel box. The introduction of the box showed that the stock in SA4 would recover if the fishery were closed, but subsequent fishing management illustrates that the population remains low due to the current management approach and is even below the precautionary minimum TSB of 100,000 tonnes.
1.5. Seabirds dependent on sandeels
1.5. Seabirds dependent on sandeels
- Many of the seabird species that breed in the UK feed mainly on sandeels during the seabird breeding season (Furness & Tasker 2000). In the nonbreeding period (August-March), sandeels are mostly buried in the sand so are unavailable to surface-feeding seabirds (terns, skuas, gulls). While these species may continue to feed on juveniles post-breeding, there is less evidence on diet after the breeding season, as birds cannot be trapped or observed at the nest site. However, some seabirds can dive to the seabed throughout much of the North Sea and will dig sandeels out of the sand. That includes shags and guillemots. Those species have been found to have sandeels in their stomachs even in mid-winter (e.g. from autopsies of oiled seabirds). Seabirds that cannot access sandeels when they go deep tend to migrate away from the UK to overwinter where other foods are available, e.g. kittiwakes migrate to Canada, puffins to the mid-Atlantic, terns and skuas to West Africa. Some seabirds can switch from a diet of sandeels to a diet of sprats or juvenile herring, but sprats and juvenile herring tend to be distributed in different parts of the North Sea from sandeels (Heessen et al. 2015) and relatively few seabird species and colonies in the North Sea can manage well in the absence of abundant sandeels (Furness & Tasker 2000).
- There is strong evidence that kittiwake breeding success at North Sea colonies is greatly influenced by sandeel abundance within that part of the North Sea (Furness & Tasker 2000, Carroll et al. 2017, Cury et al. 2011, Frederiksen et al. 2004, Frederiksen et al. 2005, Furness 2007, Olin et al. 2020, Saraux et al. 2020, Sydeman et al. 2017). Indeed, spatial synchrony in breeding success of kittiwakes at different colonies led to the realisation that there are several separate stocks of sandeels in different areas of the North Sea with different dynamics. There is also evidence that kittiwake adult survival is influenced by sandeel abundance; that has been shown at Shetland (Oro et al. 2002) and (for a different sandeel stock) at the Isle of May (Frederiksen et al. 2004). There is evidence indicating that breeding success of terns (especially Arctic terns), skuas, shags, fulmars and puffins is influenced by sandeel abundance (Furness & Tasker 2000, Cury et al. 2011, Furness 2007). In contrast, some seabirds can switch to other prey and their breeding success is not influenced by changes in sandeel abundance. That applies to gannet in particular. Some seabirds appear intermediate in response, with reduced breeding success when sandeel abundance is extremely low, but little effect on their breeding success where sandeel abundance declines slightly. Broadly, the relationship between breeding success and sandeel abundance tends to be non-linear ( Figure 1.5 Open ▸ ), with a collapse in seabird breeding success once sandeel abundance falls to a low level, but there can be a wide range of sandeel abundances where the amount of food is more than enough to sustain high breeding success of dependent seabirds, and seabird breeding success can vary for many other reasons, making these relationships statistically noisy. But the evidence that many UK seabirds fare better when sandeel abundance is good is robust and extensive.
Figure 1.5 Breeding success of kittiwakes at Foula, Shetland, in relation to the Shetland sandeel (SA7) total stock biomass for the years 1976 to 2004.
- There is evidence that many seabird populations in the UK increased considerably in numbers during the 1970s-80s in response to increased abundance of sandeels in the North Sea (Mitchell et al. 2004). More recently, many populations of sandeel-dependent seabirds have declined as sandeel abundances have fallen in response to both bottom-up and top-down influences and fishing pressures (JNCC 2021).
- Tracking studies show that breeding seabirds can travel large distances from their nest sites to search for food (Woodward et al. 2019). Foraging ranges differ among species according to their ecology. Breeding kittiwake maximum foraging range has been reported to be 770 km (Woodward et al. 2019) although most forage within 100 km of their nest site and often much closer. Foraging ranges tend to increase when sandeel abundance is reduced and tend to be larger around larger colonies.
Seabird foraging range during the breeding season
- Seabird foraging during the breeding season, while they are central point foragers, is likely to be influenced by a number of factors. The seasonal and spatial availability of prey will depend on the behaviour and annual cycle of the prey, the effects of oceanographic conditions, and fisheries. Adult birds need to forage to maintain themselves through the breeding season, with the added need to provision chicks after they hatch. The balance of these needs will change through the breeding cycle as the need for chicks to be provisioned and protected from predators or weather conditions changes. During incubation there is less need for return visits to the nest and so adult birds should be able to forage further from the nest. In addition, adult birds can feed on larger prey items than chicks can, so fewer, longer, foraging trips may be possible. During the chick phase the requirements for both prey size and frequency of foraging trips will change, with more frequent trips for smaller prey when chicks are young, but potentially less frequent trips as chicks age, but when larger prey may be preferred. Additionally, the need to protect chicks from predators, and adverse weather conditions, will also vary as chicks age. Smaller chicks will require adults to spend more time at the nest site than when they have larger chicks, constraining foraging range during the early chick-rearing period. Furthermore, several studies have demonstrated that density-dependent prey depletion occurs close to large seabird colonies within a breeding season (known as the ‘Ashmole’s halo’ effect; Weber et al. 2021) such that birds are likely to need to search for food further away from the colony late in the breeding season (i.e. when chicks are close to fledging).
- A clear example of these effects on seabird foraging was shown by Jouventin et al. (1994) who satellite-tracked king penguins (Aptenodytes patagonicus) at different stages of breeding. Birds with large chicks had the longest foraging range. Birds with small chicks had the shortest foraging range. During incubation, foraging range was intermediate between the extremes found with small and large chicks.
- Bass Rock gannets travelled about 50% further from the colony during foraging trips in the incubation period than during chick-rearing, males a mean maximum of 293 km in incubation, 205 km in chick-rearing; females a mean maximum of 308 km in incubation, 224 km in chick-rearing, with these differences being statistically significant (Lane et al. 2020).
- Robertson et al. (2014) showed that kittiwakes breeding on Coquet Island in north-east England foraged much further from the colony during the incubation phase than during the chick rearing phase. Their results showed the mean of the maximum foraging range during the incubation phase could be more than 5 times the distance during chick-rearing (9.03 ± 1.17 km during incubation, 50.95 ± 12.99 km during chick rearing). This reduction in foraging range during the early chick rearing phases was due to the requirement to feed chicks regularly and the shift from adults feeding themselves larger (1+ year group) sandeels during incubation to feeding chicks smaller (0 year group) sandeels. As the breeding season progresses, adult sandeels begin to move into deeper water (further from the colony) and settle into the substrate, while juvenile sandeels remain in the water column (Rindorf et al. 2000).
- In another study on the same species, kittiwakes in a good year with high breeding success showed no difference in foraging range during chick-rearing and during incubation; both were short. However, in a poor year with low breeding success foraging ranges were longer but were very much longer during incubation and only slightly longer during chick-rearing (Osborne et al. 2020). The authors concluded that partners of incubating kittiwakes could make very long foraging trips during the incubation period if food was scarce, but that parents needed to return regularly to provision chicks so were less able to extend foraging range during chick-rearing even though food supply was poor. Food abundance may therefore influence the magnitude of differences in foraging range between incubation and chick-rearing.
- Razorbills breeding on Skomer, South Wales, were shown to have different foraging ranges between incubation and chick rearing (Shoji et al. 2016). This study found that, incubating birds had longer foraging trip durations than chick rearing birds (23.7 ± 12.9 hours and 14.6 ± 13.4 hours respectively) and foraged further from the colony (34.3 ± 9.6 km and 25.49 ± 7.3 km respectively).
- Cairns et al. (1987) reported that common guillemots in their study colony in Newfoundland had a foraging range during incubation (median 38 km) that was more than seven times greater than during chick-rearing (median 5 km).
- Oppel et al. (2018) reported shorter foraging ranges of guillemots and kittiwakes during chick rearing at the colony than during incubation. However, they reported little difference in foraging range of razorbill between breeding stages. Thaxter et al. (2010) noted that guillemot foraging range during the chick rearing phase at the colony was shorter than razorbill, which was likely due to the combination of higher wing loading in guillemot and their provisioning of single prey items to chicks. Razorbills forage further than guillemots but have a lower wing loading and capture multiple prey for chicks on each foraging trip. Thus guillemots, at this narrow part of their annual cycle, will most likely be foraging closer to the colony than other species. However, chick rearing phase of guillemots (and razorbills) annual cycle does not only occur on the breeding colony with fledging occurring relatively early in the breeding season while chicks are still flightless and nutritionally dependent on their male parent. These birds disperse away from the breeding colony very quickly to areas further offshore than those used for foraging during the phase of chicks being fed at the nest (Camphuysen 2002). This behaviour avoids predators, such as large gulls, that occur in greater densities closer to the coast, and allows adults to take chicks to where food is concentrated, but results in offshore waters being a critical part of the breeding season. Since male guillemots moult and become flightless while feeding their dependent chicks at sea, their energetic needs will be relatively high during this part of their annual cycle and being flightless it is critically important that they are in a location with reliable and high food availability. As such, the presence of suitable prey availability in waters further offshore may be more important to the productivity and survival of guillemots and at present the likelihood of these waters being fished is higher, and the fishing mortality on sandeels in those areas is higher, due to the current fisheries management practice in SA4.
- Fayet et al. (2021) tracked puffins from four colonies in a single year with contrasting population demography. They found that puffins foraging from declining populations with low productivity in Norway foraged further from the breeding colony, during the early chick phase, than puffins breeding at stable colonies in Iceland and Wales. Harris et al. (2012) showed that chick rearing puffins undertook two types of foraging trips from the Isle of May. Shorter trips were made during the day to areas near the colony (9 – 17 km), while longer overnight trips were made to areas 38 – 66 km from the colony.
- Among other, related, seabird species similar patterns can be seen. Little auks (Alle alle) have been shown to undertake a dual foraging strategy, with shorter foraging trips for provisions chicks and longer foraging trips for adult self-maintenance (Wojczulanis-Jakubas et al. 2018). Brunnich’s guillemots (Uria lomvia) were shown to forage in deep, offshore, waters further from the colony during incubation, while foraging in shallower, inshore, waters closer to the colony during chick provisioning (Ito et al. 2010).
Discussion and Conclusions
- The available evidence indicates that for seabirds, habitat management zones would be intended to enhance food supply, and the mobility of seabirds means that to be effective any such zones would need to be large. Outside the breeding season, seabirds tend either to migrate substantial distances to overwinter in areas with good food supplies and benign conditions, or in those species that do not migrate, the birds disperse from the breeding area.
- In the breeding season, seabirds become central-place foragers, commuting from their nest site to foraging habitat. While this constrains their spatial distribution, the maximum foraging ranges of many breeding seabirds are large.
- There is strong evidence that sandeel stocks are important for several species of seabirds foraging in the North Sea during the breeding season, including kittiwake and puffin. There is strong evidence that kittiwake breeding success and survival are influenced strongly by sandeel abundance. There is also good evidence that sandeel abundance has an influence on the breeding success of other seabirds. There is strong evidence that the foraging range of seabirds is strongly affected by the need to gather appropriate prey and that this varies during the breeding season. Most tracking studies used to inform the connectivity between foraging areas and breeding colonies has been based on the early chick rearing phase of the season, and that this is likely to be at a time when the foraging range is most constrained. Thus, seabirds in SA4 are likely to rely on sandeel abundance across a large part of the area, not only the area inside the box closed to fishing.
- These conclusions suggest that evidence of the effects of sandeel abundance on the demography of SPA qualifying features predicted to be impacted by the Proposed Development should be analysed. The following section considers the evidence that increasing sandeel abundance results in increases in seabird demography and sandeel abundance can be increased by reducing or removing fishing pressure.
1.6. Seabird compensation through changes in sandeel fisheries
1.6. Seabird compensation through changes in sandeel fisheries
- In order to determine whether changes to management of sandeel fisheries in the North Sea can be used as compensation for impacts from the Proposed Development on breeding seabird SPAs it is important to understand the evidence that sandeel abundance can influence seabird populations, that reducing or removing fishing pressure will have an effect on the abundance of sandeels and the appropriate spatial scale for the compensation measures.
Evidence that higher sandeel abundance results in higher seabird breeding success, survival rate or population size
- There is a strong relationship between kittiwake breeding success and the abundance of sandeels in the area (Furness & Tasker 2000). This was first shown for Shetland (ICES SA7r), with similar results for common guillemot, fulmar, Arctic tern, shag, great skua and Arctic skua, but also applies for kittiwakes in ICES SA4 and ICES SA1r. The relationship is non-linear for all species except Arctic tern. Considering a range of seabirds and different prey fish (but including data from Shetland) models indicate a tendency for seabird breeding success to be reduced once forage fish abundance falls below one-third of the long-term maximum abundance of the prey stock. This has been proposed as the “Cury threshold” to maintain forage fish stocks above levels required by dependent predators. Some seabirds do not show such a relationship; those species are ones that can readily switch to alternative prey types (species such as gannets). For some species (although not kittiwake, guillemot, razorbill or puffin which are the subject of this analysis), data are too limited to be certain if there is a relationship. The closure of sandeel fishing within the box in SA4 provided experimental evidence for the mitigation of fishery impact by closing the fishery. There was an increase in kittiwake breeding success at colonies within the closed area compared to those outside (Daunt et al. 2008, Frederiksen & Wanless. 2006, Frederiksen et al. 2008). Data also indicate that Sandwich tern breeding success also benefitted from the closure.
- Demonstrating a relationship between sandeel total stock biomass and adult survival of seabirds is difficult, in part because few studies have long-term data on adult survival rates of seabirds, but also because survival is likely to be buffered compared to breeding success (long-lived birds protect their survival by abandoning breeding effort when times are bad). However, kittiwake adult survival at Shetland was strongly affected by sandeel stock biomass (Oro & Furness 2002). Survival of Arctic skuas at Shetland was increased by supplementary feeding, implying that low sandeel abundance was responsible for low survival in that species (Davis et al. 2005).
- For each of the focal species in this study the available evidence on changes in sandeel TSB in SA4 was compared with evidence of changes in the demography of the populations breeding on the Isle of May. Available seabird demographic evidence, adult return rate (as a proxy for survival) and productivity) was collated from publicly available data collected by UKCEH and NatureScot.
Kittiwake
- Studies at the Isle of May show a strong relationship between sandeel abundance in SA4 and kittiwake return rates, which are a simple proxy for adult survival ( Figure 1.6 Open ▸ ). Resighting rates of marked birds from the Isle of May studies are sufficiently high from year to year that the return rate will have a very high degree of correlation with apparent survival, and therefore provide a reasonable proxy for survival. In a recent study (Daunt et al. 2020) the return rate (or resighting probability) on the Isle of May was 92% for kittiwake, 99% for guillemot and 97% for razorbill. Plotted residuals for each plot are shown in ANNEX B.
Figure 1.6 Annual return rates of adult kittiwakes at the Isle of May (UKCEH data from online annual reports) in relation to ICES estimates of annual sandeel total stock biomass (tonnes) in SA4 between 2004 and 2019 (ICES 2022). Data for 2020-2021 are not yet published.
- There was also a clear relationship between the productivity of kittiwakes on the Isle of May and the sandeel stock in SA4 across the same time period ( Figure 1.7 Open ▸ ). This relationship was less clear than that for survival. This was likely due to the greater influence of weather and predation events strongly affecting the survival of eggs or chick, compared with the effects of these factors on adult survival. Indeed, the data shown in Figure 1.7 Open ▸ has a single value removed, as predation on chicks on the Isle of May in 2010 reduced productivity to a very low level (0.29 fledglings per nest)[1].
Figure 1.7 Annual productivity rates of adult kittiwakes at the Isle of May (UKCEH data from online annual reports) in relation to ICES estimates of annual sandeel total stock biomass (tonnes) in SA4 between 2004 and 2019 (except 2010) (ICES 2022). Data for 2019-2021 are not yet published.
- Sandeel stock biomass in SA4 impacts on demographic parameters appear to have had an effect on the abundance of kittiwakes nesting on the Isle of May, as there is a significant positive correlation between breeding numbers and sandeel total stock biomass ( Figure 1.8 Open ▸ ). It is likely that sandeel stock also had an influence on other demographic rates, particularly immature survival and age at first breeding. However, there were no data available to make those comparisons.
Figure 1.8 Population size (Apparently Occupied Nests – (AON)) of adult kittiwakes at the Isle of May (UKCEH data from online annual reports) in relation to ICES estimates of annual sandeel total stock biomass (tonnes) in SA4 between 2004 and 2021 (ICES 2022).
Guillemot
- Return rates of common guillemot also showed a relationship with sandeel abundance ( Figure 1.9 Open ▸ ). It is important to note that, as with breeding success, these relationships are non-linear. There can be large differences in sandeel abundance between moderate and high abundance over which range adult survival remains high; survival falls much faster when sandeel abundance falls below a critical threshold level. This means that gains depend on the starting point on the graph. A 10% increase in sandeel abundance may greatly improve breeding success and survival of dependent seabirds if it occurs at low sandeel abundance but will have much less effect if it occurs at high sandeel abundance. Residuals for each plot are in ANNEX B.
Figure 1.9 Annual return rates of adult guillemots at the Isle of May (UKCEH data from online annual reports) in relation to ICES estimates of annual sandeel total stock biomass (tonnes) in SA4 between 2004 and 2019 (ICES 2022). Data for 2020-2021 are not yet published.
- There was also a relationship between the productivity of guillemots on the Isle of May and the sandeel stock in SA4 across the same time period ( Figure 1.10 Open ▸ ). This relationship was less clear than that for survival. This was likely due to the greater influence of weather and predation events strongly affecting the survival of eggs or chick, compared with the effects of these factors on adult survival. It may also be influenced by the fact that guillemot chicks fledge when only partly grown and continue their growth and development at sea; in this species productivity only measures success to shortly before chicks leave the nest sites.
Figure 1.10 Annual productivity rates of adult guillemots at the Isle of May (UKCEH data from online annual reports) in relation to ICES estimates of annual sandeel total stock biomass (tonnes) in SA4 between 2004 and 2019 (ICES 2022). Data for 2020-2021 are not yet published.
- It appears that the effects of sandeel stock biomass in SA4 on demographic parameters also influence the abundance of guillemots nesting on the Isle of May ( Figure 1.11 Open ▸ ). It is likely that sandeel stock also had an influence on other demographic rates, particularly immature survival and age at first breeding. However, there were no data available to make those comparisons.
Figure 1.11 Population size (individuals on land) of adult guillemots at the Isle of May (UKCEH data from online annual reports) in relation to ICES estimates of annual sandeel total stock biomass (tonnes) in SA4 between 2004 and 2021 (ICES 2022).
Razorbill
- Return rates of razorbills also showed a relationship with sandeel abundance ( Figure 1.12 Open ▸ ). It is important to note that, as with breeding success, these relationships are non-linear. There can be large differences in sandeel abundance between moderate and high abundance over which range adult survival remains high; survival falls much faster when sandeel abundance falls below a critical threshold level. This means that gains depend on the starting point on the graph. Residuals for each plot are in ANNEX B.
Figure 1.12 Annual return rates of adult razorbills at the Isle of May (UKCEH data from online annual reports) in relation to ICES estimates of annual sandeel total stock biomass (tonnes) in SA4 between 2004 and 2018 (ICES 2022). Data for 2019-2021 are not yet published.
- Unlike the other species, there was not a relationship between the productivity of razorbills on the Isle of May and the sandeel stock in SA4 across the same time period ( Figure 1.13 Open ▸ ). This was likely due to the greater influence of weather and predation events strongly affecting the survival of eggs or chick, compared with the effects of these factors on adult survival. It may also be influenced by the fact that razorbill chicks fledge when only partly grown and continue their growth and development at sea; in this species productivity only measures success to shortly before chicks leave the nest sites. Razorbill nests are also difficult to monitor for breeding success as they tend to be hidden in cracks in the cliff or under boulders.
Figure 1.13 Annual productivity rates of adult razorbills at the Isle of May (UKCEH data from online annual reports) in relation to ICES estimates of annual sandeel total stock biomass (tonnes) in SA4 between 2004 and 2019 (ICES 2022). Data for 2020-2021 are not yet published.
- There was also a linear relationship between population size of razorbills on the Isle of May and sandeel stock biomass ( Figure 1.14 Open ▸ ).
Figure 1.14 Population size (individuals on land) of adult razorbills at the Isle of May (UKCEH data from online annual reports) in relation to ICES estimates of annual sandeel total stock biomass (tonnes) in SA4 between 2004 and 2021 (ICES 2022).
Puffin
- Return rates of puffins also showed a relationship with sandeel abundance ( Figure 1.15 Open ▸ ). It is important to note that, as with breeding success, these relationships are non-linear. There can be large differences in sandeel abundance between moderate and high abundance over which range adult survival remains high; survival falls much faster when sandeel abundance falls below a critical threshold level. This means that gains depend on the starting point on the graph. Residuals for each plot are in ANNEX B.
Figure 1.15 Annual return rates of adult puffins at the Isle of May (UKCEH data from online annual reports) in relation to ICES estimates of annual sandeel total stock biomass (tonnes) in SA4 between 2004 and 2018 (ICES 2022). Data for 2019-2021 are not yet published.
- There was also a relationship between the productivity of puffins on the Isle of May and the sandeel stock in SA4 across the same time period ( Figure 1.16 Open ▸ ). This relationship was slightly less clear than that for survival. This was likely due to the greater influence of weather and predation events strongly affecting the survival of eggs or chick, compared with the effects of these factors on adult survival.
Figure 1.16 Annual productivity rates of adult puffins at the Isle of May (UKCEH data from online annual reports) in relation to ICES estimates of annual sandeel total stock biomass (tonnes) in SA4 between 2004 and 2019 (ICES 2022). Data for 2020-2021 are not yet published.
- Puffins nest in burrows, which makes large colonies, such as the Isle of May, challenging to count. The counts on the Isle of May only occur every five years. There were therefore too few data to describe a relationship between the numbers of breeding birds on the Isle of May and the sandeel stock biomass in SA4.
Evidence that reducing or removing fishing pressure results in an increase in sandeel abundance
- While it has been shown that seabird demography is positively affected by sandeel abundance, it is also important to demonstrate that reducing or removing fishing pressure can result in a positive effect on sandeel abundance.
- Longer-term monitoring data show that with low fishing mortality in SA4 from 2005 to 2015, biomass of sandeels in SA4 increased from <100,000 tonnes around 2005 to >500,000 tonnes in 2015, providing further empirical evidence for recovery when fishing pressure is greatly reduced.
- A comparison of spawning stock biomass (SSB) with fishing effort (total number of vessel days in a year) showed that higher fishing effort resulted in lower SSB in the following year ( Figure 1.17 Open ▸ ). This comparison was made based on the change in SSB, as fishing effort is almost exclusively during the spring prior to the appearance of Group 0 fish in the stock. The fishery avoids catch of Group 0 fish, due to their lower lipid content, thus comparisons of fishing effort with SSB are more meaningful than comparisons with TSB. This comparison excluded the change in stocks following years with zero (or near zero) fishing effort. ICES defines SSB as 2+ group sandeels, which assumes that one year old sandeels are immature. While almost all 2+ sandeels spawn, some one-year-old sandeels also spawn but the proportion of spawning one year old sandeels varies between years. Thus, the ICES definition of SSB provides a more stable definition for making comparisons of the effects of fishing effort between years.
Figure 1.17 Change in SSB compared with fishing effort (vessel days) in SA4 for non-zero fishing effort years.
- Monitoring of sandeel abundance at Shetland ended shortly after the sandeel fishery terminated. However, seabird breeding success has only very recently shown much improvement, suggesting that any recovery of sandeel stock at Shetland was very slow, and incomplete. That would be consistent with the idea that recovery of a heavily depleted forage fish stock can be inhibited by high levels of natural predation imposed on the reduced biomass (the “predator pit hypothesis”; Saraux et al. 2020). Seabirds, marine mammals and large predatory fish remain numerous at Shetland. High levels of natural mortality seem a likely consequence of forage fish stock depletion when large numbers of predators remain in the system. The stock in SA4 has not shown a similar lack of recovery with TSB showing positive increases since the introduction of the box and reduction in fishing pressure (see Section 1.4)
- Studies of sandeels on numerous small sandbanks off southern Norway indicate a tendency for fishing of sandeels to cause depletion on the fished sandbanks, with recovery of sandeel abundance occurring after fishery closure (ICES 2017). However, full recovery may take some time, as depleted populations depend on high larval survival and settlement onto the sandbank. This could reasonably be expected to occur in a few years after the closure of fishing. However, to provide adequate compensation for the predicted impacts full recovery is not required. The evidence from Cury et al. (2011) is that stocks above one third of their historic maximum biomass is sufficient to provide forage fish for seabird populations. For the SA4 sandeel stock, this one third value is about 300,000 to 400,000 tonnes. Any recovery above this would result in smaller gains as the TSB level increases.
- When the box off east Scotland was closed to sandeel fishing, research was carried out to monitor the response of sandeels in that area immediately after the fishery closure. Closure of the fishery was followed by an immediate increase in sandeel stock biomass (Greenstreet et al. 2010) and over time altered the age structure of the sandeel population. When the stock was heavily fished, very few sandeels lived beyond two years old, resulting in high variability in abundance from year to year depending on the highly variable level of production of young fish. When the fishery was closed, sandeels tended to live longer, with large cohorts remaining in the stock for up to six years (Peter Wright, pers. Comm.). The longer life expectancy of sandeels when not subject to fishing not only increases mean biomass of the stock, but also reduces variability in abundance driven by variable recruitment.
- No closures have been implemented in SA1r, but detailed retrospective modelling (Lindegren et al. 2018) provides strong evidence that a reduction, or closure, of sandeel fishing on that stock would result in a large increase in sandeel stock biomass. Lindegren et al. (2018) stated, “Our results show that fishing largely contributed to the abrupt stock decline during the late 1990s” and conclude that reducing F at that time would most likely have maintained the stock biomass above ecologically safe levels rather than causing serious decline. However, they caution that complete recovery from the current depleted state might be impossible because of impacts of climate change and impacts of increased populations of predatory fish, especially mackerel.
- In summary, several examples show that sandeel abundance can recover after the closure of sandeel fishing, although this may not occur immediately after closure, particularly in cases of extreme depletion, such as in SA7. A process of recovery after reduced fishing mortality is also seen in many other depleted fish stocks around the world, so is typical of fish stocks and not just sandeels (Murawski 2010). It is also worth making the point that the sandeel fishery is mostly carried out during spring, relatively early in the seabird breeding season, and so removes fish that might otherwise be available to the seabirds that same breeding season.
Discussion and Conclusions
- Strong evidence was found for correlations between sandeel TSB in SA4 and adult return rates (as a proxy for adult survival), productivity and population size for all species, except for razorbill. Razorbill showed strong correlations between adult return rate and population size, but not productivity. It was thought that the lack of a relationship between sandeel TSB in SA4 and razorbill productivity was most likely due to the difficulty of studying the breeding success of this species, due to it’s preferred nesting locations in hard to observe locations, such as cracks in rocks, under boulders, etc.
- Strong evidence that the reduction or removal of fishing pressure in sandeel stocks in SA4 was also shown. This study showed that there was a negative correlation between SSB and fishing effort (in the previous year), thus SSB would be higher if fishing effort was reduced. Published evidence also showed that reductions in fishing pressure results in larger sandeel TSB.
- In conclusion, reduction or removal of fishing pressure in SA4 would highly likely result in increases in sandeel TSB. This increase in sandeel TSB would therefore highly likely result in greater adult survival and productivity of kittiwake, guillemot, razorbill and puffin which would in turn result in larger population sizes for these species.
1.7. Evidence that SA4 is the appropriate spatial scale for assessment
1.7. Evidence that SA4 is the appropriate spatial scale for assessment
- The spatial scale of the response of seabirds to sandeels is key to both assessing the effects of reducing or removing fishing pressure on seabird demographics, but also in determining the appropriate spatial scale of fisheries management actions. Searle et al. (in press) compared the breeding success and diet of kittiwakes, guillemots, razorbills and puffins from the Isle of May with a range of sandeel stock and fisheries data. For all four species breeding success increased when sandeels formed a higher proportion of the diet. Guillemot, puffin and kittiwake breeding success was higher in years with high sandeel availability. The paper demonstrated that current fisheries management, through the application of the closed area (i.e. the sandeel “box”), has been only partially successful in protecting the foraging resources of breeding seabirds in eastern Scotland and north-east England. The paper concluded, based on the results of the analyses undertaken, that limited evidence for ecological net gain from closure of the sandeel fishery in the box in SA4 was demonstrated. While this is a reasonable inference to draw from the analyses undertaken, those analyses were mainly focused on the effects on diet and productivity and the effects of the application of the sandeel box as a fisheries management tool. The sandeel box appears to have had limited benefits to seabirds on the east coast of Scotland, most likely because it has not actually reduced the total harvest of sandeels from SA4, and because recovery of the sandeel stock after depletion in the 1990s took many years and has been further inhibited by high fishing effort in recent years in the open part of SA4.
- It is also apparent from analysis of kittiwake tracking data during the chick phase of the breeding season by Cleasby et al. (2018), that kittiwake colonies adjacent to the sandeel box forage across a much wider area than the box (Figure 1.18).
- To explore the responses of seabird demography to sandeel TSB in SA4, as the appropriate spatial scale for assessing the effects of sandeel abundance on seabird populations, data was sought from additional breeding colonies in SA4. The sandeel box in SA4 was a response to declines in seabird productivity following higher fishing mortality of the SA4 stock in the 1990s. If the sandeel box was effective a different demographic response to sandeel TSB in SA4 would be predicted between those seabird colonies foraging in SA4, both inside and outside the sandeel box. Data to explore these differences were very limited. Sandeel TSB data were only publicly available at the SA4 spatial scale and the only seabird demographic data available in the SA4 area at sites other than the Isle of May was productivity data from the SMP database. Consequently, the difference between productivity of colonies with more than five years of data within a fifteen year period where seabirds were likely to forage either inside the sandeel box or outside the sandeel box were compared.
- The availability of productivity data for seabird colonies within SA4 was reviewed. Suitable data were those where a site had a reasonable time series within the period from 2004 to 2021. It was only kittiwake where there were sufficient productivity data to provide a useful overview. These data were compiled across all sites within SA4 but separately for those colonies adjacent to the sandeel box and those outside the sandeel box. The total productivity was calculated by collating the field “Count” and “Fledged count” to provide the overall number of chicks per pair. For each species the SMP productivity plots used are summarised.
- Eight suitable productivity plots were found in the SMP database with suitable productivity data. Sample sizes varied from 10 to 18 years ( Table 1.1 Open ▸ ).
Table 1.1 Colonies with productivity plots in the SMP database with suitable data to compare with sandeel TSB between 2004 and 2021.
Data from the Isle of May for productivity values only are available from 2015 to 2019 from UKCEH, but these do not provide the number of pairs that productivity was based on so could not be collated with other data.
- The relationship between the combined productivity data from the productivity plots shown in Table 1.1 Open ▸ for sites inside and outside the sandeel box but within SA4 and the sandeel TSB in SA4 is shown in Figure 1.19 Open ▸ .
Figure 1.19 Relationship between kittiwake productivity of colonies on the east coast of SA4 inside and outside the sandeel box. See text for explanation of the sites included.
- The presence of a very similar relationship for colonies within SA4 that border the sandeel box and those within SA4 that do not border the closed box strongly suggests that the relationships derived from the Isle of May between demographic parameters and sandeel TSB in SA4 are sound and do not need to be assessed at a smaller spatial scale. It is important to note that productivity of kittiwakes (and other seabirds) will also be affected by other factors, particularly predation and weather. There is therefore some noise in the productivity data that is not controlled for in this analysis.
- Recent analyses by UKCEH have shown that the current management of the SA4 sandeel fishery through the use of the closed box has only been partially effective at maintaining the breeding success of seabirds that forage within the box (Searle et al. in press). This is in agreement with the analysis above, showing little difference in the change in productivity of kittiwakes to changes in sandeel TSB for colonies located adjacent to the box compared with outside the box.
- This is likely because the sandeel box has not reduced fishing effort on the sandeel population in SA4 but has displaced fishing to areas directly to the east of the box ( Figure 1.20 Open ▸ ). While this may not have affected sandeel stocks in the box itself, the analyses above shows that seabirds located adjacent to the box still have a strong relationship with the TSB of sandeel in the whole of SA4.
Figure 1.20 Sandeel fishing effort in the North Sea (from ICES 2022).
- It is apparent from the relatively crude metric of the mean of the maximum foraging range (Woodward et al. 2019) that it is likely that the species being assessed here do forage beyond the sandeel box, and the analyses by Cleasby et al. (2020) confirms from modelled tracking data that areas to the east of the box are also important to foraging seabirds.
- It is important to note that these foraging range metrics and analyses are based on only part of the breeding season (mostly the early chick phase). Evidence shows that foraging behaviour of seabird changes through the breeding season, with longer foraging trips occurring during both the incubation phase and later in the breeding season, both of which are not well captured by these foraging range metrics (see Section 1.5). In addition, theory suggests (Ashmole’s halo hypothesis) that as the season progresses prey stocks are depleted by foraging seabirds and so individuals have to forage further from the colony. Thus, when in the breeding season tracking data was collected will not necessarily be representative of foraging locations later in the season. This means it is more likely that areas beyond the sandeel box, and the sand banks therein, become less important to seabirds as the breeding season progresses. This effect has been demonstrated in several tropical seabirds, and in Brunnich’s guillemot Uria lomvia (Elliott et al. 2009)
- While individual sandeels are sedentary (Wright et al. 2019, Jensen et al. 2010), seabirds are highly mobile and able to forage overall large areas of sea. The relative spatial distribution of sandeel potential habitat confidence, SPAs with connectivity to the Proposed Development and the sandeel box are shown for each species in Figure 1.21 Open ▸ to Figure 1.24 Open ▸ .
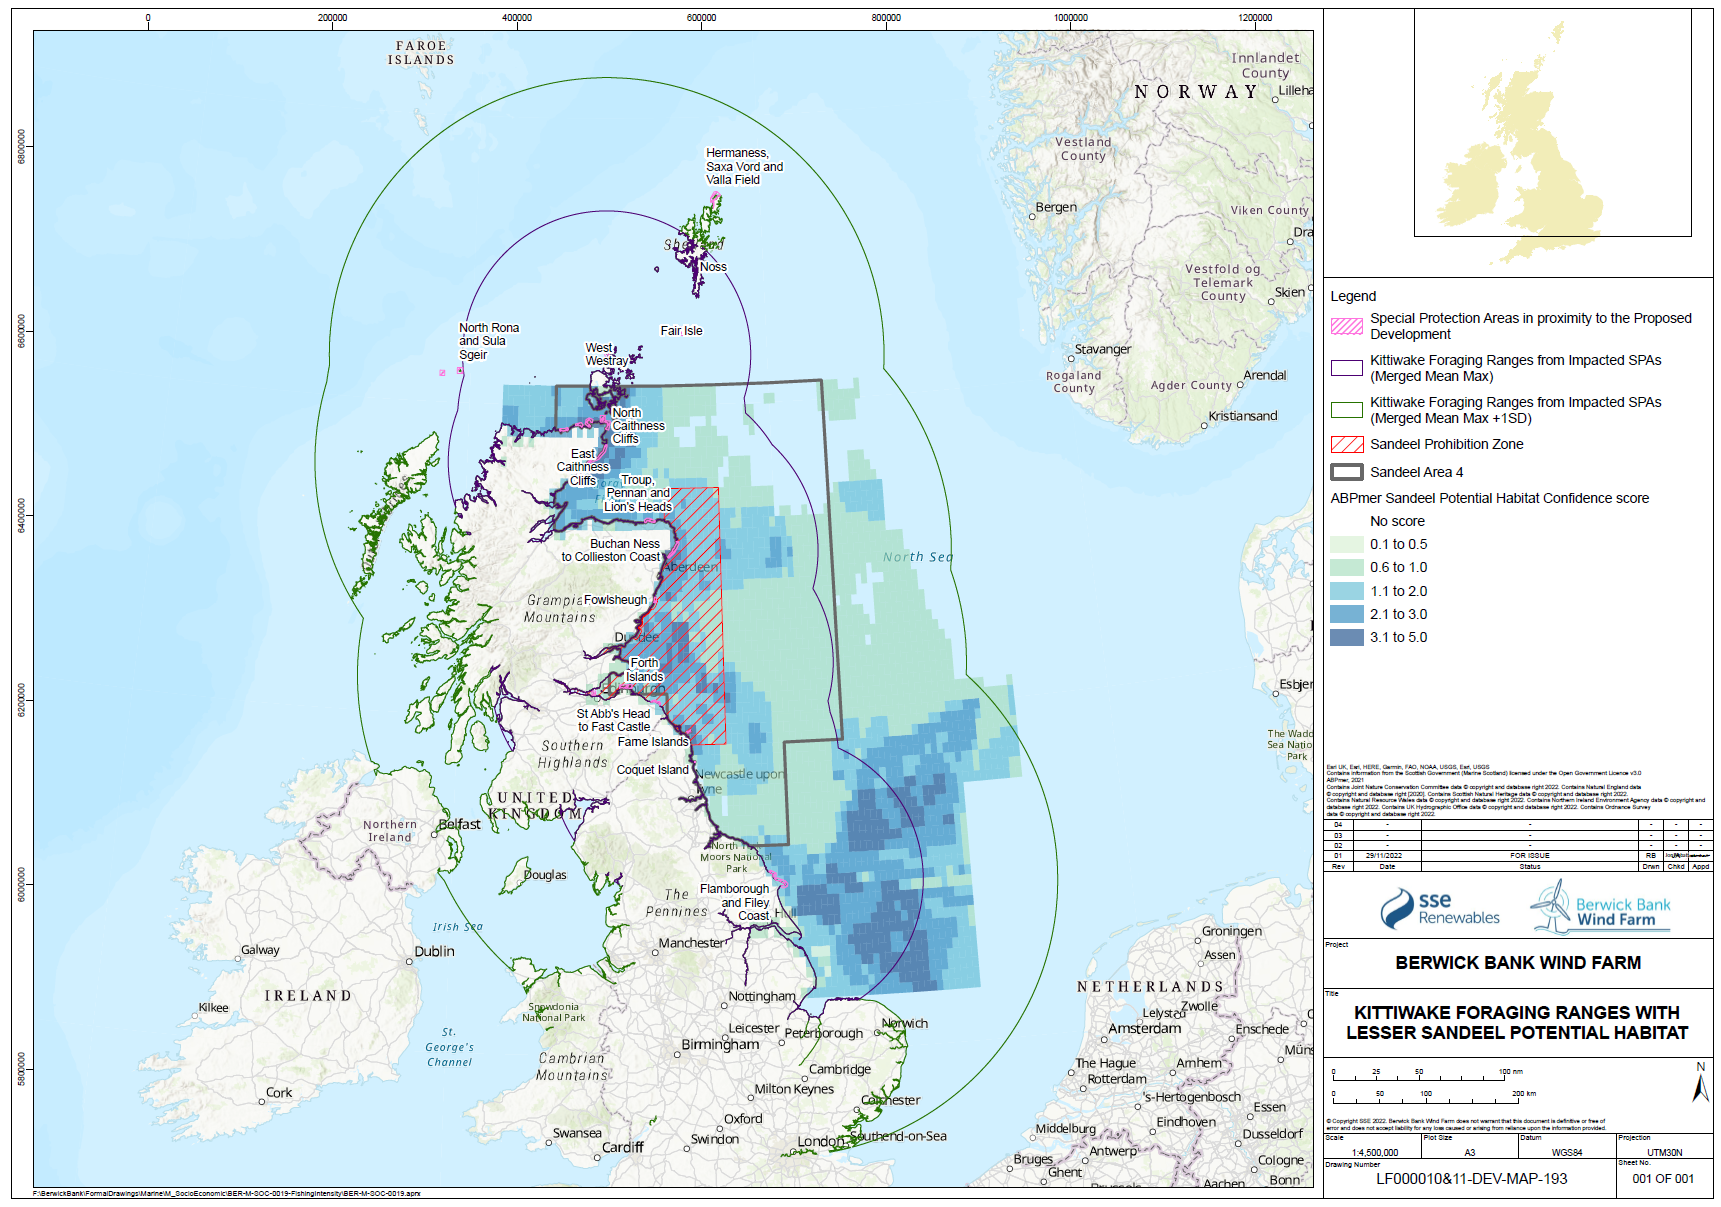
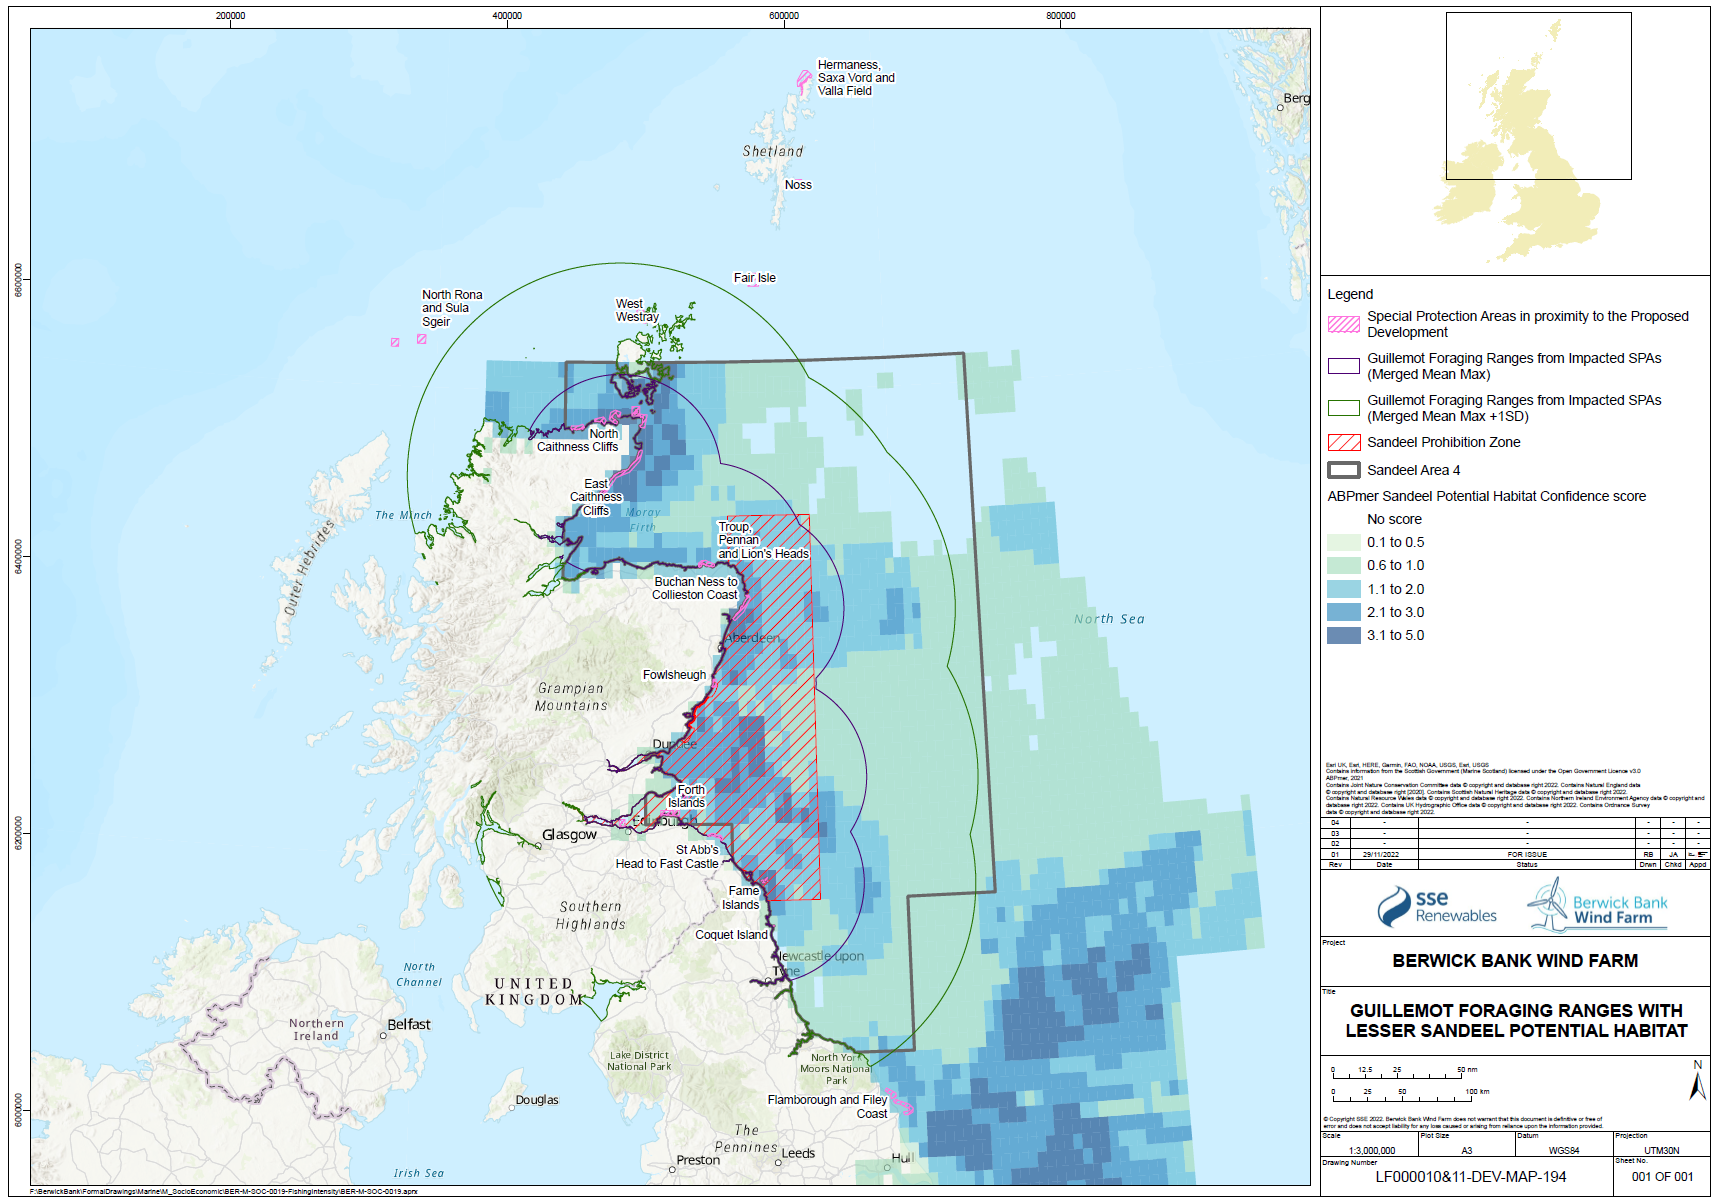
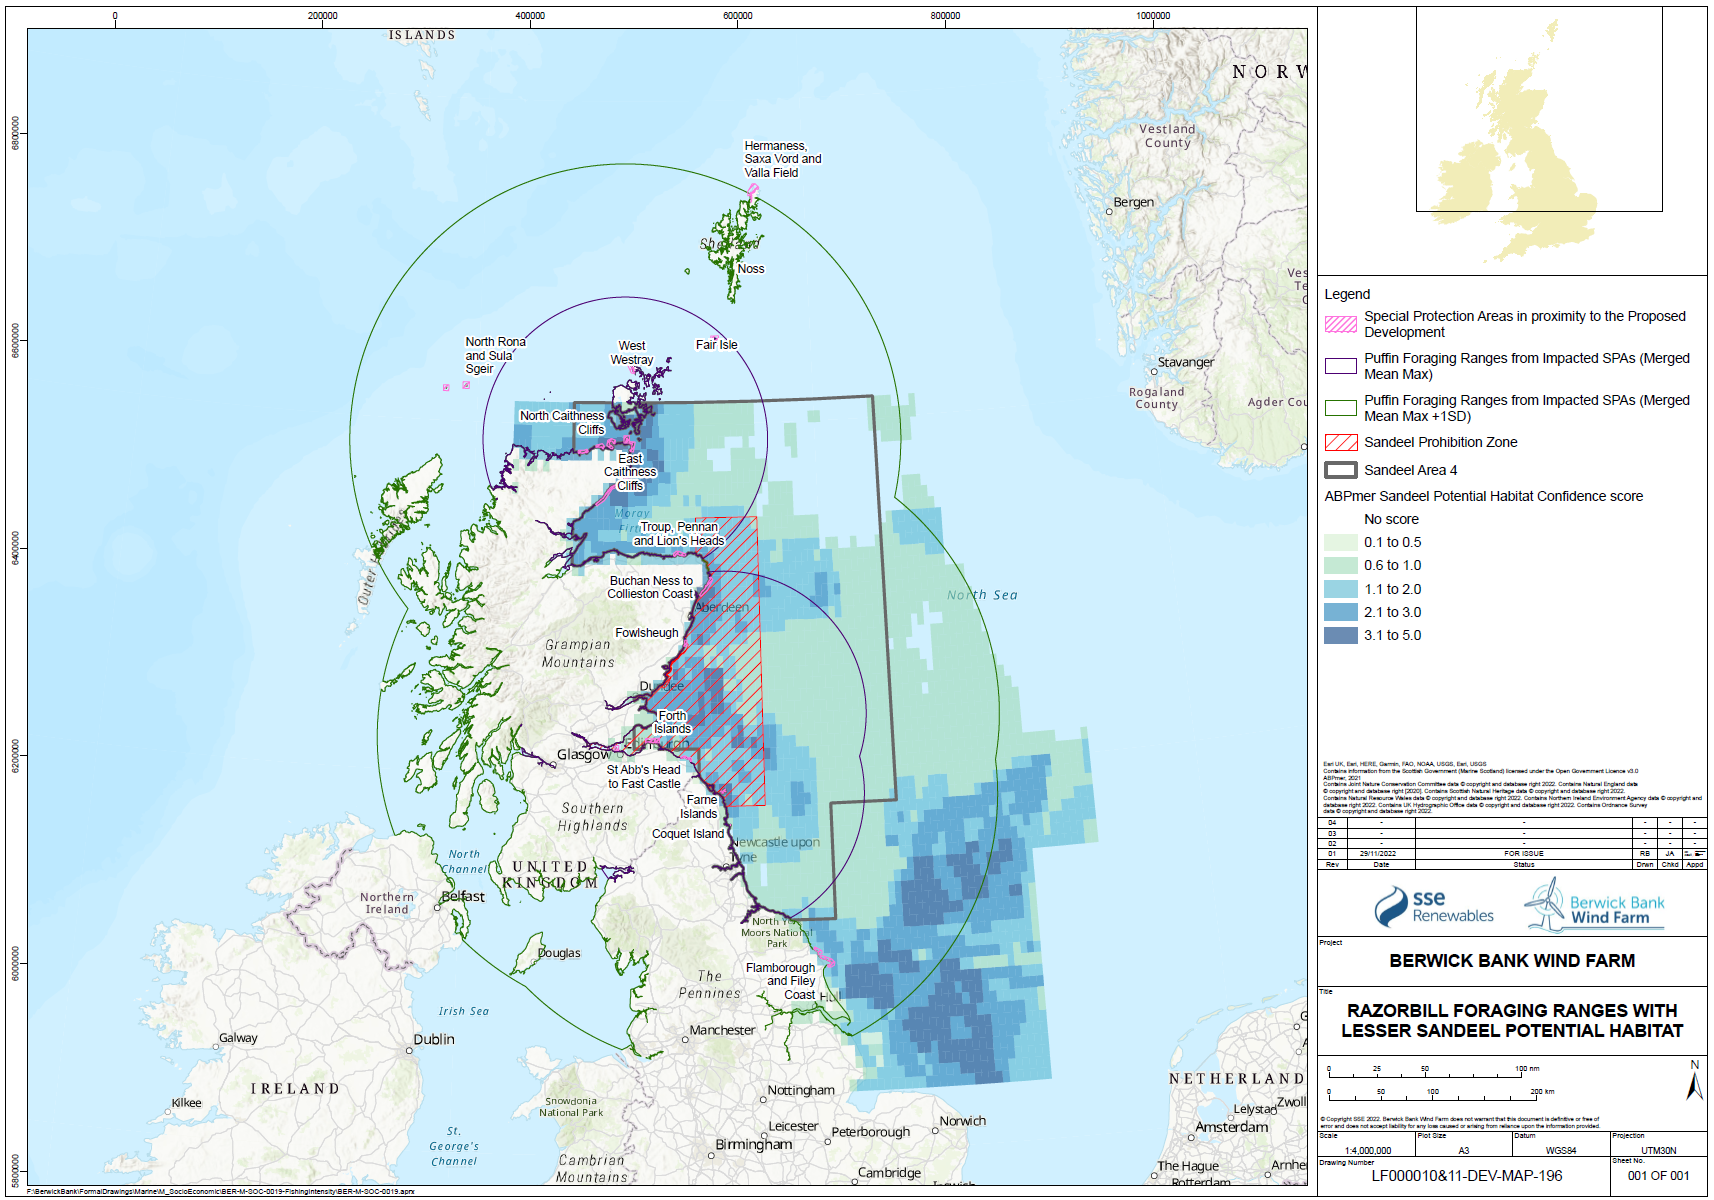
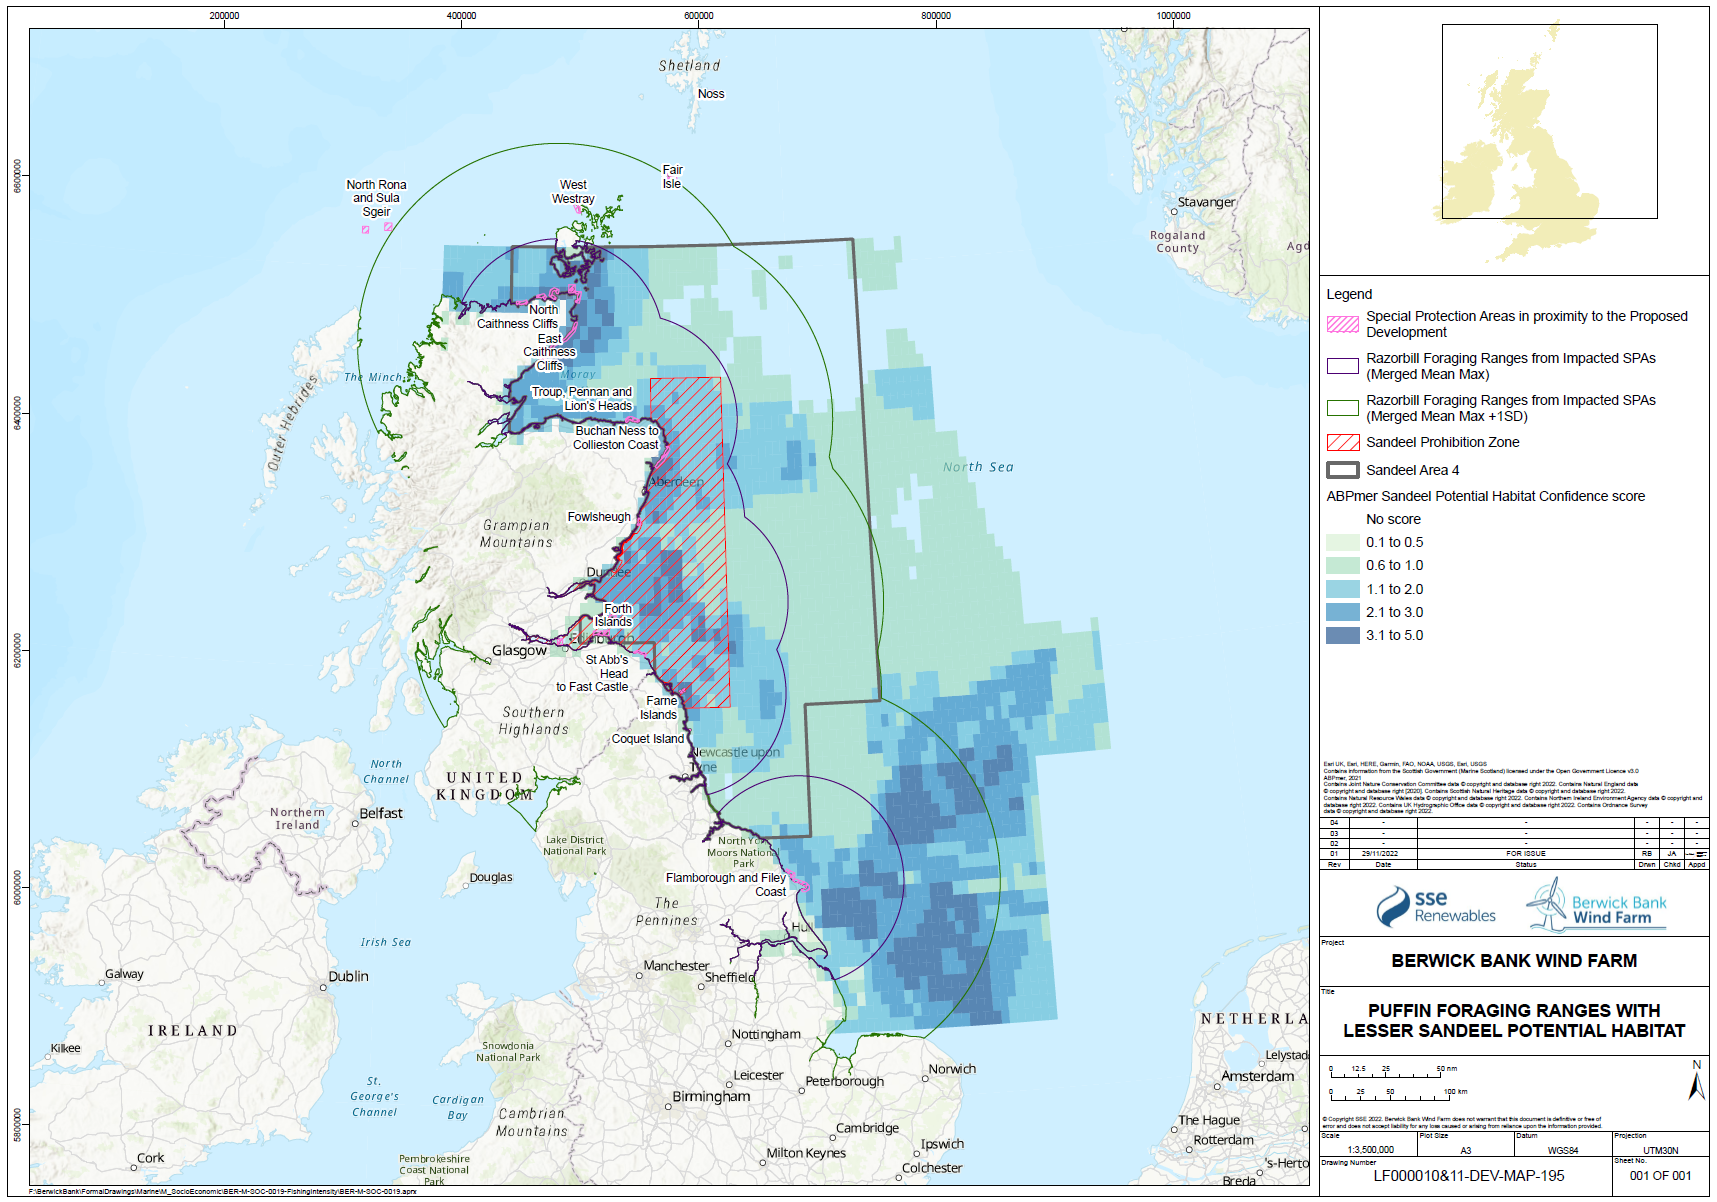
- The sandeels in the habitat outside the closed box may be particularly important to seabirds in the period immediately post-breeding as they disperse from their breeding colonies. This may be a critical energetic bottleneck for some species, particularly auks where parental care continues following fledging, and this can overlap with the moult period. While auks may have reduced energetics costs to diving after moulting their flight feathers, they are also provisioning chicks while growing new feathers. Seabirds will also be trying to regain body mass lost through the breeding season and it is known that body mass at the end of the breeding season is an important factor in predicting over-winter survival rates.
- There is a high degree of inter annual variability in the location and level of recruitment into the sandeel population as demonstrated by the different location and intensity of sandeel fishing across SA4 and the wider North Sea. Given that it is difficult to predict the location and quantity of sandeels that are available it is logical to manage fishing pressure across the whole of SA4 to provide the best opportunity for seabirds to respond to the natural variability in the stock levels. CEH has demonstrated that current sandeel box is not large enough to deliver the benefits that might be expected.
- Managing fishing pressure for the whole of SA4 will lead to a change in the age structure of the SA4 population with a greater number of sandeels reaching older age classes. This will lead to lower variability of recruitment each year which is likely to lead to higher levels of productivity via lower breeding abandonment in poor prey years.
Climate change impacts on sandeels in the North Sea
- Climate change impacts on sandeels in the North Sea relate mainly to climate warming effects on their planktonic food and climate warming effects on sandeels themselves. Causes of ocean warming are now well understood, as are the general effects of ocean warming on ecosystems, plankton and marine fish, and the consequences of these effects for biodiversity, ecosystem stability, wildlife, and ecosystem services to humans (Laffoley and Baxter 2016). Warming ocean and sea temperatures have already caused significant poleward movements of the edges of zooplankton geographical range. Polewards shifts of large copepods that have a strategy of storing lipid for overwinter survival have been especially pronounced, to be replaced by smaller, faster growing copepods that do not store lipid because they are adapted to warmer climates (Edwards 2016). Since sandeels feed on large lipid-rich copepods (Arnott and Ruxton 2002, van Deurs et al. 2009, 2013, 2015, ICES 2017) there is an ecological linkage that predicts an impact of climate warming on food availability to sandeels through bottom-up food web changes (Cheung and Pauly 2016).
- Climate warming may also shift the seasonal timing of processes in a way that could reduce the synchrony between predator and prey, and so reduce the efficiency of energy transfer up marine food chains (Edwards 2016). The spring bloom of phytoplankton in temperate/sub-Arctic regions is controlled by light intensity and photoperiod, so has remained relatively stable in phenology over recent decades despite warming (Edwards 2016). However, some zooplankton and some fish larvae have moved significantly earlier in their seasonal cycles, which can reduce trophic transfer efficiency (Cheung and Pauly 2016, Edwards 2016).
Research on relationships between climate, zooplankton and sandeels
- Arnott and Ruxton (2002) showed that warmer sea temperatures correlated with poorer than average recruitment of sandeels in the southern North Sea. Arnott and Ruxton (2002) also found a positive association between sandeel recruitment and the abundance of Calanus finmarchicus copepod stages V and VI around the time of larval hatching and inferred that the availability of this prey species is important for survival of young sandeels. In the southern North Sea higher sandeel spawning stock biomass in SA1r was significantly associated with lower temperatures and with lower sandeel fishing mortality, the latter effect being statistically the stronger (Carroll et al. 2017). These effects of climate warming and fishing mortality driving sandeel stock biomass are not limited to the North Sea. The same effects have been identified for sandeel stocks elsewhere. For example, the biomass of sandeel stocks off the south coast of Japan is affected by climate warming but especially by the level of fishing mortality (Funakoshi 1998).
- A study by Henriksen et al. (2021a) concluded that during the first year of life in the North Sea, sandeel size has a large influence on survival, indicating a positive relationship between growth rate and survival. There was little or no effect of sea temperature on that relationship. However, Henriksen et al. (2021a) found that during the second year of life, autumn seabed temperature was negatively correlated with sandeel abundance, suggesting higher mortality in warmer years. Whereas winter temperatures tend to be similar between the northern and southern parts of the North Sea, in summer and autumn the temperatures are considerably higher in the southern North Sea. Southern parts of the North Sea were the areas showing the strongest response of sandeels to temperature (Henriksen et al. 2021a), further supporting the suggestion of Arnott and Ruxton (2002) that southern populations of sandeels may be more at risk from climate warming. However, there is a contradiction between these two studies, in that Henriksen et al. (2021a) suggest that temperature effects are on 1-year old sandeels but not on 0-group sandeels and are mediated by autumn temperatures, whereas Arnott and Ruxton (2002) reported effects on 0-group sandeels in relation to late-winter and spring temperatures.
- Survival of larval sandeels in the North Sea is thought to be strongly influenced by abundance of the large copepod Calanus finmarchicus, raising the possibility that climate-generated shifts in the Calanus species composition and timing of the spring bloom of zooplankton abundance may lead to a mismatch between food availability and the early life history of sandeels (van Deurs et al. 2009). Models of foraging by sandeels predict that changing from a situation where large Calanus finmarchicus copepods dominate the zooplankton to a situation where only relatively small and less energy-rich copepods are available (the trend predicted as a result of climate warming) roughly halves the energy intake of sandeels even if prey biomass concentration remained constant, mainly because of visual constraint on foraging rate of sandeels but also due to handling time limitation and prey energy content (van Deurs et al. 2015). Climate warming effects on zooplankton community composition, which are occurring in the North Sea (Bedford et al. 2020), therefore have profound implications for sandeels. However, Olin et al. (2022) questioned whether sandeels are dependent on these large energy-rich copepods or whether they may be able to cope well on a prey field dominated by smaller copepods. That question is in direct contradiction to the conclusion of van Deurs et al. (2009) that Calanus finmarchicus abundance explains around 65% of the inter-annual variation in sandeel recruitment. It is also contrary to evidence from Arnott and Ruxton (2002) and from sandeel stomach content analysis (van Deurs et al. 2013). ICES (2017) also concluded that Calanus finmarchicus abundance strongly influenced growth and recruitment of sandeels in the SA1r region.
- Studying sandeels in the north-west North Sea from 2000 to 2018, MacDonald et al. (2019) found that low sandeel abundance correlated with low growth rate. Growth performance indices were correlated with zooplankton and phytoplankton biomass but were not influenced by variations in sea temperature. They concluded that sandeel abundance in that region was affected by food availability but not by sea temperature.
- Studies of sandeel egg development at different temperatures showed important temperature effects on egg development rate but indicated that these effects are only minor contributors to the observed variations in hatch dates among years (Regnier et al. 2018). Sandeels remain buried in seabed sandy sediment from late summer through winter. In spring, they emerge to feed on zooplankton. The overwintering strategy of sandeels involves a trade-off between energy gain and survival probability (van Deurs et al. 2010). This strategy will be influenced by climate warming effects on phenology and zooplankton abundance and species composition. Since variation in copepod timing at a Scottish coastal monitoring site was mainly influenced by February temperature whereas sandeel phenology was more closely related to rate of seasonal temperature decline in autumn and winter (Regnier et al. 2019) there is some scope for effects of increasing sea temperatures to result in an increased risk of mismatch between sandeels and they prey (Regnier et al. 2017, 2019). However, modelling this relationship indicated that individual fitness “is only marginally reduced in individuals that fail to optimize the foraging window in relation to the level of mortality and prey availability experienced during the zooplankton spring bloom” (van Deurs et al. 2010).
- Using commercial catch data (catch per unit effort) to describe sandeel emergence, Henriksen et al. (2021b) investigated the timing of sandeel emergence into the water column in spring in relation to sea temperature. Variation in emergence behaviour among years was correlated with variation in sea bottom temperature. Warmer years were characterised by earlier emergence by sandeels. However, although significant warming was evident in the North Sea over the last three decades, no net shift in the timing of emergence was detected over that 30-year period, suggesting that this effect of climate warming is rather small.
- The sandeel is an example of a capital breeder, as its gonad development depends entirely on stored energy reserves while the fish remains buried in sandy sediments of the seabed. Laboratory studies of sandeels kept at different temperatures showed that loss of mass was greater in the higher temperature treatment, consistent with fish at higher temperature having higher metabolic costs (Wright et al. 2017). However, somatic energy loss did not differ between temperatures, the net change in mass being related to lower relative gonad size in the fish at higher temperature. The study concluded that warming sea temperatures will lead to a reduced reproductive investment by adult sandeels but will not impact their overwinter survival.
- In inner Danish waters the seabed can become oxygen deficient during warmer summer months (hypoxia). This hypoxia impacts on sandeels by making sediments unsuitable for sandeel survival (Behrens et al. 2009). All else being equal, increased sea temperature will tend to increase risk of hypoxia, so there is a risk of loss of suitable sandeel habitat as a result of increased hypoxia of sediments in the North Sea. However, very few areas of UK North Sea waters are likely to be at risk of sediment hypoxia (this is most likely where water flow is low, and inputs of organic matter are high). The areas favoured by sandeels are areas of coarse sand rather than areas of mud and it is unlikely that hypoxia will affect such sandy sediments (where the sand grain size is maintained by moderate water flows with little input of fine sediment or organic matter).
- It is acknowledged that there are somewhat contradictory results in the published literature regarding sandeel relationships with zooplankton and with climate warming. However, the majority of the literature suggests a dependence of sandeel growth and survival on availability of large Calanus finmarchicus copepods, and some tendency for sandeel recruitment or survival to be reduced in warmer sea temperatures in the southern part of the North Sea, but apparently to be much less influenced by sea temperature in the northern North Sea. This raises specific questions about how the southern and northern parts of the North Sea differ and how that influences sandeel demography and abundance.
Differences between southern and northern North Sea ecosystems
- Analysis of 60 years of continuous plankton recorder data shows that there is considerable spatial variation in the zooplankton prey field available to sandeels in different regions (Olin et al. 2022). The authors of this study caution against inferring ecological consequences based only on large-scale trends in key taxa or mean community traits. However, they found generally higher abundance of large Calanus copepods further north, but also found pronounced decline in the abundance of small copepods in the western North Sea over this survey period.
- Between 1901 and 2020, sea surface temperature increased more in the southern North Sea than in the northern North Sea (NOAA 2021). This is likely to relate to the inflow of Atlantic Ocean water into the northern North Sea (van der Molen and Pätsch 2022) buffering impacts of warming atmospheric conditions that have a stronger influence on the shallower water in the southern North Sea. The southern North Sea has warmed twice as fast as the average for the world’s oceans, consistent with the influence of continental warming and the relatively shallow nature of the southern North Sea[2]. The cooling effect of Atlantic water flowing into the North Sea also results in the UK coastal waters being cooler in summer and autumn than the continental coastal waters, especially at the same latitude in the northern North Sea. The northern and southern North Sea also differ in summer stratification as a result of differences in water depth. In the northern North Sea, the water is seasonally stratified each year, whereas in the southern North Sea stratification only occurs in years with exceptional summer heat, a situation which is occurring more frequently with climate warming (Chen et al. 2022). Whereas most nutrient input into the northern North Sea comes from inflowing Atlantic water (van der Molen and Pätsch 2022), the southern North Sea is strongly influenced by nutrient inputs from major European rivers (Desmit et al. 2019). The nutrient input from rivers had been elevated for many decades by agricultural and industrial inputs (nutrient pollution) but these inputs have been reducing since the mid-1980s due to more effective regulation (Desmit et al. 2019). The de-eutrophication process in the southern North Sea correlates with a slight reduction in phytoplankton production (as indicated by chlorophyll measurements) since the late 1980s (Desmit et al. 2019). This could have bottom-up effects on zooplankton and therefore on sandeels in the southern North Sea but there has been no equivalent de-eutrophication in the northern North Sea because nutrient loads there have never been significantly influenced by river-borne pollution (van der Molen and Pätsch 2022).
- Between 1983 and 1996, sandeel recruitment (after correcting for effects of the biomass of each age class) was significantly higher in years with cooler winter and spring sea temperatures in the southwestern North Sea (Arnott and Ruxton 2002), the area labelled ‘region 1’ by Arnott and Ruxton being approximately congruent with what is now defined as the SA1r sandeel stock distribution. Arnott and Ruxton (2002) concluded that climate warming may result in the northward shift of that southern limit of sandeel stock distribution in the North Sea because recruitment could become compromised by rising temperatures in the southern North Sea. However, in the northern North Sea (specifically an area they labelled ‘region 2’) they found very little evidence of any relationship between sandeel recruitment and sea temperature. In their region 2, there was a slight trend towards higher recruitment in cooler years, but almost all monthly correlations failed to reach statistical significance. Arnott and Ruxton (2002) suggest that in relation to sandeel recruitment “whereas temperature may be a more important proximate cause in region 1, more indirect routes may predominate in region 2”.
- Although abundance of large copepods declined in the southern and eastern North Sea, their abundance shows no significant long-term trend in waters off east Scotland (broadly corresponding to SA4) and in that region there is no significant correlation between sea temperature and abundance of large copepods (Bedford et al. 2020). If sandeel recruitment is affected by large copepod abundance, then this lack of any relationship with sea temperature off east Scotland may contribute to the general observation that sandeels in SA4 appear less sensitive to sea temperature change than in the southern North Sea. This lack of a sea temperature effect on Calanus finmarchicus in SA4 can be explained by the observation that interannual variability of Calanus finmarchicus abundance in the north-western North Sea is mainly determined by the inflow of Calanus finmarchicus in North Atlantic water entering the northern North Sea (Gao et al. 2021). Calanus finmarchicus is considered not to be self-sustaining in the North Sea but is highly dependent on inflow from the Faroe-Shetland Channel bringing large quantities of Calanus finmarchicus into the North Sea (Gao et al. 2021). This further emphasises the independence of Calanus finmarchicus abundance in the northern North Sea from effects of increased warming of North Sea waters by climate change.
- While much emphasis has been put on the ‘bottom-up’ limitation of sandeel stock biomass through climate-mediated changes in zooplankton species composition and biomass, and the ‘top-down’ influence of sandeel fishery mortality, it should also be recognised that other ‘top-down’ influences may be present (Frederiksen et al. 2007). These include impacts of natural mortality (especially predation by adult herring, mackerel, whiting and other predatory fish). Frederiksen et al. (2007) indicated that top-down predation by predatory fish is likely to be more important in the northern North Sea than in the southern North Sea, such that the relative importance of bottom-up and top-down control on sandeels may differ between regions. This regional difference in the strength of natural mortality is also recognised, and incorporated into sandeel stock assessments, by ICES (2017).
- In the southern North Sea SA1r area, there is a correlation between the few years of exceptionally high recruitment of sandeels and an unusual pattern of net direction of water transport in the area (Henriksen et al. 2018). This pattern may be specific to this area but suggests that sandeel recruitment may be influenced by variation in hydrographic pattern. That water flow pattern may in turn be influenced by climate change.
- It is evident there are huge differences in the ecology of the southern and northern parts of the North Sea. These differences are driven in part by hydrographic influences, especially the important inflow of North Atlantic water into the northern North Sea and the flow of major European rivers into the southern North Sea, and in part by sea depth differences affecting stratification and the coupling between atmospheric warming and sea temperature change. This affects zooplankton community composition, seasonal change in sea temperature, and the rate of sea temperature increase caused by climate warming. Sandeel stocks in the southern and in the northern North Sea are therefore exposed to very different environmental pressures. Whereas southern North Sea sandeels appear subject to strong sea temperature effects and appear vulnerable to climate warming, the ecological patterns in the northern North Sea indicate that sandeels in the northern North Sea are probably more strongly influenced by variability in natural mortality pressures and are less vulnerable to climate warming effects because of the buffering influence of North Atlantic water inflow.
- Sandeels may not recover to levels seen in the 1990s, but reduction of fishing pressure is the most important single influence, and valuable to create resilience.
- Lindegren et al. (2017) modelled the sandeel stock dynamics in SA1r and concluded that although the main driver of stock biomass was fishing mortality, the abundance was also influenced by availability of preferred prey (Calanus finmarchicus and Temora longicornis) and by climate. Lindegren et al. concluded that the reduction of fishing mortality would lead to a large increase in sandeel stock biomass but that “a complete recovery of the stock to the highly productive levels of the early 1980s would only be possible through changes in the surrounding ecosystem, involving lower temperatures and improved feeding conditions”. The authors therefore stressed “the need for ecosystem-based management accounting for multiple internal and external factors occurring within the broader context of the ecosystem in which forage fish species, such as sandeel, play an important and integral part”.
- Ecopath/Ecosim modelling also indicated an influence of climate warming on the recovery of sandeel stocks if fishing mortality was reduced (Natural England unpublished report). However, this modelling indicated that despite climate change effects, reducing fishing mortality on sandeels would lead to a large increase in sandeel abundance, and therefore a large increase in seabird abundance.
- In SA4 the effects of climate warming will be less than in the southern part of the North Sea (Henriksen et al. 2021, NOAA 2021), but the principle that complete recovery is improbable because of climate-warming impacts is still likely to apply to some extent. We can conclude that sandeel stock biomass in ICES SA4 will probably not recover to the historical maximum levels present before sandeel fishing began in the region, but that reducing fishing pressure on sandeels in SA4 will be the single most effective means of allowing sandeel stock biomass to increase from the present depleted levels to a higher abundance limited by the availability of zooplankton prey and temperature constraints as now influenced by climate warming.
- There is a consensus that warming of the southern North Sea makes that area less suitable for sandeels, both by reducing the abundance of their preferred prey and by increasing metabolic rates of fish at a time when they depend on stored lipid for survival. However, warming of the southern North Sea makes that environment suitable for other forage fish that prefer warmer waters and their associated plankton communities. Both anchovy (Engraulis encrasicolus) and pilchard (Sardina pilchardus) have increased in abundance in the North Sea in recent decades (Petitgas et al. 2012, Raab 2013, Heessen et al. 2015). Those two species are the most important forage fish for seabirds in southern Europe (Gaspar et al. 2022), which include seabird species that are abundant in the North Sea, so may play an increasing role as an alternative food for seabirds in the North Sea in future.
- it is important to emphasise the consistent conclusion reached by two entirely different modelling approaches; both Natural England’s Ecopath with Ecosim model and the Lindegren et al. (2017) stock assessment hindcast model which both predict that reducing fishing mortality on sandeels would lead to a large recovery in sandeel stock biomass from the present levels that are depleted by fishing. Reduced fishing pressure on sandeels can also be expected to make the population more resilient to impacts of climate warming (Cheung and Pauly 2016). In addition, warming temperatures may allow anchovy and pilchard to become increasingly abundant in the southern North Sea, providing an alternative forage fish food supply for seabirds.
How much recovery of sandeel stock biomass is required?
Depletion of stocks of cod, whiting and haddock during the 20th century, followed by severe depletion of herring and mackerel stocks since the 1960s, will all have influenced sandeel stock biomass, even before sandeel fisheries grew to a scale that was likely to reduce sandeel biomass from the late-1970s onwards. It is important to recognise that it is not necessary for sandeel stock biomass to recover back to the abundance that would have been present in the absence of imposed fishing mortality before climate warming had any effect in order to benefit dependent seabirds. The research presented by Cury et al. (2011) shows that seabird demographic responses to prey abundance are sigmoidal; prey abundance below a critical threshold leads to failure. When prey abundance is above the critical threshold the exact abundance becomes relatively unimportant. That threshold was consistent across 14 seabird species in seven distinct global ecosystems (which included sandeel stocks supporting terns, kittiwakes and auks) and approximated to one-third of the maximum prey biomass observed in long-term studies. Increasing prey abundance from slightly above the one-third threshold to the highest observed abundance has very little further gain to seabird demography. The key influence is to get prey biomass above the one-third threshold and to maintain it above that threshold. There is no need to increase prey biomass to the historical maximum. Therefore, if climate warming reduces the environmental carrying capacity for sandeels, it would only represent a significant constraint if the impact of climate warming was to limit sandeel stock biomass below the ‘one-third for the birds’ threshold biomass identified by Cury et al. (2011). Available evidence based on predicted warming over the coming decades suggests that such a strong effect of climate warming on sandeel carrying capacity of the ecosystem is unlikely even in the southern North Sea where climate warming effects are greatest.
Discussion and Conclusions
- The presence of published evidence that sandeel abundance strongly affected breeding success and abundance across a wide range of breeding seabird species in Shetland led to analyses to examine if similar relationships occurred for kittiwake, guillemot, razorbill and puffin foraging in SA4.
- Strong relationships were found between sandeel abundance and seabird abundance, productivity and return rate (a proxy for adult survival) for all the species assessed, with the exception of razorbill, where there was no relationship with productivity (likely due to the greater influence of weather and predation events negatively affecting the survival of eggs or chick, compared with the effects of these factors on adult survival).
- There was also strong evidence of recovery of sandeel stocks in the North Sea following closure of the fishery, which includes evidence from the sandeel box in SA4. In some case recovery may be slow. However, recovery to previous levels at, or close to ecological capacity is not needed to offset the potential impacts of the Proposed Development. Every modelled recovery scenario, covering a wide range of possible levels of Sandeel TSB, demonstrates that any recovery in the sandeel TSB generates a large compensation surplus.
- Various elements combine to strongly suggest that the management of fisheries at the SA4 scale is likely to be the most effect scale for compensation. It is apparent that the sandeel box will protect only some of the sandeel stocks used by breeding seabirds. Foraging range information, based on tracking data from a relatively limited period of the annual cycle, shows important areas of sandeel habitat outside the box. New analyses of kittiwake productivity from colonies likely to be foraging inside the box and outside the box, but still within SA4, showed no important difference in the relationship between productivity and TSB in SA4. Finally, the presence of strong relationships between each of adult population size, return rates and productivity and TSB in SA4 shows that the population is responding to changes at this spatial scale. It seems likely, therefore, that at least this scale is important to seabirds breeding on the east coast of Scotland. This may be because of the importance of areas beyond typical foraging range in poor sandeel years and in the periods of the annual cycle outside the breeding season.
- The current management of sandeel stocks in SA4 does not account for the presence of the box. So sandeel TAC is based on the TSB in all of SA4, not just the stock outside the box. Given the sedentary nature of individual sandeels, this suggests that impacts on sandeel stocks outside the box could be particularly severe. These areas may be important to seabirds during periods of the annual cycle not assessed through tracking during the early chick phase.
- Thus, management of sandeel fisheries to reduce or remove fishing pressure for the whole of SA4 is very likely the most effective measure to compensate for predicted impacts.
1.8. Likely gains to seabirds from sandeel fisheries change
1.8. Likely gains to seabirds from sandeel fisheries change
- The context-dependent effect of sandeel abundance on seabird demography, together with uncertainty about the time-course and extent of recovery of sandeel biomass, and uncertainty about gains in terms of seabird survival rates (which can often drive population trend more strongly than breeding success in long-lived birds such as seabirds) makes predicting the gains to be obtained from reducing or removing sandeel fishing pressure complex, and relatively uncertain at a quantitative level. The evidence for qualitative gain is strong.
- The presence of relationships between changes in sandeel abundance and seabird demographics would be predicted to result in changes to seabird populations sizes. Most seabirds have demographic processes characterised by relatively high annual adult survival and relatively low annual productivity. So positive effects of sandeel abundance on annual adult survival should result in stronger population size change than effects on annual productivity. In addition, direct benefits of sandeel abundance on adult survival has immediate positive effects on protected seabird populations, as it results in more adult birds in the population, than positive effects on productivity, as it takes several years for the fledged chicks that survive to adulthood to be available to recruit into the population. Both the number of additional birds per annum and the number of chicks that survive to adulthood can be estimated from a predicted change in adult survival or in productivity. These parameters can also be used in Leslie matrix population models to project the change in population size or growth rate.
- In SA7r there is no sandeel fishery. If that remains the situation, some further recovery of sandeel stock at Shetland may be anticipated over coming years. No options for compensation by restricting sandeel fishing are likely to be available in SA7r.
- In SA4, the sandeel stock was heavily fished in 1993 to 1999, and in 2003 (ICES 2022). Total stock biomass fell from peaks of 772,000 tonnes in 1995 and 780,000 tonnes in 1997 to 33,000 tonnes in 2008 (ICES 2022). The sandeel box has somewhat limited fishing impact on this stock since 2000 and the stock biomass has increased from a low of 33,000 tonnes in 2008 to 480,000 tonnes in 2020 (ICES 2022). The Cury et al (2011) “one-third for the birds” threshold for this stock is approximately 300,000 tonnes. The stock was below that threshold from 2002 to 2009 but has been slightly above the Cury et al. (2011) threshold since 2015 and as a consequence good breeding success of kittiwakes would be expected now. Consistent with that, Isle of May kittiwake monitoring reported 1.07 chicks per pair in 2015, 0.78 in 2016 and 0.94 in 2017. Breeding success of kittiwakes can be 1.3 to 1.4 chicks per pair in ideal conditions, so there is some scope for improvement even now. However, catches taken from SA4 have increased recently ( Figure 1.25 Open ▸ ), and present management does not prevent stock depletion below the Cury et al. (2011) threshold from taking place if the fishing effort increases in future.
Figure 1.25 Sandeel TSB compared with catches in SA4 over time (data from ICES 2022).
- For immature birds, there is no evidence as to the relationship between survival rate and sandeel stock biomass, but theory would suggest that effects would be greater for immature birds than for adults because they are less experienced and have higher mortality. Improving food resources should therefore have even stronger effects on immature survival than seen for adult survival for those immature birds that are in the SA4 area.
- A series of plausible scenarios were created to describe the potential effects of sandeel fisheries compensation on adult survival rates for each species. However, a precautionary scenario was developed that assumed no influence on survival of immatures or on age of first breeding.
- With a Cury threshold of approximately 300,000 tonnes, five potential scenarios were considered that span the likely range of sandeel TSB from historic data ( Figure 1.26 Open ▸ ). Increases in sandeel stock biomass from below 300,000 tonnes were considered useful as there have been TSB values of this scale during the population recovery and the non-linear relationships between TSB and species adult survival and productivity showed the largest change in demographic values across these TSB values. Changes from 100,000 to 200,000 tonnes and 200,000 tonnes to 300,000 tonnes were therefore estimated. Both the historic TSB values from the 1990’s and a few of the more recent TSB values since stocks began to recover have been between 300,000 tonnes and 800,000 tonnes. So, in addition, increases in stock biomass from 300,000 tonnes to 400,000, 600,000 and 800,000 tonnes provided information on plausible future sandeel stock biomass levels being maintained above the Cury threshold but below the historic maximum stock biomass.
Figure 1.26 Sandeel TSB in SA4 compared with modelled scenarios.
- The Sandeel TSB for each individual North Sea stock is estimated using the best available stock assessment models and following ICES best practice. The assessment is carried out each year by an international team of fisheries experts, including experts from Marine Scotland and Cefas, and is published in detail in the Herring Assessment Working Group (HAWG) annual reports which are available online on at the ICES web page[3]. The details of the assessment methods are also reviewed in ICES benchmark reports that update the assessment methodology every few years and these are also available online at the ICES web page.
- The stock assessment presents estimates of stock biomass on 1st January in each year. Biomass will increase as fish grow in spring and will increase as larvae recruit into the stock in summer. Biomass will decrease as a result of predation, which occurs throughout the year but especially in summer. The biomass available to seabirds during the breeding season of any year will be closely similar to the estimate of stock biomass on 1st January of that year.
Kittiwake
- Adult kittiwake return rates correlated with sandeel stock biomass ( Figure 1.6 Open ▸ ). This non-linear relationship indicated that adult survival could increase rapidly when sandeel total stock biomass was increased from below 300,000 tonnes. Further increasing sandeel abundance would improve kittiwake survival much less when the stock biomass was above 300,000 tonnes.
- From the equation in Figure 1.6 Open ▸ (y = 0.0909ln–x) - 0.2944), the predicted change in adult return rate was calculated for each scenario ( Table 1.2 Open ▸ ).
Table 1.2 Predicted change in adult return rate of kittiwakes on the Isle of May with potential changes in sandeel stock.
- From the difference in adult survival predicted due to sandeel stock biomass it is possible to predict the number of additional adult birds that could survive as a result. For each SPA in SA4 between the East Caithness Cliffs SPA in the north of SA4 and the Farne Islands SPA in the south of SA4 the additional adult birds predicted to survive per annum is shown in Table 1.3 Open ▸ .
Table 1.3 Open ▸ Additional adult kittiwakes predicted to survive per annum for SPAs in SA4.
- Adult kittiwake productivity also correlated with sandeel stock biomass ( Figure 1.7 Open ▸ ). This non-linear relationship indicated that productivity could increase rapidly when sandeel total stock biomass was increased from below 300,000 tonnes. Further increasing sandeel abundance would improve kittiwake productivity less when the stock biomass was above 300,000 tonnes.
- From the equation in Figure 1.7 Open ▸ , the predicted change in productivity was calculated for each scenario ( Table 1.4 Open ▸ ).
Table 1.4 Predicted change in productivity of kittiwakes (chicks per pair) on the Isle of May with potential changes in sandeel stock.
- From the difference in productivity predicted due to sandeel stock biomass it is possible to predict the number of additional adult birds that could be produced as a result. For each SPA in SA4 between the East Caithness Cliffs SPA in the north of SA4 and the Farne Islands SPA in the south of SA4 the additional adult birds predicted to be produced per annum is shown in Table 1.5 Open ▸ . This was calculated from the predicted increase in fledged birds per annum combined with the predicted survival rate from fledging to age at first breeding (calculated from the age specific survival rates to age at first breeding = 0.4938).
Table 1.5 Additional adult kittiwakes predicted to be produced per annum for SPAs in SA4 as a consequence of improved breeding success.
Guillemot
- For guillemot, there was a similar relationship to that of kittiwake between adult return rate at the Isle of May and sandeel stock biomass. Adult guillemot return rates correlated with sandeel stock biomass that was best described by the function y = 0.0532ln(x) + 0.224 ( Figure 1.9 Open ▸ ). This non-linear relationship indicated that adult survival could increase rapidly when sandeel total stock biomass was increased from below 300,000 tonnes. Further increasing sandeel abundance would improve guillemot survival less when the stock biomass was above 300,000 tonnes.
- From the equation in Figure 1.9 Open ▸ , the predicted change in adult survival was calculated for each scenario ( Table 1.6 Open ▸ ).
Table 1.6 Predicted change in adult return rate of guillemots on the Isle of May with potential changes in sandeel stock.
- From the difference in adult survival predicted due to sandeel stock biomass it is possible to predict the number of additional adult birds that could survive as a result. For each SPA in SA4 between the East Caithness Cliffs SPA in the north of SA4 and the Farne Islands SPA in the south of SA4 the additional adult guillemots predicted to survive per annum is shown in Table 1.7 Open ▸ .
Table 1.7 Additional adult guillemots predicted to survive per annum for SPAs in SA4.
- Adult guillemot productivity also correlated with sandeel stock biomass ( Figure 1.10 Open ▸ ). This non-linear relationship indicated that productivity could increase rapidly when sandeel total stock biomass was increased from below 300,000 tonnes. Further increasing sandeel abundance would improve guillemot productivity much less when the stock biomass was above 300,000 tonnes.
- From the equation in Figure 1.10 Open ▸ , the predicted change in adult guillemot productivity was calculated for each scenario ( Table 1.8 Open ▸ ).
Table 1.8 Predicted change in productivity of guillemots (chicks per pair) on the Isle of May with potential changes in sandeel total stock biomass.
- From the difference in productivity predicted due to sandeel stock biomass it is possible to predict the number of additional adult guillemots that could be produced as a result. For each SPA in SA4 between the East Caithness Cliffs SPA in the north of SA4 and the Farne Islands SPA in the south of SA4 the predicted additional adult birds predicted to be produced per annum is shown in Table 1.9 Open ▸ . This was calculated from the predicted increase in fledged birds per annum combined with the predicted guillemot survival rate from fledging to age at first breeding (0.4243).
Table 1.9 Additional adult guillemots predicted to be produced per annum for SPAs in SA4.
Razorbill
- For razorbill, Furness et al. (2013) concluded that the closure of sandeel and sprat fisheries was likely to be effective but with insufficient evidence to have a high confidence in that assessment.
- For razorbill, there was also a relationship similar to that of kittiwake and guillemot between adult return rate at the Isle of May and sandeel stock biomass. Adult razorbill return rates correlated with sandeel stock biomass that was best described by the function y = 0.0438ln(x) + 0.3372 ( Figure 1.12 Open ▸ ). This non-linear relationship indicated that adult survival could increase rapidly when sandeel total stock biomass was increased from below 300,000 tonnes. Further increasing sandeel abundance would improve razorbill survival much less when the stock biomass was above 300,000 tonnes.
- From the equation in Figure 1.12 Open ▸ , the predicted change in adult razorbill survival was calculated for each scenario ( Table 1.10 Open ▸ ).
Table 1.10 Predicted change in adult return rate of razorbills on the Isle of May with potential changes in sandeel total stock biomass.
- From the difference in adult survival predicted due to sandeel stock biomass it is possible to predict the number of additional adult razorbills that could survival as a result. For each SPA in SA4 between the East Caithness Cliffs SPA in the north of SA4 and the Farne Islands SPA in the south of SA4 the additional birds predicted to survive per annum is shown in Table 1.11 Open ▸ .
Table 1.11 Additional adult razorbills predicted to survival per annum for SPAs in SA4.
- Unlike kittiwake and guillemot, adult razorbill productivity did not correlate with sandeel stock biomass ( Figure 1.13 Open ▸ ). There was therefore no evidence to support the hypothesis that sandeel fisheries management would result in changes in razorbill productivity.
Puffin
- For puffin, Furness et al. (2013) concluded that the closure of the sandeel and sprat fisheries was likely to be effective but with insufficient evidence to have a high confidence in that assessment, at the time of publication.
- For puffin, there was a similar relationship to that of kittiwake, guillemot and razorbill between adult return rate at the Isle of May and sandeel stock biomass. Adult puffin return rates correlated with sandeel stock biomass that was best described by the function y = 0.0963ln–x) - 0.3563 ( Figure 1.15 Open ▸ ). This non-linear relationship indicated that adult survival could increase rapidly when sandeel total stock biomass was increased from below 300,000 tonnes. Further increasing sandeel abundance would improve puffin survival much less when the stock biomass was above 300,000 tonnes.
- From the equation in Figure 1.15 Open ▸ , the predicted change in adult puffin survival was calculated for each scenario ( Table 1.12 Open ▸ ).
Table 1.12 Predicted change in adult return rate of puffins on the Isle of May with potential changes in sandeel total stock biomass.
- From the difference in adult survival predicted due to sandeel stock biomass it is possible to predict the number of additional adult puffins that could survival as a result. For each SPA in SA4 between the East Caithness Cliffs SPA in the north of SA4 and the Farne Islands SPA in the south of SA4 the additional adult puffins predicted to survive per annum is shown in Table 1.13 Open ▸ .
Table 1.13 Additional adult puffins predicted to survive per annum for SPAs in SA4.
- Adult puffin productivity also correlated with sandeel stock biomass ( Figure 1.16 Open ▸ ). This non-linear relationship indicated that productivity could increase rapidly when sandeel total stock biomass was increased from below 300,000 tonnes. Further increasing sandeel abundance would improve puffin productivity much less when the stock biomass was above 300,000 tonnes.
- From the equation in Figure 1.16 Open ▸ , the predicted change in adult survival was calculated for each scenario ( Table 1.14 Open ▸ ).
Table 1.14 Predicted change in productivity of puffins (chicks per pair) on the Isle of May with potential changes in sandeel stock.
- From the difference in productivity predicted due to sandeel stock biomass it is possible to predict the number of additional adult puffins that could be produced as a result. For each SPA in SA4 between the East Caithness Cliffs SPA in the north of SA4 and the Farne Islands SPA in the south of SA4 the additional adult puffins predicted to be produced per annum is shown in Table 1.15 Open ▸ . This was calculated from the predicted increase in fledged birds per annum combined with the predicted puffin survival rate from fledging to age at first breeding (0.4342).
Table 1.15 Additional adult puffins predicted to be produced per annum for SPAs in SA4.
Discussion and Conclusions
- A scenario testing approach was used as future predictions of the absolute sandeel TSB in SA4 cannot be made with sufficient certainty. The tested scenarios were an effective approach to determining whether a likely worst-case benefit from reduction or removal of fishing pressure in SA4 would result in sufficient change in seabird demography to compensate for the likely worst case impact prediction. Thus, the approach here was not to attempt to model a likely future sandeel TSB in SA4, and therefore likely future seabird population sizes, but to demonstrate that the minimum gain from compensation would sufficient.
- Likely gains to the SPA populations of kittiwake, guillemot, razorbill, and puffin varied across the five compensation scenarios. The scenario that produced the smallest benefit to SPA populations was consistently the change in sandeel TSB from 300,000 to 400,000 tonnes. The largest predicted change to SPA population was from the change in sandeel TSB from 100,000 to 200,000 tonnes. This was due to the shape of the relationships between species survival and productivity on the Isle of May and sandeel TSB in SA4.
- The predicted additional seabirds from predicted changes in demography as a result of the worst case compensation scenario was shown to be more than sufficient to compensate for the worst case predicted impacts from the proposed development.
1.9. Assessment of population level effects on SPA qualifying features
1.9. Assessment of population level effects on SPA qualifying features
- The assessment of population level effects on SPA qualifying features was completed using three approaches to provide different information on the predicted effects of compensation measures.
- Additional adult survival and productivity - based on the predicted benefits to adult survival and productivity from reducing or removing fishing pressure in SA4 the change in adult population size, as a result of the combined negative effects from the predicted impacts and the predicted benefits from the compensation measures, was used to calculate the number of additional adult birds per annum for each SPA qualifying feature. The predicted additional number of birds surviving per annum was compared with the predicted impact to estimate the compensation ratio from the proposed compensation measure.
- Comparison of PVA outputs from predicted impacts – PVA models were used to compare the effects of impacts from the Proposed Development alone and the effects of these impacts combined with the positive effects on population demography from the proposed compensation measures. The PVA output metrics used were the counterfactual of population size (CPS) and the counterfactual of population growth rate (CGR).
- Comparison of PVA outputs from a range of impact levels – by varying the impacts on the modelled population it was possible to determine the highest impact level that did not result in a positive population outcome from the predicted benefits from the proposed compensation measure.
SPAs & features
- For each SPA within SA4, the qualifying features were identified and the population size, population change and site condition monitoring (SCM) results of the features predicted to benefit from sandeel fisheries compensation measures were summarised.
Forth Islands SPA
- The Forth Islands SPA is a group of islands in the Firth of Forth on the east coast of Scotland designated for its breeding seabird populations. The site qualified for its Annex I breeding populations of Arctic tern Sterna paradisaea, roseate tern Sterna dougallii, common tern Sterna hirundo and Sandwich tern Sterna sandvicensis. It further qualified for its breeding migratory populations of northern gannet Morus bassanus, lesser black-backed gull Larus fuscus and in excess of 20,000 individual seabirds, including razorbill Alca torda, common guillemot Uria aalge, black-legged kittiwake Rissa tridactyla, herring gull Larus argentatus, great cormorant Phalacrocorax carbo, European shag, and Atlantic puffin.
- Four qualifying features in the SPA could be positively influenced by sandeel fisheries changes: kittiwake, guillemot, razorbill and puffin. Among these four features only kittiwake has declined since the site was designated ( Table 1.16 Open ▸ ) and this is the only feature in unfavourable site condition.
Table 1.16 Open ▸ Current population size, population change and site condition of key qualifying features of the Forth Islands SPA.
Fowlsheugh SPA
- The Fowlsheugh SPA is a stretch of 30 – 60 m high sheer cliffs on the east coast of Scotland designated for its breeding seabird populations. The site qualified for its breeding migratory populations of more than 20,000 individual seabirds, including common guillemot, black-legged kittiwake, razorbill, northern fulmar Fulmarus glacialis, and herring gull Larus argentatus.
- Three qualifying features in the SPA that could be positively influenced by sandeel fisheries changes: kittiwake, guillemot, and razorbill. Among these three features only kittiwake has declined since the site was designated ( Table 1.17 Open ▸ ). All qualifying features are in favourable site condition according to NatureScot Sitelink V3, although the decline in kittiwake breeding numbers is large.
Table 1.17 Current population size, population change and site condition of key qualifying features of the Fowlsheugh SPA.
St Abb's Head to Fast Castle SPA
- The St Abb's Head to Fast Castle SPA is a stretch of cliffs on the east coast of Scotland designated for its breeding seabird populations. The site qualified for its breeding migratory populations of more than 20,000 individual seabirds, including common guillemot, black-legged kittiwake, razorbill, herring gull and European shag.
- Three qualifying features in the SPA that require compensation due to predicted impacts from the Proposed Development could be positively influenced by sandeel fisheries changes: kittiwake, guillemot, and razorbill. Among these three features only kittiwake has declined since the site was designated ( Table 1.18 Open ▸ ) and this is the only feature in unfavourable site condition.
Table 1.18 Current population size, population change and site condition of key qualifying features of the St Abb's Head to Fast Castle SPA.
Buchan Ness to Collieston Coast SPA
- The Buchan Ness to Collieston Coast SPA is a stretch of cliffs on the east coast of Scotland designated for its breeding seabird populations. The site qualified for its breeding migratory populations of more than 20,000 individual seabirds, including common guillemot, black-legged kittiwake, herring gull, European shag and northern fulmar.
- Two qualifying features in the SPA could be positively influenced by sandeel fisheries changes: kittiwake and guillemot. Between these two features only kittiwake has declined since the site was designated ( Table 1.19 Open ▸ ) and this is the only feature in unfavourable site condition.
Table 1.19 Current population size, population change and site condition of key qualifying features of the Buchan Ness to Collieston Coast SPA.
Farne Islands SPA
- The Farne Islands SPA comprises a group of low-lying islands off the coast of Northumberland in north-east England. The site qualified for its Annex I breeding populations of Arctic tern, roseate tern, common tern and Sandwich tern. It further qualified for its breeding migratory population of common guillemot and further for holding in excess of 20,000 individual seabirds, including black-legged kittiwake, great cormorant, European shag, and Atlantic puffin.
- Three qualifying features in the SPA that could be positively influenced by sandeel fisheries changes: kittiwake, guillemot and puffin. Among these features only kittiwake has clearly declined since the site was designated ( Table 1.20 Open ▸ ). The change in guillemot abundance shown is likely within the error of the count, so the population has changed little since designation.
Table 1.20 Current population size, population change and site condition of key qualifying features of the Farne Islands SPA
Troup, Pennan and Lion's Heads SPA
- The Troup, Pennan and Lion’s Heads SPA is a stretch of cliffs along the north coast of Aberdeenshire. The site qualified for its breeding migratory populations of kittiwake, guillemot and assemblage of breeding seabirds including razorbill, fulmar and herring gull.
- Three qualifying features that could be positively influenced by sandeel fisheries changes: kittiwake, guillemot and razorbill ( Table 1.21 Open ▸ ). Both kittiwake and guillemot have declined at this site and are in Unfavourable condition. Despite a population increase in recent years, the condition of razorbill is still listed by NatureScot as Unfavourable Declining.
Table 1.21 Current population size, population change and site condition of key qualifying features of the Troup, Pennan and Lion’s Heads SPA
East Caithness Cliffs SPA
- The East Caithness Cliffs SPA includes most of the sea cliffs from Wick or Helmsdale on the east coast of Caithness in north of the Scottish mainland. The site qualified for its Annex I breeding population of peregrine, its breeding migratory populations of guillemot, razorbill, kittiwake, herring gull and shag, and its breeding seabird assemblage of 300,000 individual seabirds including guillemot, razorbill, kittiwake, herring gull, great black-backed gull, fulmar, cormorant and shag ( Table 1.22 Open ▸ ). The kittiwake population has declined, though it is listed as Favourable and in Maintained condition by NatureScot. Both guillemot and razorbill populations have increase substantially and both are in Favourable condition.
Table 1.22 Current population size, population change and site condition of key qualifying features of the East Caithness Cliffs SPA
Flamborough and Filey SPA
- The RIAA found that the in-combination impact on kittiwake and razorbills populations at the Flamborough and Filey Coast (FFC) SPA from the Proposed Development, and other reasonably foreseeable plans and projects, could be sufficient that it may not be possible for the competent authority to conclude that there was no adverse effect on site integrity. The FFC SPA is not adjacent to SA4, where the proposed compensatory measures will be applied. It therefore not possible to apply the same evidence of changes in sandeel TSB and seabird demography to the FFC SPA, as the majority of individuals will be foraging within SA1r, not SA4. The results of the RIAA of impacts from the Proposed Development on the FFC SPA is, in part, due to the apportioning of impacts based on, among other parameters, the mean of the maximum foraging range of these species overlapping with the footprint of the Proposed Development. This apportioning uses foraging range information based on tracking of seabirds during the breeding season and applies this distance equally in all directions.
- Tracking of kittiwakes from the FFC SPA indicates that birds are foraging entirely in SA1r (Wischnewski et al. 2017) and not in SA4, during the chick rearing phase of the breeding season at least. The apportioning would also suggest that only a relatively small proportion of the FFC SPA populations for both of these species would forage in SA4. Any direct benefit to the FFC SPA from changes in sandeel fisheries management in SA4 would therefore only directly benefit a relatively small proportion of the FFC SPA populations, but it would be expected that any birds from FFC SPA that did forage in SA4 would benefit from the proposed sandeel fisheries compensation measures. However, this proportion is difficult to estimate and would be a major source of uncertainty in any quantitative assessment of the impacts and benefits of the proposed sandeel fisheries compensation measures to that part of the FFC SPA populations. However, it is likely that the whole of the FFC SPA colony would benefit from two key consequences of the proposed sandeel fisheries compensation measures:
- Increase in the number of recruits from colonies in SA4 available to immigration in to the FFC SPA; and
- Spill over effects from the reduction in sandeel fishing mortality in to SA1r.
- The predicted increases in kittiwake and razorbill populations in SPAs where birds forage in SA4 would very likely result in large increases in populations size, as a result of increases in both adult survival and productivity for kittiwake and adult survival for razorbill. This would likely result in general population increases across all colonies that forage in SA4 (i.e. including colonies not in SPAs) resulting in a large number of recruits available for emigration into other colonies on the North Sea coast. Ringing information shows that kittiwake (Coulson & Coulson 2008) tends to recruit to colonies away from their natal colony. However, natal recruitment appears to be relatively high in razorbill (Lavers et al. 2007), in the western Atlantic at least. Though these authors also stated that dispersal and recruitment into new colonies partly explained the population dynamics in these populations of razorbill.
- Spill over effects in sandeels are somewhat limited, as adult fish are highly sedentary. However, larval spill over is likely to occur from sandbanks in SA4, over distances of about 100 – 150 km (Sørensen et al. 2009). The net water flow in the North Sea is southwards along the North Sea coast of Scotland and England, and so from SA4 to SA1r, which would tend to move some of any increased abundance of sandeel larvae in the southern part of SA4 into SA1r. This has the potential to increase sandeels in SA1r, where most of the kittiwakes and razorbills from the FFC SPA forage. It is difficult to predict the level of increase in sandeels available to seabirds in SA1r as a result of spill over from SA4 as a result of changes to fisheries management. However, Sørensen et al (2009) modelled the closure of a single ICES rectangle on the Dogger Bank (ICES 37F2). They stated that this would result in, “the total southern North Sea [sandeel] yield increasing by 16% based on a crude assumption of effort response”. Thus, it is very likely that changes to the management of sandeel fisheries in SA4 would result in more substantial spill over effects in to SA4.
- Given the predicted impacts on the FFC SPA for both are extremely small from the Project alone, the proposed sandeel fisheries compensation measures are very likely to be sufficient to also provide adequate compensation to the FFC SPA.
Additional adult survival and productivity
- The number of additional adult birds in each SPA population as a result of the increase in adult survival and productivity predicted to occur from the increase in sandeel TSB from 300,000 tonnes to 400,000 tonnes was calculated. The gain from the increase in adult survival was calculated from the change in survival applied to each SPA population size. The gain from the increase in productivity was calculated by multiplying the change in productivity by the number of pairs of birds in each SPA and then adjusting the number of birds by the overall survival from fledging to age at first breeding. This provides an estimate of the additional birds available for recruitment into the population. Not all birds that fledge and survive to recruit will be added to either each SPA population or the SPA network. However, the proposed compensation measure is very likely to result in increased adult survival and productivity to all colonies that forage within SA4, thus the total number of birds available to recruit into the whole meta-population should increase. As a result, the predicted increase in population size due to productivity increases from the compensation measure is likely to be a reasonable estimate.
- These predicted increases were compared with the predicted impacts across the three impact scenarios. These are summarised in Table 1.23 Open ▸ .
Table 1.23 Predicted increase in the number of adult birds surviving per annum as a result of the combined compensation measures minus the predicted impacts for each SPA qualifying feature impacts and in total.
- Since the aim of the compensation measures is to ensure the coherence of the UK SPA network, the overall benefit of the compensation measure compared with the overall impact to the SPA network was used to estimate the compensation ratios for each species for each impact scenario ( Table 1.24 Open ▸ ). This shows that the potential lowest increase due to compensation (based on the increase in sandeel TSB from 300,0000 to 400,0000 tonnes) would result in at least a 1:7 compensation ratio (for guillemot) and up to a 1:40 ratio for puffin, if the higher scoping opinion impact level was assumed. Ratio are even larger for the other impact scenarios.
Table 1.24 Estimated compensation ratios for each SPA qualifying feature with potential to be impacted across all three impact scenarios
Using PVA to assess compensation
Scenario testing approach
- The assessment of additional adult survival and productivity provided good evidence that the increase in adult survival alone or the increase in adult productivity alone would be more than sufficient to compensate for the predicted impacts from the Proposed Development. However, it was considered important to show that the effects of the compensatory measure on demographic rates result in longer term increases in population size of each impacted SPA. The approach to assessing the effects of compensation measures was to use a scenario testing approach using PVA models.
- There is very strong empirical evidence to demonstrate that reducing or removing fishing pressure in SA4 would have a highly beneficial effect on the impacted seabirds. However, it is necessary to quantify this benefit to demonstrate that the benefits generated offset the potential impact on seabirds. In order to provide as much certainty as possible that reducing or removing fishing pressure in SA4 will be effective, a number of scenarios were developed based on plausible changes in the sandeel stock biomass. Consequently, scenarios were based on a range of plausible changes in sandeel stock biomass. The historic stock biomass of sandeels in SA4 was about 900,000 tones. Therefore, an estimated Cury et al. (2011) one-third-for-the-birds threshold was approximately 300,000 tonnes. Five potential scenarios were considered useful in assessing the benefits of the proposed compensation measure on seabird SPA populations. Increases in sandeel stock biomass from below 300,000 tonnes were considered useful, with changes from 100,000 to 200,000 tonnes and 200,000 tonnes to 300,000 tonnes estimated (see Figure 1.26 Open ▸ ). In addition, increases in stock biomass from 300,000 tonnes to 400,000, 600,000 and 800,000 tonnes provided information on plausible future sandeel stock biomass levels being maintained above the Cury threshold but below the historic maximum stock biomass.
- The PVAs were run using five scenarios for how the compensation could affect demographic rates (where evidence allowed). These scenarios allowed for positive changes to adult survival only, positive changes to productivity only, and positive changes to both adult survival and productivity simultaneously. The positive effects on these demographic parameters are not independent as both adult survival and productivity are predicted to be affected by sandeel stock biomass. As such the scenarios where only adult survival was increased, or only productivity was increased, were precautionary. However, the scenarios where both survival and productivity were increased were likely to be the most realistic. The effects of change in sandeel stock biomass were based on correlations between adult return rate (a proxy for survival) or productivity and the sandeel stock biomass estimated by ICES. The relationships used in the primary testing of compensation described here were based on publicly available data from the Isle of May ( Table 1.25 Open ▸ ). These relationships were estimated from the data from 2004 to 2019, during which time the seabird populations were recovering from previously very low sandeel stock biomass levels in SA4. Note that there was no apparent relationship between sandeel stock biomass and productivity of razorbills, so this parameter was kept static in all scenarios.
Table 1.25 Summary of the correlations between demographic parameters and sandeel stock biomass in SA4 from 2004 – 2019, with some exceptions (see text). Data from the Isle of May studies by UKCEH.
- Precaution was incorporated into the scenario testing approach through the lack of change to immature survival and age at first breeding. Both of these demographic elements would be expected to benefit from sandeel fisheries compensation measures. However, there was no empirical information to parameterise the increase in immature survival or the decrease in age at first breeding. In addition, the colonies of seabirds within SPAs do not occur as discrete populations but are part of a larger meta-population. The predicted changes to adult survival and productivity should be expected to positively affect all seabird colonies where birds forage within SA4, including those colonies not designated as SPAs. This overall change in population size across SPA and non-SPA colonies would likely increase population stability and resilience to future pressures.
Baseline
- The PVA assessments of the effects of reducing or removing fishing pressure from SA4 were based on the values used in the PVA for the RIAA, with the exception of the survival and/or productivity values obtained from the relationships between adult return rate (as a proxy for survival, referred to as survival hereafter) and productivity. The baseline against which impacts, and compensation for those impacts, was compared, was dependent on the change in survival and/or productivity from the relationships summarised in Table 1.25 Open ▸ . The baseline survival and productivity values were calculated from the relationship between sandeel stock biomass and productivity for the TSB values of 100,000, 200,000 and 300,000 tonnes. These values were used for each scenario as appropriate. The starting population sizes for each SPA qualifying feature, and the year of the count, are shown in Table 1.26 Open ▸ .. All PVA input demographic values are provided in Table 1.27 Open ▸ .
Table 1.26 Initial population size and year of count from each SPA colony assessed.
Table 1.27 Demographic values used in PVA assessments of the efficacy of proposed compensation measures.
Impacts on adult survival
- For each SPA qualifying feature tested, as the level of impact required to result in a counterfactual of population growth rate value less than one (i.e. the population growth rate would be less than the baseline). This change in sandeel stock biomass was found to result in the smallest predicted change in demographic rates of the scenarios tested above, so was the most precautionary estimate to use. Based on the most recently available estimate of population size the impact on adult survival was calculated for a series of three impact levels up to the level where the CGR value was less than one. These are summarised in Table 1.28 Open ▸ . For each SPA qualifying feature, the overall change in adult survival and productivity predicted to occur due to both the negative effects of the predicted impacts from the Proposed Development offshore wind farm and the positive effects predicted from changes in sandeel biomass from 300,000 to 400,000 tonnes in SA4 were calculated Table 1.28 Open ▸ .
Table 1.28 Summary of the predicted mortality of adult birds from SPAs and the calculated effect on adult survival
PVA projections
- The results are presented below for projected CGR and CPS values based on the assumption that impacts begin in 2027 and end in 2077 (i.e. 50 years). A longer population model projection was used for the compensation measures assessment than for the RIAA as compensation measures should be provided in the long term. Seabirds are particularly long-lived birds, so longer population projections were used to assess the long-term effects of the measure. The impacts were assumed to continue for the entire duration of the run, so that the results were both precautionary and in relation to the predicted impact levels. In reality, impacts would cease after the decommissioning of the wind turbines. The absolute population size increases from the PVA’s described here are all likely to be unrealistic, as they are assumed to be density independent and closed populations (i.e. no immigration or emigration). However, PVA model results are best interpreted as relative differences rather than as absolute predictions of a likely future condition. In particular, the difference in population growth rates is likely to be the most informative.
Comparison of PVA outputs from predicted impacts
- For each of the SPAs predicted to be impacted by more than a trivial amount, PVAs were run for the scenarios described above.
Kittiwake
- The median counterfactual metrics (CGR and CPS) for the impact scenarios were all below one for all three impact scenarios ( Table 1.29 Open ▸ ). All the confidence interval metrics were also below one. The CGR and CPS median values were greater than one for all compensation scenarios where predicted compensation effects from a change in sandeel TSB from 300,000 tonnes to 400,000 tonnes were combined with predicted impacts. This is strongly indicative that the proposed compensatory measures will overcome the predicted impacts for kittiwakes at all SPAs assessed. In all cases the combination of the most precautionary (i.e. largest) impact and the most precautionary estimates of compensation (i.e. smallest increase in stock biomass) generated overall increases in population growth and population size.
Table 1.29 PVA metrics (CGR & CPS) from kittiwake model projections of impacts from the Proposed Development alone and impacts from the Proposed Development alone minus the beneficial effects of proposed compensation metrics (based on a change in sandeel TSB from 300,000 tonnes to 400,000 tonnes). Shaded cells are larger than one.
Guillemot
- The median CGR and CPS metrics for the impact scenarios were all below one for all three impact scenarios ( Table 1.30 Open ▸ ). Some of the upper confidence intervals for the CGR and CPS values were greater than one for some impact scenarios at some SPAs. The CGR and CPS median values were greater than one for all compensation scenarios where predicted compensation effects from a change in sandeel TSB from 300,000 tonnes to 400,000 tonnes were combined with predicted impacts. This is strongly indicative that the proposed compensatory measures will overcome the predicted impacts for guillemots at all SPAs assessed. In all cases the combination of the most precautionary (i.e. largest) impact and the most precautionary estimates of compensation (i.e. smallest increase in stock biomass) generated overall increases in population growth and population size.
Table 1.30 PVA metrics (CGR & CPS) from guillemot model projections of impacts from the Proposed Development alone and impacts from the Proposed Development alone minus the beneficial effects of proposed compensation metrics (based on a change in sandeel TSB from 300,000 tonnes to 400,000 tonnes). Shaded cells are larger than one
Razorbill
- The median CGR and CPS metrics for the impact scenarios were all below one for all three impact scenarios ( Table 1.31 Open ▸ ). Some of the upper confidence intervals for the CGR and CPS values were greater than one for some impact scenarios at some SPAs. The CGR and CPS median values were greater than one for all compensation scenarios where predicted compensation effects from a change in sandeel TSB from 300,000 tonnes to 400,000 tonnes were combined with predicted impacts. This is strongly indicative that the proposed compensatory measures will overcome the predicted impacts for razorbills at all SPAs assessed. In all cases the combination of the most precautionary (i.e. largest) impact and the most precautionary estimates of compensation (i.e. smallest increase in stock biomass) generated overall increases in population growth and population size.
Table 1.31 PVA metrics (CGR & CPS) from razorbill model projections of impacts from the Proposed Development alone and impacts from the Proposed Development alone minus the beneficial effects of proposed compensation metrics (based on a change in sandeel TSB from 300,000 tonnes to 400,000 tonnes). Shaded cells are larger than one
Puffin
- The median CGR and CPS metrics for the impact scenarios were all below one for all three impact scenarios ( Table 1.32 Open ▸ ). Most of the upper confidence intervals for the CGR and CPS values were greater than one for all but the largest impact scenario at both SPAs. The CGR and CPS median values were greater than one for all compensation scenarios where predicted compensation effects from a change in sandeel TSB from 300,000 tonnes to 400,000 tonnes were combined with predicted impacts. This is strongly indicative that the proposed compensatory measures will overcome the predicted impacts for puffins at both SPAs assessed. In both cases the combination of the most precautionary (i.e. largest) impact and the most precautionary estimates of compensation (i.e. smallest increase in stock biomass) generated overall increases in population growth and population size.
Table 1.32 PVA metrics (CGR & CPS) from puffin model projections of impacts from the Proposed Development alone and impacts from the Proposed Development alone minus the beneficial effects of proposed compensation metrics (based on a change in sandeel TSB from 300,000 tonnes to 400,000 tonnes). Shaded cells are larger than one
Conclusions for all Potentially impacted SPAs
- The ability of the proposed compensatory measure, reducing or removing fishing pressure in SA4, was tested using relationships between sandeel TSB in SA4 and adult return rate (as a proxy for adult survival) or productivity. Across the range of likely changes in sandeel TSB in SA4 as a result of reducing or removing fishing pressure, positive effects on adult survival and productivity were shown. The assessment here was based on the smallest demographic changes predicted, which corresponded to the change in sandeel TSB from 300,000 to 400,000 tonnes. The positive effects of these predicted changes in demographic parameters were compared with the negative effects of three predicted impact scenarios from the Proposed Development alone. Three different approaches to this assessment were made:
- Predicted increase in number of adult birds in each SPA population and in the SPA network based on increased adult survival;
- Predicted change in populations growth rate and size due to the effects of compensation and impacts combined using PVA; and
- Predicted relationship between CRG and impact level compared with three impact prediction scenarios, using PVA.
- For all three approaches, for all species and all SPAs, it was clear that the predicted minimum benefit from reducing or removing fishing pressure in SA4 was sufficient to compensate for all predicted impact scenarios.
- For the FFC SPA, the predicted impacts were very small from the Project alone. A qualitative assessment concluded that the combination of spill-over effects of sandeel larval drift from SA4 to SA1r and the increased population size of kittiwake and razorbill colonies in SA4, resulting in increased emigration from those colonies to FFC SPA, would very likely more than compensate for the small predicted impacts.
1.10. Dealing with uncertainty, precaution and confidence
1.10. Dealing with uncertainty, precaution and confidence
- Key to reaching robust conclusions on the potential value of reduction or removal of fishing pressure on sandeels as a compensation measure is understanding the uncertainties in the assessment. This section addresses the uncertainties around both the predicted impacts and predicted benefits of the proposed sandeel management measures. In reaching conclusions with uncertain information, it is important to apply suitable levels of realistic precaution to the assessment as this helps to deliver confidence in the conclusions reached on the efficacy of the proposed compensation measures.
Uncertainty
- Two key sources of uncertainty were identified in assessment of the effects of the proposed sandeel fisheries compensatory measures and their ability to address the predicted impacts: the uncertainty around the seabird data and uncertainty around the sandeel data.
- In addition, the application of correlations between these data sources presents its own uncertainties. The effectiveness in reaching conclusions based on correlative data is therefore addressed separately.
Seabird data
- Among the key seabird data used in assessing the proposed sandeel compensation measures, the three key seabird parameters where the uncertainty needed to be assessed were:
- Adult survival data;
- Productivity data; and
- Population size data.
Adult survival
- In the relationships between sandeel TSB and seabird demographic parameters, adult survival has been based on the return rate of adult birds to the Isle of May breeding colonies in each year. This proxy will underestimate the apparent adult survival of birds as it does not take into account the resighting probability. From year to year there will be birds present in the colony that were present but not resighted but are then seen on the colony in subsequent years. The return rate fails to account for these birds that were present but not seen in a particular breeding season. Modelling of adult survival does account for the resighting probability to provide a better estimate of the “apparent” survival. This would likely increase the estimated value of apparent adult survival compared to the return rate values used in the correlations between sandeel TSB and survival. However, it is likely that all of the values would have been increased only slightly, as the resighting rate on the Isle of May is very high because that colony is studied in great detail by expert ornithologists, not only intensively but also following very systematic protocols. Birds that were colour ringed at the Isle of May for survival study were selected to be in locations within the colony where resighting is relatively easy. It is also likely that any increase would be similar each year because the effort put in is consistent across years. Therefore, the relationships between sandeel TSB and return rate would likely be very similar to the relationship between sandeel TSB and apparent adult survival. The modelling of apparent adult survival was not possible for this report
- While the use of return rates as a proxy for adult survival did introduce some uncertainty in the assessment it was thought to be small, mainly due to the high resighting rate achieved by UKCEH researchers on the Isle of May. However, this uncertainty is accounted for by considering worst case scenarios rather than mean estimates of impact and gain (see below).
- Another element of uncertainty is the assumption that survival rates of seabirds at other colonies in the region are similar to those monitored at the Isle of May. There are no data on survival rates at other nearby colonies to compare with the Isle of May time series, but it is likely that patterns correlate among colonies as colonies are exposed to the same major drivers of variation. Correlations in time series of breeding success across neighbouring colonies have been reported in several studies (e.g. Olin et al. 2020), and this is therefore likely also to apply to adult survival except where colony-specific impacts may alter that general pattern at specific individual colonies. Geographically widespread correlations between annual survival time series from different colonies have been reported for several seabird species, strengthening the case that such time series tend to respond strongly to wider ecosystem/environment drivers.
Productivity
- There are two sources of productivity used in this report. Firstly, productivity was obtained from publicly available data provided by UKCEH from their long term study of seabirds on the Isle of May. Secondly, productivity from the JNCC SMP database was obtained for kittiwake colonies in SA4 both adjacent to and away from the sandeel box.
- The productivity data from UKCEH is of a very high standard using consistent methods and regular fieldwork throughout the breeding season. There will still be some uncertainty in the data, which will vary between years and species. Productivity of seabirds will be influenced by multiple factors, which will include food supply, weather and predation. The data used here did not account for the effects of weather or predation on productivity. These effects will add noise to the correlation between productivity and sandeel TSB. For some species the effects of predation or weather can cause productivity to be well below the average in specific years. Despite this noise in the data there was good evidence of a non-linear relationship between productivity on the Isle of May and sandeel TSB in SA4.
- The productivity data from the SMP database were collected from multiple colonies by a variety of people and organisations. There was variability in the number of years of data between colonies. As with the data from the Isle of May, weather and predation will add noise to these data.
Population size
- Population size data were obtained from publicly available sources. This was a combination of data from UKCEH and from NatureScot. As with return rate and productivity data, the population size data were of a very high standard, collected by very experienced staff to standard methods each season. There will still be some uncertainty in these data, as for example counts of large colonies, or colonies that are difficult to view from vantage points will be more likely to miss some nesting birds than smaller colonies. These issues are well known and have been reviewed many times (e.g., Mitchell et al. 2004).
Sandeel data
- Among the sandeel data used in assessing the proposed sandeel compensatory measures, the key sandeel parameter where the uncertainty needed to be assessed was the estimate of TSB.
- Sandeel TSB data from SA4 were obtained from the most recent stock assessment report (ICES 2022). This is a modelled output based on a variety of data, including the previous years’ catch and effort data. Modelled outputs will have different uncertainties than empirical data but are often preferred as either empirical data cannot be collected (the case with sandeel TSB) or cannot be sampled sufficiently to provide data the is robust enough for the intended purpose.
- The ICES approach is to use a Stochastic Multi-Species (SMS) assessment model. This is the best available assessment model and is considered to be a “state-of-the-art” model; it is regularly reviewed by ICES in Benchmark Working Groups and is improved when possible (ICES 2017). The model is run in single species mode using seasonal time-steps, necessary to distinguish the fishing season. The model integrates catch data, effort time series data, biological sampling from catches (e.g., age-class abundance, fish maturity, weight), survey data such as from modified dredge sampling within the sandeel box area, and estimates of natural mortality based on predatory fish diet sampling and estimates of predatory fish stock biomass. ICES coordinate a regular working group to peer review the multi-species assessment methods, which aims to enable research to improve the ecosystem approach to stock management. The Working Group on Multispecies Assessment Methods (WGSAM) continues to recommend the use of the SMS for stock size prediction. Details of the SMS methodology and uncertainties are provided in ICES 2017 and 2021b.
- The sandeel TSB predictions from the SMS is clearly the best scientific knowledge in the field. While it does contain uncertainties that will affect the relationships between seabird demographics and sandeel TSB these are minimized through a rigorous and transparent peer review process undertaken by ICES. Two processes can particularly affect confidence in the assessment outputs. One is where a change is introduced to the assessment that alters all previous outputs in a systematic way. For example, revision of the diet composition data may alter estimated natural mortality, leading to an increase or decrease in TSB that is proportional for all years (or more disconcertingly creates a step change between two time periods). The other is the fact that all previous estimates alter when a new set of annual sampling is added to the model. This latter effect can especially alter the assessment model estimates for the most recent year or two but tends to have minimal influence on TSB estimates from earlier years. In practice, TSB estimates are revised every year when the stock assessment incorporates one further year’s new data, but the correlation between the TSB time series published in year x is very highly correlated with the TSB time series published in year x-1. Changes to the data each year can be disconcerting but are very small relative to the very large variability in TSB over decades.
Correlations
- The key evidence used to demonstrate that sandeel fisheries management changes can be used to compensate for predicted impacts from the Proposed Development was correlative. It is hypothesized that these correlations are based on causative relationships. The nature of the relationship between seabird demography and the accessibility of prey is clear, seabirds need to feed in order to maintain themselves, female birds need to gain enough energy to produce an egg, and both the male and female birds need enough energy to be able to additionally forage to provide for chicks while they are nutritionally dependent. Where the prey availability is low this would be expected to have an effect on foraging birds, initially affecting productivity as birds would be expected forgo current productivity to maintain survival, but if forage conditions remain poor then adult survival can become affected as birds starve.
- Walton (2008) proposed seven types of critical questions that can help to strengthen the argument from correlation to causation:
- Is there a positive correlation between A and B?
- Are there a significant number of instances of the positive correlation between A and B?
- Is there good evidence that causal relationship goes from A to B, and not just from B to A?
- Can it be ruled out that correlation between A and B is accounted for by some third factor (a common cause) that causes both A and B?
- If there are intervening variables, then can it be shown that the causal relationship between A and B is indirect (mediated through other causes)?
- If the correlation fails to hold outside a certain range of causes, then can the limits of this range be clearly indicated?
- Can it be shown that the increase or change in B is not solely due to the way that B is defined, the way that entities are classified as belonging to a class of Bs, or changing standards, over time, of the way Bs are defined or classified?
- Walton (2008) points out that it can, “always (be) suggested that there might be some other factor at work that might throw doubt on the causal relationship between A and B. As each of the above seven critical questions is adequately answered …the causal claim is strengthened.”
- Each of these questions was therefore considered and responses provided to determine whether, by answering these questions, the correlations that underlie the evidence that reducing fishing mortality of sandeels in SA4 were sufficiently strong to be able to conclude that there will be sufficient population change to compensate for the predicted impacts from the Proposed Development (section 1.9).
Table 1.33 Responses to Walton’s (2008) critical questions.
- Walton (2008) points out that we may have a strong suspicion that there is a causal link between two correlated parameters, as is the case with the relationships between seabird demography and sandeel TSB. By adequately answering each of the seven critical questions in Table 1.33 Open ▸ , Walton (2008) suggests that suspicions of a causal link become “more and more highly strengthened as an argument”. While it is “not easy to establish conclusively that there is a causal link between two” variables, the aim of the monitoring and adaptive management (as outlined in the Implementation and Monitoring Plan) will be to provide the demonstration of that causal link.
- In conclusion, while this report is based on correlations between variables, each of Walton’s (2008) critical questions can be answered robustly, and therefore there are strong grounds for concluding that these correlations are highly likely to be causative.
Precaution
Precaution applied to the assessment of evidence
- As discussed above, the available information from UKCEH on seabird demography from the Isle of May includes the return rate of individually marked birds from one breeding season to the following season. This is used in this report as a proxy for apparent adult survival. The analysis of resighting information of marked birds to estimate survival accounts for birds that were not seen on one breeding season but were seen in a subsequent breeding season. Consequently, the return rate will be a smaller estimate of adult survival rather than the modelled apparent survival. This is therefore a precautionary estimate of adult survival. However, it is likely that the relationship with sandeel TSB in SA4 would have remained very similar had apparent adult survival been used, only with the adult survival data based on slightly larger values across the range of TSB values. In addition, the scenario testing approach examined the effect of change in adult survival between two sandeel TSB values. The change in adult survival would likely have been much the same between return rate data and apparent survival data, so the Population Viability Analysis (PVA) metrics used to assess the effectiveness of the scenarios would have likely been the same, or very similar. This is outlined in Section 1.8 below.
- In conclusion, any precaution in using return rate as a proxy for apparent survival would likely have made little or no difference in the assessment of the benefit of the proposed compensation measures.
Impact scenarios
- The impact scenarios used in the assessment within this report were identical to those used in the Report to Inform the Appropriate Assessment (RIAA). This provided three impact scenarios based on advice from NatureScot, Marine Scotland Science and a developer preferred approach. While all three impact levels were considered, conclusions on the efficacy of the proposed sandeel fisheries compensatory measures were based on the most precautionary of these three scenarios. The assessment included the other impact scenarios to provide a suitable context for a range of plausible, but still precautionary, predictions of impacts on the qualifying features of the SPAs under consideration.
Compensation scenarios
- The approach used to assess the level of benefit predicted to occur from the proposed compensatory measures was based on a scenario testing approach. Scenarios were based on the potential changes in sandeel TSB in SA4 as a result of changes to fisheries management. Five scenarios were chosen that reflected both the range of historic sandeel TSB values in SA4 and the non-linear relationship between sandeel TSB and either survival or productivity.
- Five scenarios were examined (see Section 1.8) that covered the distribution of historic sandeel TSB data, with conclusions based on the most precautionary scenario (this was the change in sandeel TSB from 300,000 tonnes to 400,000 tonnes). It is important to note that this was not a prediction of the expected change in sandeel TSB as a result of the compensatory measure, but only a realistic worst-case scenario to help aid decision making. Scenarios were based on changes in TSB of 100,000 tonnes, so that the five scenarios covered the bulk of the historic TSB data and reflected the levels of change seen in TSB across the available dataset.
- This most precautionary improvement in seabird demography was then compared with the three impact scenarios, which included the most precautionary impact scenario. Thus, the conclusions were based on the likelihood that a worst-case compensation benefit would be sufficient to overcome a worst case impact prediction. This is a highly precautionary approach, which was chosen to improve the confidence that could be placed in the results.
Confidence
Evidence from other sandeel stocks
- The confidence in the effect of changes in sandeel stocks in SA4 on seabird demographics was increased by the presence of evidence from other sandeel stocks in the North Sea. Evidence of the effects of declining sandeel stocks on kittiwake productivity and survival were shown in SA7 (see Figure 1.5 Open ▸ , and Oro and Furness 2002). The hindcast modelling by Lindegren et al. (2018) showed that sandeel stocks in SA1r would be larger with lower fishing mortality. The Ecopath with Ecosim modelling by Natural England (unpublished at the time of writing) also showed that reducing, or closing, the sandeel fishery in the North Sea would result in increases in sandeel stock biomass and increases in the populations of predatory fish, seabird and mammal species that feed on these stocks.
- These additional pieces of evidence lend weight to the evidence shown in this report and increases confidence that change in the management of the sandeel stock in SA4 would result in benefits to both the stock itself and a wide variety of species that forage on this stock.
Evidence from other seabird/fisheries interactions
- The review of the effectiveness of Marine Protected Areas, and specifically the effects of changes to fish stock protection or exploitation (see Annex A) showed that there are many instances, from a wide variety of fish species, fisheries types and seabird species, from around the world of the benefits of fisheries management practices that take seabird foraging needs into account. Many of these were included in the analysis by Cury et al. (2011), which also included the North Sea sandeel stock. The presence of multiple examples of the positive effects of fisheries management changes to benefit seabirds increases the confidence that the proposed compensatory measures for the Proposed Development will also result in benefits to breeding seabird populations in SA4.
Discussion and Conclusions
- The uncertainties in the information used in this report to show the effectiveness of the proposed sandeel fisheries compensatory measures were identified. By identifying these uncertainties it was possible to determine the effect of these on the assessment of the effectiveness of the proposed measures. In several important cases, most notably the use of return rates as a proxy value for adult survival, the presence of uncertainties in the underlying data was unlikely to have had any important effect on assessment of compensation effectiveness.
- To manage the uncertainty in both the impact assessment and the assessment of the effectiveness of the proposed sandeel fisheries compensatory measures to overcome these a suitable precautionary approach was applied. This was mainly through the identification of reasonable worst-case impact and compensation scenarios. By comparing the worst case (i.e. highest) impact scenario against the worst case (i.e. lowest) benefit from compensation a highly precautionary approach was taken. By applying this precautionary approach confidence that the proposed compensatory measures will be sufficient is greatly increased.
- Confidence was also improved through the building of the evidence from other studies to support the concept of the sandeel fisheries stock management as a compensatory measure. Evidence was shown for the benefits from other fisheries and seabird populations around the world, and from other sandeel stocks in the North Sea.
1.11. General conclusions
1.11. General conclusions
- There is strong evidence globally that conservation management measures to reduce or eliminate fishing mortality on seabird prey fish stock has had important benefits across a wide variety of fish species, fisheries and seabirds. This led to the conclusion that similar measures on sandeel stocks in the North Sea could be used to positively affect seabird populations predicted to be impacted by the Proposed Development.
- It was therefore important to determine if the sandeel stock in the North Sea could be managed to increase the stock of prey for seabirds. There was strong evidence that the sandeel population in the North Sea, including in SA4, was smaller than historic records show and that this was primarily due to high fishing mortality, both in the recent past and currently. There was also strong evidence that in SA4 specific management measures to increase the stock had only been partially effective. The sandeel box has displaced fisheries to the waters outside the box, while simultaneously basing the TAC on the total populations of sandeels in SA4 (including inside the box), resulting in much higher fishing mortality on the remaining sandeels outside the box in SA4.
- There is strong evidence that sandeel stocks are important for seabirds foraging in the North Sea during the breeding season. There is strong evidence that kittiwake breeding success and survival are influenced strongly by sandeel abundance. There is also good evidence that sandeel abundance has an influence on the breeding success of other seabirds. There is strong evidence that the foraging range of seabirds varies during the breeding season and that seabirds in SA4 are likely to rely on sandeel abundance across a large part of the area outside the sandeel box.
- The presence of strong published evidence that sandeel abundance strongly affected breeding success and abundance across a wide range of breeding seabird species led to analyses to examine if similar relationships occurred for kittiwake, guillemot, razorbill and puffin foraging in SA4. Strong relationships were found between sandeel abundance and seabird abundance, productivity and return rate (a proxy for adult survival) for all the species assessed, except for razorbill, where there was no relationship with productivity.
- There was also strong evidence of recovery of sandeel stocks in the North Sea following closure of the fishery. This included evidence from the sandeel box in SA4.
- Various elements combined to strongly suggest that SA4 is likely to be the most effective scale for compensation. Foraging range information, based on tracking data from a relatively limited period of the annual cycle, showed that important areas of sandeel habitat occurred outside the box. New analyses of kittiwake productivity from colonies within SA4 that either adjacent to the box or outside the box showed no important difference in the relationship between productivity and TSB in SA4. This finding adds to the evidence that seabird populations are responding to the sandeel population size across the whole of SA4, and that the sandeel box has been only partially successful at mitigating the impacts of the fishery on seabird populations. Finally, the presence of strong relationships between each of adult population size, return rates and productivity and TSB in SA4 showed that the population is responding to changes at this spatial scale. It seems likely, therefore, that this scale is important to seabirds breeding on the Isle of May. This may be because of the importance of areas beyond typical foraging range in poor sandeel years and in the periods of the annual cycle outside the breeding season.
- The current management of sandeel stocks in SA4 does not account for the presence of the box. So sandeel TAC is based on the TSB in all of SA4, not just the stock outside the box. Given the sedentary nature of individual sandeels, this suggests that impacts on sandeel stocks outside the box could be particularly severe., These areas may be important to seabirds during periods of the annual cycle not assessed through tracking during the early chick phase.
- Thus, reducing or removing fishing pressure across the whole of SA4 is very likely the most effective measure to compensate for predicted impacts. The level of compensation that could potentially be achieved through reducing or removing fishing pressure was then explored.
- Likely gains to the SPA populations of kittiwake, guillemot, razorbill, and puffin predicted to be impacted by the proposed development varied across five compensation scenarios. The scenario that produced the smallest benefit to SPA populations was the change in sandeel TSB from 300,000 to 400,000 tonnes. This worst-case benefit to sandeels from reducing or removing fishing pressure was therefore compared with the predicted impacts, including the worst-case impact scenario.
- The ability of the proposed compensation measures, reducing or removing fishing pressure in SA4, was tested using relationships between sandeel TSB in SA4 and adult return rate (as a proxy for adult survival) or productivity. The positive effects of predicted changes in demographic parameters were compared with the negative effects of three predicted impact scenarios from the Proposed Development alone.
- For all species and all SPAs, it was clear that the predicted minimum benefit from reducing or removing fishing pressure in SA4 was sufficient to compensate for all predicted impact scenarios, including the worst-case scenario.
- These analyses have demonstrated that reducing or removing fishing pressure in the remaining area of SA4 outside the sandeel box would provide more than sufficient compensation for the predicted impacts from the Proposed Development. There was sufficient strength in the evidence used to support this assessment, combined with the comparison of a worst-case benefits with worst case predicted impacts, to be sufficiently certain that the proposed sandeel fisheries compensatory measure will ensure the coherence of the UK SPA network.
1.12. References and Citations
1.12. References and Citations
Abesamis, R.A. and Russ, G.R. 2005. Density-dependent spillover from a marine reserve: long-term evidence. Ecological Applications, 15, 1798-1812.
Adams, N.J., Seddon, P.J., van Heezik, Y.M. 1992. Monitoring of seabirds in the Benguela upwelling system: can seabirds be used as indicators and predictors of change in the marine environment? South African Journal of Marine Science, 12, 959–974.
Alos, J., Puiggros, A., Diaz-Gil, C., Palmer, M., Rossello, R. and Arlinghaus, R. 2015. Empirical evidence for species-specific export of fish naivete from a no-take marine protected area in a coastal recreational hook and line fishery. pLoS ONE, 10, e0135348.
Arias-Del-Razo, A., Schramm, Y., Heckel, G., Saenz-Arroyo, A., Hernandez, A., Vazquez, L. and Carillo-Munoz, A.I. 2019. Do marine reserves increase prey for California sea lions and Pacific harbor seals? pLoS ONE, 14, e0218651.
Arnott, S.A. and Ruxton, G.D. 2002. Sandeel recruitment in the North Sea: demographic, climatic and trophic effects. Marine Ecology Progress Series 238: 199-210.
Auster, P.J., Malatesta, R.J., Langton, R.W., Watting, L., Valentine, P.C., Donaldson, C.L.S., Langton, E.W., Shepard, A.N. and Babb, W.G. 1996. The impacts of mobile fishing gear on seafloor habitats in the Gulf of Maine (Northwest Atlantic): implications for conservation of fish populations. Reviews in Fisheries Science 4: 185-202.
Auster, P.J. and Langton, R.W. 1999. The effects of fishing on fish habitat. Pp. 150-187 in Benaka, L. (Ed.) Fish habitat: essential fish habitat and rehabilitation. American Fisheries Society, Bethesda.
Ballantyne, B. 2014. Fifty years on: lessons from marine reserves in New Zealand and principles for a worldwide network. Biological Conservation, 176, 297-307.
Bedford, J., Ostle, C., Johns, D.G., Atkinson, A., Best, M., Bresnan, E., Machairopoulou, M., Graves, C.A., Devlin, M., Milligan, A., Pitois, S., Mellor, A., Tett, P. and McQuatters-Gollop, A. 2020. Lifeform indicators reveal large-scale shifts in plankton across the north-west European shelf. Global Change Biology 26: 3482-3497.
Behrens, J.W., Aertebjerg, G., Petersen, J.K. and Carstensen, J. 2009. Oxygen deficiency impacts on burying habitats for lesser sandeel, Ammodytes tobianus, in the inner Danish waters. Canadian Journal of Fisheries and Aquatic Sciences 66: 883-895.
Bertrand, S., Joo, R., Smet, C.A., Tremblay, Y., Barbraud, C. and Weimerskirch, H. 2012. Local depletion by a fishery can affect seabird foraging. Journal of Applied Ecology, 49, 1168-1177.
Boersma, P.D., Garcia Borboroglu, P., Gownaris, N.J., Bost, C.A., Chiaradia, A., Ellis, S., Schneider, T., Seddon, P.J., Simeone, A., Trathan, P.N., Waller, L.J. and Wienecke, B. 2020. Applying science to pressing conservation needs for penguins. Conservation Biology, 34, 103-112.
Boulcott, P., Stirling, D., Clarke, J. and Wright, P.J. 2018. Estimating fishery effects in a marine protected area: Lamlash Bay. Aquatic Conservation: Marine and Freshwater Ecosystems, 28, 840-849.
Bradshaw, C., Veale, L.O., Hill, A.S. and Brand, A.R. 2001. The effect of scallop dredging on Irish Sea benthos: experiments using a closed area. Hydrobiologia 465: 129-138.
Bradshaw, C., Veale, L.O. and Brand, A.R. 2002. The role of scallop-dredge disturbance in long-term changes in Irish Sea benthic communities: a re-analysis of an historical dataset. Journal of Sea Research 47: 161-184.
Buxton, C.D. and Smale, M.J. 1989. Abundance and distribution patterns of three temperate marine reef fish (Teleostei: Sparidae) in exploited and unexploited areas off the southern Cape coast. Journal of Applied Ecology, 26, 441-451.
Buxton, C.D., Hartmann, K., Kearney, R. and Gardner, C. 2014. When is spillover from marine reserves likely to benefit fisheries? pLoS ONE, 9, e107032.
Cabral, R.B., Bradley, D., Mayorga, J., Goodell, W., Friedlander, A.M., Sala, E., Costello, C. and Gaines, S.D. 2020. A global network of marine protected areas for food. Proceedings of the National Academy of Sciences of the United States of America, 117, 28134-28139.
Campbell, K.J., Steinfurth, A., Underhill, L.G., Coetzee, J.C., Dyer, B.M., Ludynia, K., Makhado, A.B., Merkle, D., Rademan, J., Upfold, L. and Sherley, R.B. 2019. Local forage fish abundance influences foraging effort and offspring condition in an endangered marine predator. Journal of Applied Ecology, 56, 1751-1760.
Campbell, S.J., Edgar, G.J., Stuart-Smith, R.D., Soler, G. and Bates, A.E. 2018. Fishing-gear restrictions and biomass gains for coral reef fishes in marine protected areas. Conservation Biology, 32, 401-410.
Camphusen, C.J. 2002. Post-fledging dispersal of Common Guillemots Uria aalge guarding chicks in the North Sea: The effect of predator presence and prey availability at sea. Ardea 90: 103-119.
Cappell, R., Robinson, M., Gascoigne, J. and Nimmo, F. 2013. A review of the Scottish scallop fishery. Poseidon report to Marine Scotland. Poseidon Aquatic Resource Management Ltd., Hampshire.
Cappell, R., Huntington, T., Nimmo, F. and MacNab, S. 2018. The UK scallop fishery: current trends, future management options and recommendations. Poseidon report to South West Fish Producer Organisation Ltd. Report Ref. 1417-GBR. Poseidon Aquatic Resource Management Ltd., Hampshire.
Carroll, M.J., Bolton, M., Owen, E., Anderson, G.Q.A., Mackley, E.K., Dunn, E.K. and Furness, R.W. 2017. Kittiwake breeding success in the southern North Sea correlates with prior sandeel fishing mortality. Aquatic Conservation: Marine and Freshwater Ecosystems, 27, 1164-1175.
Chen, W., Staneva, J., Grayek, S., Schulz-Stellenfleth, J. and Greinert, J. 2022. The role of heat wave events in the occurrence and persistence of thermal stratification in the southern North Sea. Natural Hazards and Earth System Science 22: 1683-1698.
Cheung, W.W.L. and Pauly, D. 2016. Impacts and effects of ocean warming on marine fishes. pp. 239-253. In Laffoley, D. and Baxter, J.M. (eds.) Explaining ocean warming: causes, scale, effects and consequences. IUCN, Gland.
Church, N.J., Carter, A.J., Tobin, D., Edwards, D., Eassom, A., Cameron, A., Johnson, G.E., Robson, L.M. and Webb, K.E. 2016. JNCC Pressure Mapping Methodology Physical Damage (Reversible Change) – Penetration and/or disturbance of the substrate below the surface of the seabed, including abrasion. JNCC Report No. 515. JNCC, Peterborough.
Clairbaux, M., Cheung, W.W.L., Mathewson, P., Porter, W., Courbin, N., Fort, J., Strøm, H., Moe, B., Fauchald, P. et al. 2021. Meeting Paris agreement objectives will temper seabird winter distribution shifts in the North Atlantic Ocean. Global Change Biology, doi: 10.1111/gcb.15497.
Cleasby, I.R., Owen, E., Wilson, L., Wakefield, E.D., O’Connell, P. and Bolton, M. 2020. Identifying important at-sea areas for seabirds using species distribution models and hotspot mapping. Biological Conservation, 241, 108375.
Cohen, P.J. and Alexander, T.J. 2013. Catch rates, composition and fish size from reefs managed with periodically-harvested closures. pLoS ONE, 8, e73383.
Collie, J.S. and Escanero, G.A. 2000. Photographic evaluation of the impacts of bottom fishing on benthic epifauna. ICES Journal of Marine Science 57: 987-1001.
Collie, J.S., Escanero, G.A. and Valentine, P.C. 1997. Effects of bottom fishing on the benthic megafauna of Georges Bank. Marine Ecology Progress Series 155: 159-172.
Coulson, J.C. and Coulson, B.A., 2008. Measuring immigration and philopatry in seabirds; recruitment to Black‐legged Kittiwake colonies. Ibis, 150: 288-299.
Cowley, P.D., Brouwer, S.L. and Tilney, R.L. 2002. The role of the Tsitsikamma National Park in the management of four shore-angling fish along the south-eastern Cape coast of South Africa. South African Journal of Marine Science, 24, 27-35.
Crawford, R.J.M. 1998. Responses of African penguins to regime changes of sardine and anchovy in the Benguela system. South African Journal of Marine Science, 19, 355–364.
Crawford, R.J.M., Shannon, L.J., Whittington, P.A. 1999. Population dynamics of the African penguin Spheniscus demersus at Robben Island, South Africa. Marine Ornithology, 27, 139–147.
Crawford, R.J.M., Barham, P.J., Underhill, L.G., Shannon, L.J., Coetzee, J.C., Dyer, B.M., Leshoro, T.M. and Upfold, L. 2006. The influence of food availability on breeding success of African penguins Spheniscus demersus at Robben Island, South Africa. Biological Conservation, 132, 119-125.
Crawford, R.J.M., Sydeman, W.J., Thompson, S.A., Sherley, R.B. and Makhado, A.B. 2019. Food habits of an endangered seabird indicate recent poor forage fish availability off western South Africa. ICES Journal of Marine Science, 76, 1344-1352.
Critchley, E.J., Grecian, W.J., Bennison, A., Kane, A., Wischnewski, S., Canadas, A., Tierney, D., Quinn, J.L. and Jessopp, M.J. 2019. Assessing the effectiveness of foraging radius models for seabird distributions using biotelemetry and survey data. Ecography, 43, 184-196.
Cury, P.M., Boyd, I.L., Bonhommeau, S., Anker-Nilssen, T., Crawford, R.J.M., Furness, R.W., Mills, J.A., Murphy, E.J., Österblom, H., Paleczny, M., Piatt, J.F., Roux, J-P., Shannon, L. and Sydeman, W.J. 2011. Global seabird response to forage fish depletion – one-third for the birds. Science, 334, 1703-1706.
Dahood, A., de Mutsert, K. and Watters, G.M. 2020. Evaluating Antarctic marine protected area scenarios using a dynamic food web model. Biological Conservation, 251, 108766.
Daunt, F., Fang, Z., Howells, R., Harris, M., Wanless, S., Searle, K. and Elston, D. 2020. Improving estimates of seabird body mass survival relationships. Scottish Marine and Freshwater Science 11: 13, DOI: 10.7489/12329-1
Daunt, F., Wanless, S., Greenstreet, S. P. R., Jensen, H., Hamer, K. C., and Harris, M. P. 2008. The impact of the sandeel fishery closure on seabird food consumption, distribution, and productivity in the northwestern North Sea. Canadian Journal of Fisheries and Aquatic Sciences, 65, 362-381.
Davis, S.E., Nager, R.G. and Furness, R.W. 2005. Food availability affects adult survival as well as breeding success of parasitic jaegers. Ecology, 86, 1047-1056.
Dayton, P.K., Thrush, S.F., Agardy, M.T. and Hofman, R.J. 1995. Environmental effects of marine fishing. Aquatic Conservation: Marine and Freshwater Ecosystems 5: 205-232.
Di Lorenzo, M., Claudet, J. and Guidetti, P. 2016. Spillover from marine protected areas to adjacent fisheries has an ecological and a fishery component. Journal for Nature Conservation, 32, 62-66.
Di Lorenzo, M., Guidetti, P., Franco, A., Calo, A. and Claudet, J. 2020. Assessing spillover from marine protected areas and its drivers: a meta-analytical approach. Fish and Fisheries, 21, 906-915.
DTA Ecology. 2021. Framework to evaluate ornithological compensatory measures for offshore wind: process guidance note for developers. Advice to Marine Scotland. Doc. Ref. 1107 Marine Scotland CM framework.
Dunn, E. 2021. Revive our Seas: The case for stronger regulation of sandeel fisheries in UK waters. RSPB, Sandy
Edgar, G.J., Stuart-Smith, R.D., Willis, T.J., Kininmonth, S., Baker, S.C., Banks, S., Barrett, N.S., Becerro, M.A., Bernard, A.T.F., Berkhout, J., Buxton, C.D., Campbell, S. J., Cooper, A.T., Davey, M., Edgar, S.C. et al. 2014. Global conservation outcomes depend on marine protected areas with five key features. Nature, 506, 216–220.
Eleftheriou, A. and Robertson, M.R. 1992. The effects of experimental scallop dredging on the fauna and physical environment of a shallow sandy community. Netherlands Journal of Sea Research 30: 289-299.
Elliott, K.H., Woo, K.J., Gaston, A.J., Benvenuti, S., Dall'Antonia, L. and Davoren, G.K., 2009. Central-place foraging in an Arctic seabird provides evidence for Storer-Ashmole's halo. The Auk, 126: 613-625.
Enever, R., Doherty, P.D., Ashworth, J., Duffy, M., Kibel, P., Parker, M., Stewart, B.D. and Godley, B.J., 2022. Scallop potting with lights: A novel, low impact method for catching European king scallop (Pecten maximus). Fisheries Research, 252 https://doi.org/10.1016/j.fishres.2022.106334.
Engelhard, G.H., Peck, M.A., Rindorf, A., Smout, S.C., van Deurs, M., Raab, K., Andersen, K.H., Garthe, S., Lauerburg, R.A.M., Scott, F., Brunel, T., Aarts, G., van Kooten, T. and Dickey-Collas, M. 2014. Forage fish, their fisheries, and their predators: who drives whom? ICES Journal of Marine Science, 71, 90-104.
European Commission. 2012. Guidance document on Article 6(4) of the 'Habitats Directive' 92/43/EEC: clarification of the concepts of: alternative solutions, imperative reasons of overriding public interest, compensatory measures, overall coherence, opinion of the commission. https://ec.europa.eu/environment/nature/natura2000/management/docs/art6/new_guidance_art6_4_en.pdf
Fayet, A.L., Clucas, G.V., Anker‐Nilssen, T., Syposz, M. and Hansen, E.S., 2021. Local prey shortages drive foraging costs and breeding success in a declining seabird, the Atlantic puffin. Journal of Animal Ecology 90:1152-1164.
Fernandez-Chacon, A., Villegas-Rios, D., Moland, E., Baskett, M.L., Olsen, E.M. and Carlson, S.M. 2020. Protected areas buffer against harvest selection and rebuild phenotypic complexity. Ecological Applications, 30, e02108.
Florin, A.B., Bergström, U., Ustups, D., Lundström, K. and Jonsson, P.R. 2013. Effects of a large northern European no-take zone on flatfish populations. Journal of Fish Biology, 83, 939–962.
Frederiksen, M., Wanless, S., Harris, M.P., Rothery, P. and Wilson, L.J. 2004. The role of industrial fisheries and oceanographic change in the decline of North Sea black-legged kittiwakes. Journal of Applied Ecology, 41, 1129-1139.
Frederiksen, M., Wright, P.J., Harris, M.P., Mavor, R.A., Heubeck, M. & Wanless, S. 2005. Regional patterns of kittiwake Rissa tridactyla breeding success are related to variability in sandeel recruitment. Marine Ecology Progress Series, 300, 201-211.
Frederiksen, M., Edwards, M., Richardson, A. J., Halliday, N. C., and Wanless, S. 2006. From plankton to top predators: bottom-up control of a marine food web across four trophic levels. Journal of Animal Ecology, 75, 1259-1268.
Frederiksen, M., Edwards, M., Mavor, R. A., and Wanless, S. 2007b. Regional and annual variation in black-legged kittiwake breeding productivity is related to sea surface temperature. Marine Ecology Progress Series, 350, 137-143.
Frederiksen, M., Furness, R.W. and Wanless, S. 2007a. Regional variation in the role of bottom-up and top-down processes in controlling sandeel abundance in the North Sea. Marine Ecology Progress Series, 337, 279-286.
Frederiksen, M., Daunt, F., Harris, M.P. and Wanless, S. 2008a. The demographic impact of extreme events: stochastic weather drives survival and population dynamics in a long-lived seabird. Journal of Animal Ecology, 77, 1020-1029.
Frederiksen, M., Jensen, H., Duant, F., Mavor, R.A. and Wanless, S. 2008b. Differential effects of a local industrial sand lance fishery on seabird breeding performance. Ecological Applications, 18, 701–710.
Funakoshi, S. 1998. Studies on the mechanisms behind the species replacement between sardine and anchovy populations and the ecology of sandeel for the management of fishery resources. Bulletin of the Japanese Society of Fisheries Oceanography 62: 218-234.
Furness, R.W. 2007. Responses of seabirds to depletion of food fish stocks. Journal of Ornithology, 148, 247–252.
Furness, R.W. and Tasker, M.L. 2000. Seabird-fishery interactions: quantifying the sensitivity of seabirds to reductions in sandeel abundance, and identification of key areas for sensitive seabirds in the North Sea. Marine Ecology Progress Series, 202, 253–264.
Gao, S., Hjøllo, S.S., Falkenhaug, T., Strand, E., Edwards, M. and Skogen, M.D. 2021. Overwintering distribution, inflow patterns and sustainability of Calanus finmarchicus in the North Sea. Progress in Oceanography 194: 102567.
Garcia-Rubies, A., Hereu, B. and Zabala, M. 2013. Long-term recovery patterns and limited spillover of large predatory fish in a Mediterranean MPA. pLoS ONE, 8, e73922.
Gaspar, C., Giménez, J., Andonegi, E., Astarloa, A., Chouvelon, T., Franco, J., Goñi, N., Corrales, X., Spitz, J., Bustamente, P. and Louzao, M. 2022. Trophic ecology of northern gannets Morus bassanus highlights the extent of isotopic niche overlap with other apex predators within the Bay of Biscay. Marine Biology 169: 105.
Gell, F.R. and Roberts, C.M. 2003. Benefits beyond boundaries: the fishery effects of marine reserves. Trends in Ecology and Evolution, 18, 448-455.
Giakoumi, S., McGowan, J., Mills, M., Beger, M., Bustamante, R.H., Charles, A., Christie, P., Fox, M., Garcia-Borboroglu, P., Gelcich, S., Guidetti, P., Mackelworth, P., Maina, J.M., McCook, L., Micheli, F., Morgan, L.E., Mumby, P.J., Reyes, L.M., White, A., Grorud-Colvert, K. and Possingham, H.P. 2018. Revisiting “success” and “failure” of marine protected areas: A conservation scientist perspective. Frontiers in Marine Science, 5, 223.
Goni, R., Adlerstein, S., Alvarez-Berastegui, D., Forcada, A., Renones, O., Criquet, G., Polti, S., Cadiou, G., Valle, C., Lenfant, P., Bonhomme, P., Perez-Ruzafa, A., Sanchez-Lizaso, J.L., Garcia-Charton, J.A., Bernard, G., Stelzenmuller, V. and Planes, S. 2008. Spillover from six western Mediterranean marine protected areas: evidence from artisanal fisheries. Marine Ecology Progress Series, 366, 159-174.
Goni, R., Hilborn, R., Diaz, D., Mallol, S. and Adlerstein, S. 2010. Net contribution of spillover from a marine reserve to fishery catches. Marine Ecology Progress Series, 400, 233-243.
Greenstreet, S., Fraser, H., Armstrong, E. and Gibb, I. 2010. Monitoring the consequences of the northwestern North Sea sandeel fishery closure. Scottish Marine and Freshwater Science, 1, 1–31.
Hall-Spencer, J.M. and Moore, P.G. 2000. Impact of scallop dredging on maerl grounds. P 10-5-118 in Kaiser, M.J. and De Groot, S.J. (Eds). Effects of fishing on non-target species and habitats: biological, conservation and socio-economic issues. Blackwell, Oxford.
Halouani, G., Villanueva, C.M., Raoux, A., Dauvin, J.C., Lasram, F.B., Foucher, E., Le Loc’h, F., Safi, G., Araignous, E., Robin, J.P. and Niquil, N. 2020. A spatial food web model to investigate potential spillover effects of a fishery closure in an offshore wind farm. Journal of Marine Systems, 212, 103434.
Handley, J.M., Pearmain, E.J., Oppel, S., Carneiro, A.P.B., Hazin, C., Phillips, R.A. et al. 2020. Evaluating the effectiveness of a large multi-use MPA in protecting key biodiversity areas for marine predators. Diversity and Distributions, 26, 715-729.
Harmelin-Vivien, M., Le Direach, L., Bayle-Sempere, J., Charbonnel, E., Garcia-Charton, J.A., Ody, D., Perez-Ruzafa, A., Renones, O., Sanchez-Jerez, P. and Valle, C. 2008. Gradients of abundance and biomass across reserve boundaries in six Mediterranean marine protected areas: evidence of fish spillover? Biological Conservation, 141, 1829-1839.
Harris, M.P., Bogdanova, M.I., Daunt, F. and Wanless, S., 2012. Using GPS technology to assess feeding areas of Atlantic Puffins Fratercula arctica. Ringing & Migration 27:43-49.
Hays, G.C., Koldewey, H.J., Andrzejaczek, S., Attrill, M.J., Barley, S., Bayley, D.T.I., Benkwitt, C.E., Block, B., Schallert, R.J., Carlisle, A.B. et al. 2020. A review of a decade of lessons from one of the world’s largest MPAs: conservation gains and key challenges. Marine Biology, 167, 159.
Heerah, K., Dias, M.P., Delord, K., Oppel, S., Barbraud, C., Weimerskirch, H. and Bost, C.A. 2019. Important areas and conservation sites for a community of globally threatened marine predators of the southern Indian Ocean. Biological Conservation, 234, 192-201.
Heessen, H.J.L., Daan, N. and Ellis, J.R. 2015. Fish Atlas of the Celtic Sea, North Sea, and Baltic Sea. KNNV Publishing, The Netherlands.
Henriksen, O., Christensen, A., Jonasdottir, S., MacKenzie, B.R., Nielsen, K.E., Mosegaard, H. and van Deurs, M. 2018. Oceanographic flow regime and fish recruitment: reversed circulation in the North Sea coincides with unusually strong sandeel recruitment. Marine Ecology Progress Series 607: 187-205.
Henriksen, O., Rindorf, A., Brooks, M.E., Lindegren, M. and van Deurs, M. 2021a. Temperature and body size affect recruitment and survival of sandeel across the North Sea. ICES Journal of Marine Science 78: 1409-1420.
Henriksen, O., Rindorf, A., Mosegaard, H. and van Deurs, M. 2021b. Get up early: Revealing behavioral responses of sandeel to ocean warming using commercial catch data. Ecology and Evolution 11: 16786-16805.
Hentati-Sundberg, J., Olin, A.B., Evans, T.J., Isaksson, N., Berglund, P-A. and Olsson, O. 2020. A mechanistic framework to inform the spatial management of conflicting fisheries and top predators. Journal of Applied Ecology, 10.1111/1365-2664.13759
Hill, S.L., Hinke, J., Bertrand, S., Fritz, L., Furness, R.W., Ianelli, J.N., Murphy, M., Oliveros-Ramos, R., Pichegru, L., Sharp, R., Stillman, R.A., Wright, P.J. and Ratcliffe, N. 2020. Reference points for predators will progress ecosystem-based management of fisheries. Fish and Fisheries, 21, 368-378.
Hoskin, M. G., Coleman, R. A., von Carlshausen, E. and Davis, C. M. 2011. Variable population responses by large decapod crustaceans to the establishment of a temperate marine no‐take zone. Canadian Journal of Fisheries and Aquatic Sciences, 68, 185–200.
Howarth, L.M., Wood, H.L., Turner, A.P. and Beukers-Stewart, B.D. 2011. Complex habitat boosts scallop recruitment in a fully protected marine reserve. Marine Biology, 158, 1767-1780.
Howarth, L.M. and Stewart, B.D. 2014. The dredge fishery for scallops in the United Kingdom (UK): effects on marine ecosystems and proposals for future management. Marine Ecosystem Management Report No. 5. University of York, York.s.whiterose.ac.uk/79233/
Huserbråten, M.B.O., Moland, E., Knutsen, H., Olsen, E.M., Andre, C. and Stenseth, N.C. 2013. Conservation, spillover and gene flow within a network of northern European marine protected areas. pLoS ONE, 8, e73388.
ICES. 2021. ICES Advice on fishing opportunities, catch, and effort. Greater North Sea ecoregion: Sandeel (Ammodytes spp.) in divisions 4.a–b, Sandeel Area 4 (northern and central North Sea). https://www.ices.dk/sites/pub/Publication%20Reports/Advice/2021/2021/san.sa.4.pdf
ICES. 2021b. Working Group on Multispecies Assessment Methods (WGSAM; outputs from 2020 meeting). ICES Scientific Reports. 3:10. 231 pp. https://doi.org/10.17895/ices.pub.7695
ICES. 2022. Herring Assessment Working Group for the area south of 62oN (HAWG). 4:16.
ICES 2017. OSPAR request on the production of spatial layers of fishing intensity/pressure. ICES Technical Service sr.2017.17 (Version 2: 22 January 2019) https://doi.org/10.17895/ices.advice.4683
ICES 2017b. Report of the Benchmark on Sandeel (WKSand 2016), 31 October – 4 November 2016, Bergen, Norway. ICES CM 2016/ACOM:33.
Ito, M., Takahashi, A., Kokubun, N., Kitaysky, A.S. and Watanuki, Y., 2010. Foraging behavior of incubating and chick-rearing thick-billed murres Uria lomvia. Aquatic Biology 8: 279-287.
Jaco, E.M. and Steele, M.A. 2019. Pre-closure fishing pressure predicts effects of marine protected areas. Journal of Applied Ecology, 57, 229-240.
Jennings, S. and Kaiser, M.J. 1998. The effects of fishing on marine ecosystems. Advances in Marine Biology 34: 201-352.
JNCC 2020. Statements on conservation benefits, condition and conservation measures for Firth of Forth Banks complex nature conservation MPA. https://jncc.gov.uk
Jouventin, P., Capdeville, D., Cuenot-Chaillet, F. and Boiteau, C. 1994. Exploitation of pelagic resources by a non-flying seabird: satellite tracking of the king penguin throughout the breeding cycle. Marine Ecology Progress Series 106: 11-19.
Kaiser, M.J., Hill, A.S., Ramsay, K., Spencer, B.E., Brand, A.R., Veale, L.O., Prudden, K., Rees, E.I.S., Munday, B.W., Ball, B. and Hawkins, S.J. 1996. Benthic disturbance by fishing gear in the Irish Sea: a comparison of beam trawling and scallop dredging. Aquatic Conservation: Marine and Freshwater Ecosystems 6: 269-285.
Kelaher, B.P., Tan, M., Figueira, W.F., Gillanders, B.M., Connell, S.D., Goldsworthy, S.D., Hardy, N. and Coleman, M.A. 2015. Fur seal activity moderates the effects of an Australian marine sanctuary on temperate reef fish. Biological Conservation, 182, 205-214.
Kerwath, S.E., Winkler, H., Götz, A. and Attwood, C.G. 2013. Marine protected area improves yield without disadvantaging fishers. Nature Communications, 4, 2347.
Kirkman, S.P., Yemane, D.G., Lamont, T., Meyer, M.A. and Pistorius, P.A. 2016. Foraging behavior of Subantarctic fur seals supports efficiency of a marine reserve’s design. pLoS ONE, 11, e0152370.
Kleiven, P.J.N., Espeland, S.H., Olsen, E.M., Abesamis, R.A., Moland, E. and Kleiven, A.R. 2019. Fishing pressure impacts the abundance gradient of European lobsters across the borders of a newly established marine protected area. Proceedings of the Royal Society B, 286, 20182455.
Kough, A.S., Belak, C.A., Paris, C.B., Lundy, A., Cronin, H., Gnanalingham, G., Hagedorn, S., Skubel, R., Weiler, A.C. and Stoner, A.W. 2019. Ecological spillover from a marine protected area replenishes over-exploited population across an island chain. Conservation Science and Practice, 1, e17.
Laffoley, D. and Baxter, J.M. (eds.) Explaining ocean warming: causes, scale, effects and consequences. IUCN, Gland.
Lambert, G.I., Murray, L.G., Hiddink, J.G., Hinz, H., Lincoln, H., Hold, N., Cambie, G. and Kaiser, M.J. 2017. Defining thresholds of sustainable impact on benthic communities in relation to fishing disturbance. Scientific Reports 7: 5440.
Lane, J.V., Jeavons, R., Deakin, Z., Sherley, R.B., Pollock, C.J., Wanless, R.J. and Hamer, K.C. 2020. Vulnerability of northern gannets to offshore wind farms; seasonal and sex-specific collision risk and demographic consequences. Marine Environmental Research 162: 105196.
Langton, R.W. and Robinson, W.E. 1990. Faunal associations on scallop grounds in the western Gulf of Maine. Journal of Experimental Marine Biology and Ecology 144: 157-171.
Langton, R., Boulcott, P. and Wright, P. 2021. A verified distribution model for the lesser sandeel Ammodytes marinus. Marine Ecology Progress Series 667: 145-159.
Lascelles, B.G., Langham, G.M., Ronconi, R.A. and Reid, J.B. 2012. From hotspots to site protection: identifying marine protected areas for seabirds around the globe. Biological Conservation, 156, 5-14.
Lavers, J.L., Jones, I.L. and Diamond, A.W., 2007. Natal and breeding dispersal of Razorbills (Alca torda) in eastern North America. Waterbirds: 588-594.
LeBlanc, S.N., Benoit, H.P. and Hunt, H.L. 2015. Broad-scale abundance changes are more prevalent than acute fishing impacts in an experimental study of scallop dredging intensity. Fisheries Research 161: 8-20.
Lindegren, M., van Deurs, M., MacKenzie, B.R., Clausen, L.W., Christensen, A. and Rindorf, A. 2018. Productivity and recovery of forage fish under climate change and fishing: North Sea sandeel as a case study. Fisheries Oceanography, 27, 212-221.
Lombard, A.T., Durbach, I., Harris, J.M., Mann-Lang, J., Mann, B.Q., Branch, G.M. and Attwood, C.G. 2020. South Africa’s Tsitsikamma marine protected area – winners and losers. pp. 237-270 in Humphreys, J. and Clark, R.W.E. (eds.) Marine Protected Areas: Science, Policy and Management. Elsevier, Oxford.
Ludynia, K., Kemper, J. and Roux, J-P. 2012. The Namibian islands’ marine protected area: using seabird tracking data to define boundaries and assess their adequacy. Biological Conservation, 156, 136-145.
Ludynia, K., Waller, L.J., Sherley, R.B., Abadi, F., Galada, Y., Geldenhuys, D., Crawford, R.J.M., Shannon, L.J. and Jarre, A. 2014. Processes influencing the population dynamics and conservation of African penguins on Dyer Island, South Africa. African Journal of Marine Science, 36, 253-267.
MacDonald, A., Speirs, D.C., Greenstreet, S.P.R., Boulcott, P. and Heath, M.R. 2019. Trends in sandeel growth and abundance off the east coast of Scotland. Frontiers in Marine Science 6: 201.
MacNeil, M.A., Graham, N.A.J., Cinner, J.E., Wilson, S.K., Williams, I.D., Maina, J., Newman, S., Friedlander, A.M., Jupiter, S., Polunin, N.V.C. and McClanahan, T.R. 2015. Recovery potential of the world’s coral reef fishes. Nature, 520, 341-344.
McClanahan, T.R. and Mangi, S. 2000. Spillover of exploitable fishes from a marine park and its effect on the adjacent fishery. Ecological Applications, 10, 1792-1805.
McClanahan, T.R., Graham, N.A.J., MacNeil, M.A. and Cinner, J.E. 2014. Biomass-based targets and the management of multispecies coral reef fisheries. Conservation Biology, 29, 409-417.
McInnes, A.M., Ryan, P.G., Lacerda, M., Deshaves, J., Goschen, W.S. and Pichegru, L. 2017. Small pelagic fish responses to fine-scale oceanographic conditions: implications for the endangered African penguin. Marine Ecology Progress Series, 569, 187-203.
McInnes, A.M., Ryan, P.G., Lacerda, M. and Pichegru, L. 2019. Targeted prey fields determine foraging effort thresholds of a marine diver: important cues for the sustainable management of fisheries. Journal of Applied Ecology, 56, 2206-2215.
Malcolm, H.A., Williams, J., Schultz, A.L., Neilson, J., Johnstone, N., Knott, N.A., Harasti, D., Coleman, M.A. and Jordan, A. 2018. Targeted fishes are larger and more abundant in ‘no-take’ areas in a subtropical marine park. Estuarine, Coastal and Shelf Science, 212, 118-127.
Marine Scotland 2019. Sandeels (Ammodytes marinus and A. tobianus). Draft Advice Scottish MPAs and fisheries. Version 1.4. Marine Scotland, Edinburgh.
Marine Scotland 2016. Scottish Sea Fisheries Employment 2015. Marine Scotland, Edinburgh.
Marshall, D.J., Gaines, S., Warner, R., Barneche, D.R. and Bode, M. 2019. Underestimating the benefits of marine protected areas for the replenishment of fished populations. Frontiers in Ecology and Environment, 17, 407-413.
Murawski, S.A. 2010. Rebuilding depleted fish stocks: the good, the bad, and, mostly, the ugly. ICES Journal of Marine Science 67: 1830-1840.
NOAA (National Oceanic and Atmospheric Administration). 2021. NOAA Merged Land Ocean Global Surface Temperature Analysis (NOAAGlobalTemp). https://www.ncei.noaa.gov/products/land-based-station/noaa-global-temp
O’Brien, S.H., Webb, A., Brewer, M.J. and Reid, J.B. 2012. Use of kernel density estimation and maximum curvature to set marine protected area boundaries: identifying a Special Protection Area for wintering red-throated divers in the UK. Biological Conservation, 156, 15-21.
O’Leary, B.C., Brown, R.L., Johnson, D.E., von Nordheim, H., Ardron, J., Packeiser, T. and Roberts, C.M. 2012. The first network of marine protected areas (MPAs) in the high seas: the process, the challenges and where next. Marine Policy, 36, 598-605.
O’Neill, F.G., Robertson, M., Summerbell, K., Breen, M. and Robinson, L.A. 2013. The mobilisation of sediment and benthic infauna by scallop dredges. Marine Environmental Research 90: 104-112.
Olin, A.B., Banas, N.S., Johns, D.G., Heath, M.R., Wright, P.J. and Nager, R.G. 2022. Spatio-temporal variation in the zooplankton prey of lesser Sandeels: species and community trait patterns from the continuous plankton recorder. ICES Journal of Marine Science 79: 1649-1661.
Olin, A.B., Banas, N.S., Wright, P.J., Heath, M.R. and Nager, R.G. 2020. Spatial synchrony of breeding success in the black-legged kittiwake Rissa tridactyla reflects the spatial dynamics of its sandeel prey. Marine Ecology Progress Series, 638, 177-190.
Oppel, S., Bolton, M., Carneiro, A.P., Dias, M.P., Green, J.A., Masello, J.F., Phillips, R.A., Owen, E., Quillfeldt, P., Beard, A. and Bertrand, S., 2018. Spatial scales of marine conservation management for breeding seabirds. Marine Policy 98: 37-46.
Oro, D. and Furness, R.W. 2002. Influences of food availability and predation on survival of kittiwakes. Ecology, 83, 2516-2528.
Osborne, O.E., Hara, P.D., Whelan, S., Zandbergen, P., Hatch, S.A. and Elliott, K.H. 2020. Breeding seabirds increase foraging range in response to an extreme marine heatwave. Marine Ecology Progress Series, 646: 161-173.
Parsons, D.M., Babcock, R.C., Hankin, R.K.S., Willis, T.J., Aitken, J.P., O’Dor, R.K. and Jackson, G.D. 2003. Snapper Pagrus auratus (Sparidae) home range dynamics: acoustic tagging studies in a marine reserve. Marine Ecology Progress Series, 262, 253-265.
Parsons, D.M., Shears, N.T., Babcock, R.C. and Haggitt, T.R. 2004. Fine-scale habitat change in a marine reserve, mapped using radio-acoustically positioned video transects. Marine and Freshwater Research, 55, 257-265.
Peron, C., Gremillet, D., Prudor, A., Pettex, E., Saraux, C., Soriano-Redondo, A., Authier, M. and Fort, J. 2013. Importance of coastal marine protected areas for the conservation of pelagic seabirds: the case of vulnerable yelkouan shearwaters in the Mediterranean Sea. Biological Conservation, 168, 210-221.
Perrow, M.R., Harwood, A.J.P., Skeate, E.R., Praca, E. and Eglington, S.M. 2015. Use of multiple data sources and analytical approaches to derive a marine protected area for a breeding seabird. Biological Conservation, 191, 729-738.
Petitgas, P., Alheit, J., Peck, A., Raab, K.E., Irijoien, X., Huret, J., van Kooij, J., Pohlmann, T., Wagner, C., Zarraonaindia, I. and Dickey-Collas, M. 2012. Anchovy population expansion in the North Sea. Marine Ecology Progress Series 444: 1-13.
Pichegru, L., Gremillet, D., Crawford, R.J.M. and Ryan, P.G. 2010. Marine no-take zone rapidly benefits endangered penguin. Biology Letters, 6, 498-501.
Pichegru, L., Ryan, P.G., van Eeden, R., Reid, T., Gremillet, D. and Wanless, R. 2012. Industrial fishing, no-take zones and endangered penguins. Biological Conservation, 156, 117-125.
Raab, K.E. 2013. The European anchovy (Engraulis encrasicolus) increase in the North Sea. PhD thesis, Wageningen University.
Regnier, T., Gibb, F.M. and Wright, P.J. 2017. Importance of trophic mismatch in a winter-hatching species: evidence from lesser sandeel. Marine Ecology Progress Series 567: 185-197.
Regnier, T., Gibb, F.M. and Wright, P.J. 2018. Temperature effects on egg development and larval condition in the lesser sandeel, Ammodytes marinus. Journal of Sea Research 134: 34-41.
Regnier, T., Gibb, F.M. and Wright, P.J. 2019. Understanding temperature effects on recruitment in the context of trophic mismatch. Scientific Reports 9: 15179.
Requena, S., Oppel, S., Bond, A.L., Hall, J., Cleeland, J., Crawford, R.J.M., Davies, D., Dilley, B.J., Glass, T., Makhado, A., Ratcliffe, N., Reid, T.A., Ronconi, R.A., Schofield, A., Steinfurth, A., Wege, M., Bester, M. and Ryan, P.G. 2020. Marine hotspots of activity inform protection of a threatened community of pelagic species in a large oceanic jurisdiction. Animal Conservation, 23, 585-596.
Rindorf, A., Wanless, S. and Harris, M.P., 2000. Effects of changes in sandeel availability on the reproductive output of seabirds. Marine Ecology Progress Series 202: 241-252.
Robertson, G.S., Bolton, M., Grecian, W.J. and Monaghan, P. 2014. Inter-and intra-year variation in foraging areas of breeding kittiwakes (Rissa tridactyla). Marine Biology, 161: 1973-1986.
Robinson, W.M.L., Butterworth, D.S. and Plaganvi, E.E. 2015. Quantifying the projected impact of the South African sardine fishery on the Robben Island penguin colony. ICES Journal of Marine Science, 72, 1822-1833.
Ronconi, R.A., Lascelles, B.G., Longham, G.M., Reid, J.B. and Oro, D. 2012. The role of seabirds in marine protected area identification, delineation, and monitoring: introduction and synthesis. Biological Conservation, 156, 1-4.
Rossiter, J.S. and Levine, A. 2014. What makes a “successful” marine protected area? The unique context of Hawaii’s fish replenishment areas. Marine Policy, 44, 196-203.
Russ, G.R. and Alcala, A.C. 1999. Management histories of Sumilon and Apo Marine Reserves, Philippines, and their influence on national marine resource policy. Coral Reefs, 18, 307-319.
Sackett, D.K., Kelley, C.D. and Drazen, J.C. 2017. Spilling over deepwater boundaries: evidence of spillover from two deepwater restricted fishing areas in Hawaii. Marine Ecology Progress Series, 568, 175-190.
Sadykova, D., Scott, B.E., De Dominicis, M., Wakelin, S.L., Wolf, J. and Sadykov, A. 2020. Ecological costs of climate change on marine predator-prey population distributions by 2050. Ecology and Evolution, DOI: 10.1002/ece3.5973.
Sala-Coromina, J., Garcia, J.A., Martin, P., Fernandez-Arcaya, U. and Recasens, L. 2021. European hake (Merluccius merluccius, Linnaeus 1758) spillover analysis using VMS and landings data in a no-take zone in the northern Catalan coast (NW Mediterranean). Fisheries Research, 237, 105870.
Saraux, C., Sydeman, W., Piatt, J., Anker-Nilssen, T., Hentati-Sundberg, J., Bertrand, S., Cury, P., Furness, R.W., Mills, J.A., Österblom, H., Passuni, G., Roux, J-P., Shannon, L.J. and Crawford, R.J.M. 2020. Seabird-induced natural mortality of forage fish varies with fish abundance: evidence from five ecosystems. Fish and Fisheries doi 10.1111/faf.12517.
Sciberras, M., Hinz, H., Bennell, J.D., Jenkins, S.R., Hawkins, S.J. and Kaiser, M.J. 2013. Benthic community response to a scallop dredging closure within a dynamic seabed habitat. Marine Ecology Progress Series 480: 83-98.
Sherley, R.B., Underhill, L.G., Barham, B.J., Barham, P.J., Coetzee, J.C., Crawford, R.J.M., Dyer, B.M., Leshoro, T.M. and Upfold, L. 2013. Influence of local and regional prey availability on breeding performance of African penguins Spheniscus demersus. Marine Ecology Progress Series, 473, 291-301.
Sherley, R.B., Winker, H., Altwegg, R., van der Lingen, C.D., Votier, S.C. and Crawford, R.J.M. 2015. Bottom-up effects of a no-take zone on endangered penguin demographics. Biology Letters, 11, 20150237.
Sherley, R.B., Botha, P., Underhill, L.G., Ryan, P.G., van Zyl, D., Cockcroft, A.C., Crawford, R.J.M., Dyer, B.M. and Cook, T.R. 2017. Defining ecologically relevant scales for spatial protection with long-term data on an endangered seabird and local prey availability. Conservation Biology, 31, 1312-1321.
Sherley, R.B., Barham, B.J., Barham, P.J., Campbell, K.J., Crawford, R.J.M., Grigg, J., Horswill, C., McInnes, A., Morris, T.L., Pichegru, L., Steinfurth, A., Weller, F., Winker, H. and Votier, S.C. 2018. Bayesian inference reveals positive but subtle effects of experimental fishery closures on marine predator demographics. Proceedings of the Royal Society B Biological Sciences, 285, 20172443.
Sherley, R.B., Crawford, R.J.M., de Blocq, A.D., Dyer, B.M., Geldenhuys, D., Hagen, C., Kemper, J., Makhado, A.B., Pichegru, L., Tom, D., Upfold, L., Visagie, J., Waller, L.J. and Winker, H. 2020. The conservation status and population decline of the African penguin deconstructed in space and time. Ecology and Evolution, 10, 8506-8516.
Sherman, K., Jones, C., Sullivan, L., Smith, W., Berrien, P. and Ejsymont, L. 1981. Congruent shifts in sandeel abundance in western and eastern North Atlantic ecosystems. Nature, 291, 486–489.
Silva, T.L., Wiley, D.N., Thompson, M.A., Hong, P.T., Kaufman, L., Suca, J.A., Llopiz, J.K., Baumann, H. and Fay, G. 2020. High collocation of sand lance and protected top predators: implications for conservation and management. Conservation Science and Practice, e274, doi: 10.1111/csp2.274.
Sobel, J. and Dahlgren, C. 2004. Marine Reserves: A Guide to Science, Design, and Use. Island Press, Washington.
Sørensen, T.K., Nilsson, P. & Tullrot, A. 2009. Marine Protected Areas as a Tool for Ecosystem Conservation and Fisheries Management. https://www.ices.dk/about-ICES/projects/EU-RFP/EU%20Repository/PROTECT/FP6%20PROTECT%20Final%20Report%20Project%20Synthesis.pdf
Stanbury, A., Thomas, S., Aegerter, J., Brown, A., Bullock, D., Eaton, M., Lock, L., Luxmoore, R., Roy, S., Whitaker, S. and Oppel, S. 2017. Prioritising islands in the United Kingdom and crown dependencies for the eradication of invasive alien vertebrates and rodent biosecurity. European Journal of Wildlife Research 63: 31.
Stewart, B.D., Howarth, L.M., Wood, H., Whiteside, K., Carney, W., Crimmins, E., O’Leary, B.C., Hawkins, J.P. and Roberts, C.M. 2020. Marine conservation begins at home: how a local community and protection of a small bay sent waves of change around the UK and beyond. Frontiers in Marine Science, 7, 76.
Stobart, B., Warwick, R., Gonzalez, C., Mallol, S., Diaz, D., Renones, O. and Goni, R. 2009. Long-term and spillover effects of a marine protected area on an exploited fish community. Marine Ecology Progress Series, 384, 47-60.
Stokesbury, K.D.E. and Harris, B.P. 2006. Impact of limited short-term sea scallop fishery on epibenthic community of Georges Bank closed areas. Marine Ecology Progress Series 307: 85-100.
Studwell, A., Hines, E., Nur, N. and Jahncke, J. 2021. Using habitat risk assessment to assess disturbance from maritime activities to inform seabird conservation in a coastal marine ecosystem. Ocean & Coastal Management, 199, 105431.
Sydeman, W.J., Thompson, S.A., Anker-Nilssen, T., Arimitsu, M., Bennison, A., Bertrand, S. et al. 2017. Best practices for assessing forage fish fisheries-seabird resource competition. Fisheries Research, 194, 209-221.
Szostek, C.L., Murray, L.G., Bell, E., Rayner, G. and Kaiser, M.J. 2016. Natural vs. fishing disturbance: drivers of community composition on traditional king scallop, Pecten maximus, fishing grounds. ICES Journal of Marine Science 73: 70-83.
Thrush, S.F., Hewitt, J.E., Cummings, V.J. and Dayton, P.K. 1995. The impact of habitat disturbance by scallop dredging on marine benthic communities: What can be predicted from the results of experiments? Marine Ecology Progress Series 129: 141-150.
Tien, N.S.H., Craeymeersch, J., van Damme, C., Couperus, A.S., Adema, J. and Tulp, I. 2017. Burrow distribution of three sandeel species relates to beam trawl fishing, sediment composition and water velocity, in Dutch coastal waters. Journal of Sea Research 127: 194-202.
Vandeperre, F., Higgins, R.M., Sanchez-Meca, J., Maynou, F., Goni, R., Martin-Soza, P. et al. 2011. Effects of no-take area size and age of marine protected areas on fisheries yields: a meta-analytical approach. Fish and Fisheries, 12, 412-426.
van der Molen, J. and Pätsch, J. 2022. An overview of Atlantic forcing of the North Sea with focus on oceanography and biogeochemistry. Journal of Sea Research 189: 102281.
van Deurs, M., van Hal, R., Tomczak, M.T., Jonasdottir, S.H. and Dolmer, P. 2009. Recruitment of lesser sandeel Ammodytes marinus in relation to density dependence and zooplankton composition. Marine Ecology Progress Series 381: 249-258.
van Deurs, M., Christensen, A., Frisk, C. and Mosegaard, H. 2010. Overwintering strategy of sandeel ecotypes from an energy/predation trade-off perspective. Marine Ecology Progress Series 416: 201-215.
van Deurs, M., Christensen, A. and Rindorf, A. 2013. Patchy zooplankton grazing and high energy conversion efficiency: ecological implications of sandeel behavior and strategy. Marine Ecology Progress Series 487: 123-133.
van Deurs, M., Jorgensen, C. and Fiksen, O. 2015. Effects of copepod size on fish growth: a model based on data for North Sea sandeel. Marine Ecology Progress Series 520: 235-243.
Vilas, D., Coll, M., Corrales, X., Steenbeek, J., Piroddi, C., Calo, A., Di Franco, A., Font, T., Guidetti, P., Ligas, A., Lloret, J., Prato, G., Sahyoun, R., Sartor, P. and Claudet, J. 2020. The effects of marine protected areas on ecosystem recovery and fisheries using a comparative modelling approach. Aquatic Conservation: Marine and Freshwater Ecosystems, 30, 1885-1901.
Walton, D., 2008. Informal logic: A pragmatic approach. Cambridge University Press.
Weber, S.B., Richardson, A.J., Brown, J., Bolton, M., Godley, B.J., Leat, E., Oppel, S., Shearer, L., Soetaert, K.E.R., Weber, N. and Broderick, A.C. 2021. Direct evidence of a prey depletion “halo” surrounding a pelagic predator colony. PNAS 118: e2101325118.
Weller, F., Cecchini, L-A., Shannon, L., Sherley, R.B., Crawford, R.J.M., Altwegg, R., Scott, L., Stewart, T. and Jarre, A. 2014. A system dynamics approach to modelling multiple drivers of the African penguin population on Robben Island, South Africa. Ecological Modelling, 277, 38-56.
Wischnewski, S., Fox, D. S., McCluskie, A. & Wright, L.J. 2017. Seabird tracking at Assessing the Flamborough & Filey Coast: the impacts of offshore wind turbines. RSPB Centre for Conservation Science Report to Ørsted.
Wojczulanis-Jakubas, K., Araya-Salas, M. and Jakubas, D. 2018. Seabird parents provision their chick in a coordinated manner. PLoS ONE 13: e0189969.
Wright, P.J., Orpwood, J.E. and Scott, B.E. 2017. Impact of rising temperature on reproductive investment in a capital breeder: the lesser sandeel. Journal of Experimental Marine Biology and Ecology 486: 52-58.
Zupan, M., Bulleri, F., Evans, J., Fraschetti, S., Guidetti, P. et al. 2018. How good is your marine protected area at curbing threats? Biological Conservation, 221, 237-245.
ANNEX A. Review of Marine Protected Areas
The effectiveness of Marine Protected Areas
- Compensation measures may be needed for SPA seabird populations due to predicted impacts from the Proposed Development. One of the potentially beneficial measures would be to improve the demographic parameters of seabird populations predicted to be impacted by the Proposed Development through the closure or management of fisheries of seabird prey species. Additionally, the influence of prey fish abundance on seabird demographics was also reviewed.
- There are numerous reviews of the evidence that protected areas benefit conservation of species, communities and ecosystem services. In particular, fishery closures strongly promote the recovery of fish stock biomass following heavy exploitation (MacNeil et al. 2015, Cabral 2020). Fishery closures can take the form of technical measures (specified constraints on gear use within a fishery; McClanahan et al. 2014, Campbell et al. 2018), periodic or seasonal closures (Cohen and Alexander 2013), or rights-based controls on access into the fishery. Such constraints on fishing may be the most effective measures to achieve conservation objectives of marine protected areas (MPAs) (Campbell et al. 2018, Cabral et al. 2020, Vilas et al. 2020).
- From analysis of 87 MPAs worldwide, Edgar et al. (2014) defined five key factors that determine the effectiveness of an MPA; the extent to which fishing is limited, the level of enforcement of fisheries constraints, MPA age, MPA size, and presence of continuous habitat allowing spill over of fish or shellfish from the MPA into surrounding waters. Similarly, Zupan et al. (2018) found that the designation of MPAs alone may not result in the lessening of some human threats, which is highly dependent on management goals and the related specific regulations that are adopted. They showed that fully protected areas effectively eliminated extractive activities, whereas the intensity of artisanal and recreational fishing within partially protected areas they investigated, paradoxically, was higher than that found outside MPAs, questioning their ability to reach conservation targets. They concluded that understanding the intensity and occurrence of human threats operating at the local scale inside and around MPAs is important for assessing MPA effectiveness in achieving the goals they have been designed for, informing management strategies, and prioritizing specific actions.
- Baskett and Barnett (2015) concluded in relation to fishery no-take protected areas “Responses at each level depend on the tendency of fisheries to target larger body sizes and the tendency for greater reserve protection with less movement within and across populations. The primary population response to reserves is survival to greater ages and sizes plus increases in the population size for harvested species, with greater response to reserves that are large relative to species' movement rates. The primary community response to reserves is an increase in total biomass and diversity, with the potential for trophic cascades and altered spatial patterning of metacommunities. The primary evolutionary response to reserves is increased genetic diversity, with the theoretical potential for protection against fisheries-induced evolution and selection for reduced movement.” The potential for the combined outcome of these responses to buffer marine populations and communities against temporal environmental heterogeneity has preliminary theoretical and empirical support. However, while the benefits from many MPAs have been widely recognised, not all MPAs have successful outcomes. Giakoumi et al. (2018) reviewed 27 detailed case studies from around the world and concluded that the most important factor determining the success or failure of a MPA was the level of stakeholder engagement. This conclusion was also reached in a comparison between two MPAs for coral reef fish in the Philippines, one successful and one unsuccessful, because constraints on fishing failed at one site due to a lack of community support (Russ and Alcala 1999).
- As one recent example in the context of fishery impacts, Fernandez-Chacon et al. (2020) studied MPA effects on lobsters Homarus gammarus collected at three pairs of MPA and control areas in Norway and reported that “annual mean survival was higher inside MPAs (0.592) vs. control areas (0.298), that significant negative relationships between survival and body size occurred at the control areas but not in the MPAs, where the effect of body size was predominantly positive. Additionally, we found that mean and maximum body size increased over time inside MPAs but not in control areas. Overall, our results suggest that MPAs can rebuild phenotypic complexity (i.e. size structure) and provide protection from harvest selection”.
- Jaco and Steele (2019) showed that MPA effects on fish size and survival were greater where prior fishing pressure had been higher, a conclusion also reached by Buxton et al. (2014). This does make the point that selecting areas for protection will have the greatest benefit where the impact of fishing mortality can be reduced most.
- Ballantyne (2014) reviewed the results from establishment of marine protected areas in New Zealand waters since the first was designated in 1977. He concluded, “When marine reserves were established, their ecology began to change, due to the cessation of fishing and other previous manipulations. These changes were complex, often large and continued to develop for decades. The study of these changes, and a continuing comparison to fished areas provided a great deal of new scientific data showing how fishing directly and indirectly alters ecosystems. The scientific benefits of marine reserves proved so numerous that it became clear that marine reserves are as important to science - they are the controls for the uncontrolled experiment that is happening due to fishing and other human activities. The general benefits of marine reserves to society as a whole; directly to conservation, education, recreation and management, and indirectly to fisheries, tourism and coastal planning; are so important that a systematic approach to their creation is in the public interest”.
- Parsons et al. (2004) reported long-term effects of protection within the Leigh marine reserve, New Zealand, including a trophic cascade related to predator activity with recovery of kelp forest in waters <8 m deep, and increase in turfing algal habitat. Snappers Pagrus auratus have been actively fished for more than 100 years in New Zealand and studied by fisheries scientists for more than 50 years. However, when studied in the marine reserve at Leigh (where it had become sixteen times more abundant than in fished areas outside the reserve, suggesting a change in ranging behaviour in response to the lack of fishing) it was discovered that, within the reserve, most individuals had small home-ranges in which they stayed for months at a time (Parsons et al. 2003).
- The Tsitsikamma National Park Marine Protected Area (Tsitsikamma MPA), a 60 km stretch of exposed rocky southern coast of South Africa, was proclaimed in 1964, making it Africa’s oldest MPA. This site was established as a zone with fishing strictly limited by permit, to try to recover over-exploited stocks of reef fish, many of the species present being endemic to South Africa. Many of these fish species have maximum ages over 20 years and are highly resident, so appear suited to protected area conservation. Tsitsikamma MPA has been a focus of research testing the hypothesis that MPAs allow recovery of depleted stocks of reef fish and the maintenance of critical spawner biomass. Despite extensive illegal poaching of fish from within this MPA, and several changes over the decades in the severity of constraint on fishing (Lombard et al. 2020), Buxton and Smale (1989) showed that roman Chrysoblephus laticeps, dageraad Chrysoblephus cristiceps and red steenbras Petrus rupestris achieved greater abundance and sizes inside the MPA than outside. Cowley et al. (2002) recorded that blacktail Diplodus capensis, zebra D. hottentotus, bronze bream Pachymetopon grande and galjoen Dichistius capensis achieved abundances of 5 to 21 times more inside the MPA than outside, and that these fish were on average 40% larger in the MPA than outside.
- Malcolm et al. (2018) used stereo baited remote underwater videos eight, nine, thirteen and fourteen years after ‘no take’ marine protected areas were established at the Solitary Islands Marine Park, Australia. Four species targeted by fishers: snapper Chrysophrys auratus, grey morwong Nemadactylus douglasi, pearl perch Glaucosoma scapulare, and venus-tuskfish Choerodon venustus, were more abundant and larger in ‘no take’ zones and showed an increase through time in ‘no take’ relative to fished areas. In contrast, there was no distinct pattern of four bycatch species increasing in abundance in ‘no-take’ areas.
- Boulcott et al. (2018) reported on the abundances of scallops in a small, protected area in Lamlash Bay, Arran. A no-take zone (NTZ) was established in 2008 in a small area (about 2.7 km2) of Lamlash Bay, excluding scallop dredging and bottom-trawling from the area. Five years after the closure, there was neither a significant increase in adult scallop abundance within the NTZ nor evidence of the dispersal of adults into surrounding areas. That finding contradicts an earlier claim that this NTZ had resulted in higher recruitment of scallop larvae into the NTZ compared to densities found outside the NTZ (Howarth et al. 2011). Boulcott et al. (2018) concluded that the small size of the NTZ may have played a role in the lack of demonstrable scallop recovery, that the lack of an effect may also be due to relatively low fishing pressure before the no-take zone was established, and that possibly responses may take more than five years in species where high recruitment is infrequent, as is the case in scallops. However, by 2019 the density of king scallops in the NTZ had increased substantially, to more than 3.7 times the level in 2013, and to a significantly higher abundance than in areas outside the NTZ (Stewart et al. 2020).
- Abundances of the European lobster Homarus gammarus in Lamlash Bay NTZ (Howarth et al. 2016) and in a similar‐sized NTZ in Lundy, UK (Hoskin et al. 2011), were found to increase demonstrably within 2–3 years of the closure of fishing within the NTZ. However, Howarth et al. (2016) concluded that high fishing effort outside the reserve may have reduced lobster abundance towards the end of their study, further supporting the concern about the effectiveness of a NTZ that is small in relation to the dispersal movements of the animals. Lobster Catch Per Unit Effort (CPUE) declined with increasing distance from the NTZ boundaries up to 20 km away (Howarth et al. 2016). Tagging and recapturing of the lobsters indicated this was likely due to “spillover”, with individuals from within the NTZ moving outside (Howarth et al. 2016, Stewart et al. 2020). The body size of lobsters was also consistently greater within the NTZ across all years, and because egg production increases with body size, and mature lobsters were so much more abundant in the NTZ, this difference translated to over 5.7 times more eggs within the NTZ in 2018, than in an unprotected area of equal size (Stewart et al. 2020). Stewart et al. (2020) concluded that “Our results demonstrate that recovery of biological communities inside protected areas is not monotonic; instead, what we are seeing is complex, ecological processes unfolding in a dynamic environment. This should not be seen as problematic; the complexity should be embraced; it is a more accurate reflection of how ecosystems naturally function. This emerging understanding is crucial for both setting realistic management objectives for other MPAs in the region, and for managing the expectations of conservationists and managers in the future”.
- Kough et al. (2019) showed that Exuma Cays MPAs held higher densities of queen conch Lobatus gigas than found in fished areas and showed that there are positive associations between enforcement and conch size and age. They concluded that the MPA is currently sustaining the nearby populations exposed to fishing, as a result of spillover of larvae from the MPA.
- One of the key objectives of MPAs is to create “spillover” with fish or crustaceans that increase in density in the MPA dispersing into adjacent areas. Many studies present evidence that spillover occurs from MPAs and so supports fisheries in the region (e.g. McClanahan and Mangi 2000, Gell and Roberts 2003, Abesamis and Russ 2005, Goni et al. 2008, Harmelin-Vivien et al. 2008, Stobart et al. 2009, Goni et al. 2010, Vandeperre et al. 2011, Florin et al. 2013, Huserbråten et al. 2013, Kerwath et al. 2013, Rossiter and Levine 2014, Alos et al. 2015, Di Lorenzo et al. 2016, Sackett et al. 2017, Kleiven et al. 2019, Kough et al. 2019, Marshall et al. 2019, Cabral et al. 2020, Di Lorenzo et al. 2020, Vilas et al. 2020, Sala-Coromina et al. 2021). For example, Huserbråten et al. (2013) showed that European lobster Homarus gammarus survival and abundance and size increased in MPAs where fishing for lobsters was prohibited. They also showed that there was some spillover of adult lobsters, but that this was very limited due to high levels of residency of these animals. However, larval export from the MPAs was assessed as being very high, and therefore affecting large areas outside the small MPAs due to the pelagic larval stage. Spillover of larvae can be especially important from MPAs because the mean size of fish or crustacea tends to increase within MPAs, and larger animals produce disproportionally greater numbers of larvae (Marshall et al. 2019).
- Kleiven et al. (2019) presented results from a fine-scale spatial gradient study conducted before and after the implementation of a five km2 lobster MPA in southern Norway. A significant nonlinear response in lobster abundance, estimated as CPUE from experimental fishing, was detected within two years of protection. After four years, CPUE values inside the MPA had increased by a magnitude of 2.6 compared to before-protection values. CPUE showed a significant nonlinear decline from the centre of the MPA, with a depression immediately outside the border and a plateau in fished areas. Overall fishing pressure almost doubled over the course of the study. The highest increase in fishing pressure (by a magnitude of 3) was recorded within one km of the MPA border, providing a plausible cause for the depression in CPUE. The authors conclude that, taken together, these results demonstrate the need to regulate fishing pressure in surrounding areas when MPAs are implemented as fishery management tools.
- Stobart et al. (2009) reported that at the Columbretes Islands Marine Reserve, Spain, relative to nearby fished areas the reserve fish community had higher abundance and biomass, and larger relative body size. They found clear evidence of spillover of fish from the reserve to the adjacent fishery as commercial fish yields at the reserve border increased continuously during the study period, despite being locally depleted due to fishing effort concentration at the edge of the reserve (“fishing the line”). Harmelin-Vivien et al. (2008) assessed the presence of gradients of fish abundance and biomass across marine reserve boundaries in six Mediterranean MPAs. A reserve effect was detected, with higher values of fish species richness (x1.1), abundance (x1.3), and biomass (x4.7) recorded inside MPAs compared to adjacent fished areas. Linear correlations revealed significant negative gradients in mean fish biomass in all the reserves studied. They concluded that the existence of regular patterns of negative fish biomass gradients from within MPAs to fished areas was consistent with the hypothesis of adult fish biomass spillover processes from marine reserves, and that it could be considered as a general pattern in the Mediterranean region. Vandeperre et al. (2011) used 28 data sets from seven MPAs in southern Europe to show that CPUE of fisheries outside the MPAs increased as a result of spillover of fish from the MPA. Furthermore, the boost to the marketable catch from spillover increased by an average of 3% per year for at least 30 years after designation of the MPAs.
- Using a 15-year time series of nationwide, spatially referenced catch and effort data, Kerwath et al. (2013) found that the establishment of the Goukamma MPA benefited the adjacent fishery for roman Chrysoblephus laticeps, a South African endemic seabream. Roman-directed CPUE in the vicinity of the new MPA immediately increased, contradicting trends across this species’ distribution. The increase continued after 5 years, the time lag expected for larval export, effectively doubling the pre-MPA CPUE after 10 years. Garcia-Rubies et al. (2013) point out that spillover may not occur in the initial stages of some MPAs, especially where fish are slow-growing and long-lived so may take many years to reach carrying capacity within the MPA, and significant spillover of adult or maturing fish is only likely after that has occurred.
- Di Lorenzo et al. (2020) developed a meta-analysis of a global database covering 23 MPAs where fishing is prohibited or strictly limited, in twelve different countries, to assess the capacity of MPAs to export fish biomass and to assess whether this response was mediated by particular MPA features (e.g. size, age) or fish species characteristics (e.g. mobility, economic value). Results, on average, showed that fish biomass and abundance were highest inside the MPA, but outside the MPAs were higher in locations close to MPA borders, were particularly higher close to the MPA for species with a high commercial value, and were higher in the presence of a partially protected area (PPA) surrounding the MPA. Spillover slightly increased as MPAs were larger and older and for species that were more mobile. The authors concluded that spillover is a regular feature of MPAs where fishing is prohibited or limited, and that this could enhance local fishery management.
- While there is much empirical evidence of increases in sizes and numbers of animals within MPAs compared with control areas outside the MPA, another approach to assessing the benefits of MPAs is to use scenario modelling. Dahood et al. (2020) used a dynamic food web model to evaluate a range of different scenarios for MPAs in the Southern Ocean. Halouani et al. (2020) used a modelling approach to assess the extent to which the ‘no-take zone’ created by an offshore wind farm may benefit conservation of fish stocks. Vilas et al. (2020) used a comparative food-web modelling approach to demonstrate that fully protected MPAs perform better than partially protected MPAs and, even when small, can yield local positive impacts on the structure and functioning of marine ecosystems that contribute to support local fisheries.
- The success of very many MPAs and NTZs around the world has led to a more strategic approach to marine conservation designations in some countries. In 2002, after more than a decade of consultation, the State of Victoria, Australia, established 24 no-take areas (including 10 Marine National Parks) totalling 540 km2 and more than 5% of State waters (Sobel and Dahlgren 2004). This was the world’s first representative system of marine reserves. In 2003, the California Fish and Game Commission approved ten ‘no-take’ marine reserves in the northern Channel Islands, California. The initial zones covered state waters (out to three nautical miles), but later the federal authorities extended these to six nautical miles. The reserves comprised 25% of waters around the islands and formed the first replicated and representative marine reserve system. In 2004, the Great Barrier Reef Marine Park Authority’s new zoning plan was approved by the Australian Federal Government (Sobel and Dahlgren 2004). The plan required a minimum of 25% by area of all 73 bioregions in the Great Barrier Reef Marine Park to be completely ‘no-take’.
- On the high seas, 286,200 km2 of the North-East Atlantic was designated as six MPAs in international waters under the Convention for the Protection of the Marine Environment of the North-East Atlantic (the OSPAR Convention) in 2010, which is considered to be the start of a process of developing an ecologically coherent and representative MPA network in that ocean (O’Leary et al. 2012).
- In England, in addition to existing and new SPAs and SACs, 91 Marine Conservation Zones (MCZs) have been designated between November 2013 and May 2019 as an ecologically coherent network in terms of representation of species and habitats. In Scotland, a combination of marine extensions to Special Protection Areas (SPAs) originally designated for breeding seabirds, designation of marine areas as SPAs for nonbreeding seabirds, designation of SACs for marine mammals, MPAs for marine mammals, fish and marine invertebrates, comprise 225 sites providing protection over more than 37% of Scotland’s marine waters. Many of these sites have been designated within the last few years, so too recently for any assessment of changes that may follow as a consequence of management. Not all of these MPAs involve establishment of fisheries restrictions, depending on the objectives for individual sites. In addition to SPAs, SACs and MPAs, five other area-based measures include a temporary no-take zone for sandeel fishing off east Scotland, which has remained in force without any suggestion that this will be revoked.
- The efficacy of MPAs might be compromised by climate change if climate change results in the poleward shift of species’ distributions so could move species out of MPAs. While modelling of species’ distributions suggests such poleward shifts will occur (Sadykova et al. 2020, Clairbaux et al. 2021), the key feature of MPAs is the reduction in fishing pressure on stocks. There will be few cases where MPAs are situated at the equatorial edge of fish distributions, so climate change is unlikely to negate the benefits of MPAs except in a very few exceptional such cases (Clairbaux et al. 2021).
Case studies of NTZs that influence seabird demography
- Very few MPAs/NTZs have been designated with the objective to enhance conservation of seabird populations (Ronconi et al. 2012, Hentati-Sundberg et al. 2020). However, that outcome could arise if MPA/NTZ designation resulted in a reduction of seabird bycatch in fisheries, or if the MPA/NTZ resulted in a bottom-up increase in energy flow through the food web up to seabirds (i.e. increased the abundance or quality of their preferred foods; Hentati-Sundberg et al. 2020), or if MPA/NTZ designation improved the quality of breeding habitat for seabirds (for example by reducing human disturbance, removing threats from alien invasive mammal predators, or improving nest site quality).
- Several studies have focused on the potential of designating or managing marine protected areas for seabird conservation (Lascelles et al. 2012, Ronconi et al. 2012, Sherley et al. 2017). Studwell et al. (2021) presented a habitat prioritization approach for identifying critical areas for wildlife conservation action, including seabirds. They demonstrated the value of that approach by applying it to the wildlife in the offshore waters of Greater Farallones National Marine Sanctuary and Cordell Bank National Marine Sanctuary, California. They identified areas where seabirds would benefit from a combination of adding protections to some areas and enhancing management of the primary disturbance resulting from higher risk activities, which in their case study included benthic fishing with mobile or fixed gear. Silva et al. (2020) investigated spatial overlap between a key forage fish species (sandeel) and two protected predators, humpback whale and great shearwater in the Gulf of Maine, USA. Both the cetacean and the seabird showed very strong and consistent match in spatial distribution with that of sandeel. They proposed managing protected areas for these top predators on the basis of the key role of sandeel habitat in determining predator distributions in that system.
- In a review of the pressures and threats to global populations of penguins, Boersma et al. (2020) identified marine spatial planning as the highest ranked conservation need to conserve endangered penguin populations, for which they particularly emphasize the need for MPAs to manage fisheries to ensure that adequate prey resources for penguins remain in areas critical to their breeding success (i.e. close to colonies) and survival (i.e. over larger spatial scales when penguins are dispersed from the colony sites).
- Requena et al. (2020) used tracking data from nine seabird species and one marine mammal to identify marine hotspots around Tristan da Cunha, South Atlantic Ocean. These included offshore sea mounts as well as areas in the vicinity of breeding sites on the islands and were consistent across years. They concluded that tracking data provide reliable information that could be used to define MPAs for these top predator populations, which include several endemic and globally threatened species. Analyses of seabird tracking data in UK waters was considered to provide effective identification of seabird hotspots that could be designated as MPAs (Cleasby et al. 2020). Using maximum curvature methods (as developed for seabird hotspot identification by O’Brien et al. 2012) allowed clear definition of seabird hotspots and this and other analytical methods consistently identified several high-density areas that Kober et al. (2010) and Cleasby et al. (2020) considered should be prioritised for seabird conservation. Critchley et al. (2019) used seabird tracking data to test whether simple foraging radius models from colonies provide a cost-effective alternative to large-scale surveys or tracking studies. They showed that for a range of seabirds of differing ecology (razorbill, puffin, Manx shearwater and European storm-petrel) foraging radius distribution broadly matched foraging areas identified from tracking breeding adults from colonies or from aerial surveys. The foraging radius method fitted better to tracking data than to aerial survey data, which could indicate that nonbreeding birds that will be seen in aerial survey data but not in tracking data and which represent a significant component of the total population but may avoid areas with dense aggregations of more experienced breeding adults, may confuse efforts to identify key foraging areas used by breeding birds. Perrow et al. (2015) also used a combination of tracking of breeding adults, a boat-based survey, and a foraging radius approach to define the at-sea MPA (in this case a SPA marine extension) for breeding little terns. They also found that these different approaches defined areas that were broadly similar, giving confidence in the use of each and suggesting that an integrated approach would be most suitable. Similarly, tracking data from marine mammals have been used to justify decisions on boundaries of MPAs, in some cases providing retrospective justification (e.g. Kirkman et al. 2016). Arias-Del-Razo et al. (2019) showed that MPAs with large populations of marine mammals still provided large gains in fish biomass (which increased with the age of the MPA), despite the presence of marine mammals that could be a major predator on those fish. However, Kelaher et al. (2015) concluded that reef fish increased less in MPAs with large seal populations than in MPAs without large numbers of seals and suggested that if the aim is to recover reef fish populations, designating MPA sites away from seal colonies may be preferable. An implication of this, of course, is that if the aim is to improve conditions for top predators, then marine habitat management that enhances populations of fish on which the predators can feed will be an effective conservation measure.
- Bertrand et al. (2012) showed that the foraging efficiency of breeding seabirds in Peru may be significantly affected by not only the global quantity, but also the temporal and spatial patterns of fishery removals of forage fish (in this case, anchoveta). They concluded that, together with an ecosystem-based definition of the fishery quota, an ecosystem approach to fisheries management should limit the risk of local depletion around breeding colonies using, for instance, adaptive marine protected areas around colonies of forage-fish dependent seabirds.
- Hentati-Sundberg et al. (2020) developed a bioenergetics model linking top predator (such as seabirds) breeding biology and foraging ecology with forage fish ecology and fisheries management. They applied their framework to the case study example of common guillemots and razorbills at a Baltic Sea colony where they depend on sprat and juvenile herring as key prey species. They showed that a fishery management target of ‘one-third-for-the-birds’ (Cury et al. 2011) is sufficient to sustain successful breeding by the seabirds. However, the results also highlight the importance of maintaining sufficient prey densities in the vicinity of the colony, suggesting that fine-scale spatial fisheries management is necessary to maintain high seabird breeding success, and therefore indicating the value of a MPA that limits forage-fish fishery harvests in areas close to the seabird colony.
British Indian Ocean Territory (BIOT) MPA
British Indian Ocean Territory (BIOT) MPA
- The BIOT MPA holds about 281,000 breeding pairs of seabirds of 18 species (Hays et al. 2020). Tracking studies show that the vast majority of these seabirds forage within the BIOT MPA while breeding, and Hays et al. (2020) suggest that the lack of commercial fishing within the MPA may help ensure high availability of forage fish and reduce threats from fisheries bycatch of seabirds. However, that inference is based mainly on expert judgement, as the available evidence on this is very limited in that particular case study (Hays et al. 2020).
South Georgia and South Sandwich Islands (SGSSI) MPA and seabirds
- South Georgia and South Sandwich Islands (SGSSI) MPA, an area of 1.07 million km2, was designated in 2012, as a multi-purpose MPA encompassing the entire EEZ. Impetus for the MPA came from the desire to conserve species and habitats under pressure from: climate variability and change; previously high levels of illegal, unregulated, and unreported fishing; and incidental mortality from fishery bycatch (Handley et al. 2020). Using extensive tracking data from 14 marine predator species within the MPA (over 1,400 tracks), Handley et al. (2020) evaluated the spatio-temporal overlap of these predators and the different management regimes of krill, demersal longline and pelagic trawl fisheries operating within the MPA. Their analyses show that current fishery management measures within the MPA contribute to protecting top predators, including a wide range of seabird species, and that resource harvesting within the MPA does not pose a major threat under current climate conditions. The authors concluded, however, that unregulated fisheries beyond the MPA pose a likely threat to some of these seabirds. A very similar conclusion was reached by Heerah et al. (2019) by analysing tracking data from four threatened seabird species breeding at Amsterdam Island, southern Indian Ocean, within Amsterdam Island Marine Protected Area. In both of these cases, conservation gains for seabirds were assessed in terms of likely reductions in fishery bycatch and likely benefits from anticipated higher mean biomasses of prey species. However, long-term data to test whether or not seabird numbers increased in response to MPA designation are not yet available for these sites.
Mediterranean MPAs and foraging Yelkouan shearwaters
- The Yelkouan shearwater Puffinus yelkouan is an endemic seabird in the Mediterranean Sea and is listed as Vulnerable. No MPAs have been designated specifically to protect foraging habitat of this species, but Peron et al. (2013) considered that coastal MPAs in the western Mediterranean, that had been established to protect coastal fish, may provide suitable foraging habitat and good densities of small pelagic fish required by this seabird. They tracked adults from colonies, carried out ship-based and visual aerial surveys, and assessed the extent to which these birds foraged within the existing MPAs (which are areas of 152, 1,413 and 4,019 km2). They found that 38% of Yelkouan shearwater diving locations during the breeding season were within the three French MPAs, and therefore that this seabird most likely benefits from the existing management of those MPAs. They did not report what percentage of diving locations were expected to fall within these MPAs if the birds had shown no preference but concluded that 38% was dramatically higher than would have been expected if the birds were not responding to these sites as preferred foraging areas. While the MPAs were not designed to benefit shearwaters, they were established with constraints on fishing as part of their management, and the study of Peron et al. (2013) provides strong evidence that this policy has enhanced the foraging resource for shearwaters within the MPAs relative to unprotected (and heavily fished) waters outside the MPAs.
The Namibian Islands’ Marine Protected Area, designated specifically for its seabirds
- The northern Benguela Upwelling System supports an important seabird community, including several globally and locally endangered species. Threats to these species include a shortage of food, interactions with fisheries, human disturbance, habitat destruction and severe weather events possibly exacerbated by climate change (Ludynia et al. 2012). Populations of African penguins Spheniscus demersus, Cape gannets Morus capensis and bank cormorants Phalacrocorax neglectus are in rapid decline, and consequently are listed as globally ‘‘Endangered’’ (African penguin and bank cormorant), or globally ‘‘Vulnerable’’/ ‘‘Endangered’’ in Namibia (Cape gannet). These declines have been related to the absence of small pelagic fish (especially sardines Sardinops sagax and anchovies Engraulis encrasicolus) in the Benguela after many years of intense exploitation of resource by fisheries (Ludynia et al. 2012). Namibia designated its first MPA, the Namibian Islands’ Marine Protected Area (NIMPA) in 2009, stretching 400 km along the southern Namibian coast, covering almost 10,000 km2. One of the NIMPA’s three key objectives is to protect the breeding sites as well as main foraging areas of the three threatened seabirds breeding and feeding along Namibia’s coast. Using a zoned approach, with a large buffer zone connecting areas of higher protection status, the NIMPA places restrictions on human activities, including fishing, mining, guano harvesting and recreational activities in the area (Ludynia et al. 2012). Ludynia et al. (2012) used tracking data to confirm that the boundaries of the NIMPA were appropriate for the seabirds, but concluded that the almost complete absence small pelagic fish stocks in the northern Benguela now, will require additional measures to achieve tangible long-term restoration of the system and an improved conservation status for seabirds breeding in Namibia; the destruction of the pelagic fish stocks appears to have resulted in a change in ecosystem structure and function that might not be reversible, even if the MPA is protected from further fishing. As of 2020, there seems no reason to alter that pessimistic conclusion yet (Jean-Paul Roux, pers. comm.).
Habitat management plans to conserve African penguins in South Africa
- Through the early 20th Century, very large populations of seabirds bred along the South African and Namibian coasts, where they feed predominantly on sardine (pilchard) and anchovy within the Benguela ecosystem. One of the key seabird species in that region is the African penguin. Because they are flightless, African penguins are resident within the ecosystem and are highly dependent on sardine and anchovy to survive, as well as to breed successfully. Off South Africa, anchovy and sardine contributed 50–90% by mass of African penguin diet in six studies conducted between 1953 and 1992, and 83–85% by number of prey items eaten in two studies between 1977 and 1985 (Crawford et al. 2006). Although there were 1.5 million African penguins in this ecosystem early in the 20th Century, the population declined to fewer than 200,000 individuals by the latter part of the century and was then classified as “Vulnerable” (Crawford 1998). Trends in regional populations of African penguins are related to long-term changes in the abundance and distribution of sardine and anchovy (Crawford 1998). Purse-seine fisheries developed rapidly off South Africa and Namibia after 1945. They reduced availability of food to penguins, especially off Namibia, following the collapse of the stock of sardine. Numbers of penguins breeding in southern Namibia dropped from 40,000 pairs in 1956 to 1,000 pairs in 2000 (Crawford et al. 2006). From 1984 to 1989, during a period when sardine fishing was increasing off South Africa, the breeding success of African penguins in Saldanha Bay was significantly related to the contribution of sardine to the diet (Adams et al. 1992). From 1989 to 1995, breeding success at Robben Island was significantly related to the biomass of anchovy (Crawford et al. 1999). From 1989 to 2004, the breeding success of African penguins at Robben Island, South Africa was significantly related to estimates of the abundance of both their main prey species, anchovy and sardine, and to the combined biomass of these species. When the combined spawner biomass of fish prey was less than two million tonnes, pairs fledged an average of 0.46 chicks annually. When it was above two million tonnes, annual breeding success had a mean value of 0.73 chicks per pair (Crawford et al. 2006). Crawford et al. (2006) concluded that in order to conserve the penguin population, management of the purse-seine fishery should ensure adequate escapement of fish to maintain the combined biomass of anchovy and sardine above two million tonnes. This research showed clearly that African penguin breeding success and population trend are driven to a considerable extent by forage fish stock status, and that forage fish stock status was strongly influenced by fishing pressures from the directed sardine and anchovy fisheries. Between 2004 and 2008, the African penguin population fell to just 26,000 pairs, the lowest value on record (Pichegru et al. 2010). Rather than constraining the economically important fisheries on sardine and anchovy stocks throughout their geographic distribution, an alternative that was tested was the establishment of MPAs for breeding African penguins by creating fishery no take zones (NTZs) close to islands supporting major colonies of these penguins. That was done as a scientific experiment using appropriate experimental and control areas with defined manipulations, with two objectives; firstly, to restore African penguin breeding success and numbers, and secondly, to test the efficacy of NTZs around penguin colonies as a tool to restore depleted populations. The study and associated research led to a large literature on African penguin demography in relation to MPAs, fisheries and forage-fish stocks (Pichegru et al. 2010, 2012, Sherley et al. 2013, 2015, 2017, 2018, 2020, Ludynia et al. 2014, Weller et al. 2014, Robinson et al. 2015, McInnes et al. 2017, 2019, Campbell et al. 2019, Crawford et al. 2019).
- Because penguins are flightless, they forage while breeding in waters close to their colony, usually within 20 km of the nest site (Pichegru et al. 2010). In January 2009, a 20 km radius area was closed to purse-seine fishing around the world’s largest African penguin colony at St Croix Island, Algoa Bay (the ‘experimental treatment’). The waters around Bird Island, another penguin colony 50 km away within the same bay, remained open to fishing (the ‘control area’). By studying the foraging behaviour of adult penguins raising chicks at both sites before and after the closure to fishing, Pichegru et al. (2010) tested whether a relatively small no-take zone could benefit breeding penguins relying on pelagic prey. The foraging behaviour of adult penguins raising chicks of one to three weeks old was studied at St Croix Island (the ‘treatment colony’) and at Bird Island (the ‘control colony’), in May–June 2008 before, and in April–May 2009 after closure to fishing. The positions of purse-seine vessels were monitored via satellite telemetry, ensuring compliance within the experimental closure. African penguins share the care of their brood of one or two chicks between March and August, with typically one adult attending the nest when the partner is at sea. Birds were equipped with GPS-TD loggers which record latitude and longitude at 1 min intervals to an accuracy of less than 10 m, and depth at one second intervals to the nearest 0.1 m. In 2008, the average foraging path travelled for birds from the treatment island was 70 km (maximum 150 km), at 18–45 km away from the colony for an average of 22 hours per trip. After the fishery closure in 2009, penguins reduced their effort by 25–30%, travelling 50 km (maximum 80 km) to forage for on average 17 hours, within 5–30 km of the island. By contrast, from 2008 to 2009, penguins from the control island increased their time spent foraging (from 15.6 to 17.8 hours on average), potentially as a result of reduced marine productivity and/or increased fishing pressure around the island in 2009 (Pichegru et al. 2010).
- Despite having data from just a single season before and a single season after fishery closure, Pichegru et al. (2010) concluded that their study provided strong evidence that even the relatively small MPA designated around the penguin colony can benefit penguins. However, Pichegru et al. (2012) describe the foraging behaviour of adult penguins raising chicks at both sites in the second year of fishing exclusion around St. Croix Island (2010). In that second paper they compared the penguins’ at-sea behaviour in the year before closure and the two years after closure with the distribution and abundance of purse-seine fish catches. They also compared the penguins’ breeding success and chick growth at the two colonies in the first two breeding seasons after the local fishery closure. Birds from St. Croix Island (the ‘treatment colony’) spent more time feeding within the boundaries of the closure after the ban (75% and 55% of their dives within the closure in 2009 and 2010, respectively) than when fishing was allowed in that area, and significantly reduced foraging effort, whereas effort increased at the control colony, but there was no clear evidence that the NTZ resulted in higher breeding success or survival of penguins. Pichegru et al. (2012) found that the local fishing fleet increased fishing effort in the area immediately outside the closed area and concluded that in order to avoid such problems the closed area needed to be larger, or to have a buffer area around it with limited fishing. They concluded ‘The collapse of Africa’s only breeding penguin species adds urgency to the wider implementation of such measures, which are likely to also benefit the important biomass of endemic predators of the Benguela upwelling ecosystem’.
- Sherley et al. (2013) showed that breeding numbers, and the fledging period, of African penguins at Robben Island increased and decreased in relation to local abundance of sardines in that area prior to breeding. Breeding success and chick-fledging rates also increased with increasing biomass of forage fish (indexed through the industrial catch of anchovy within 56 km of the colony). They concluded that the local abundance of forage fish rather than the total abundance throughout the Benguela Upwelling Ecosystem, is the key driver of penguin breeding success at this colony. They concluded that management needs to ensure adequate biomass of forage fish close to the colony during the breeding season and also at a regional level in the nonbreeding period when birds are more dispersed than while breeding. Using a population modelling approach to assess trends in African penguin numbers at Robben Island, Weller et al. (2014) concluded ‘The modelled population was found to be strongly driven by food availability and to a lesser degree by oiling and marine predation, while climate events and terrestrial predation had low impacts. Food biomass levels (small pelagic fish) in the penguins’ foraging area around the island (used during nesting) and further afield (used during the rest of the year) had an equal influence in driving population development in the short and long term. The impact of short-term (three years) fishing restrictions currently being trialled around the island was found to be generally beneficial to the modelled population, but easily masked by food-driven variability in population growth’. Their results suggested that improving food availability and mitigating the impact of oiling would have the highest beneficial impact on this penguin population. Robinson et al. (2015) developed a population dynamics model for African penguin at Robben Island and concluded that the predator–prey interaction was best explained by a sardine–penguin mortality relationship with average penguin survival decreasing only when the local sardine biomass was less than approximately one-quarter of the maximum observed. From that, they inferred that declines in penguin numbers would be most likely when forage fish biomass was severely reduced but would be unlikely if forage fish biomass was maintained at moderate to high levels. From 2011 to 2013, a 20 km radius around Robben Island was closed to purse-seine fishing. Sherley et al. (2015) examined how African penguin chick survival responded to that experimental closure. Chick survival is heavily influenced by the rate and amount of food delivered to the nest, so should respond if closure increases prey availability above baseline levels. Sherley et al. (2015) examined whether penguin chick survival varied between years with (2011–2013) and without (2001–2010) fisheries closure and used a demographic model to examine the impact on population growth. Crucially, they used biomass estimates to account for variation in prey availability, penguin population estimates to control for density-dependent effects and catch data from outside the closure to control for changes in fishing activity over larger spatial scales. Although the closure was relatively small, and catches continued at its boundary, chick survival increased by 18% after the closure was initiated compared with when fishing had occurred close to the island, which alone led to a predicted 27% higher population compared with a scenario with continued fishing. However, the modelled population continued to decline, probably because of high adult mortality linked to poor prey availability over larger spatial scales. Sherley et al. (2015) concluded that the results illustrate that small no-take zones can have bottom-up benefits for highly mobile marine predators, but are only one component of holistic, ecosystem-based management regimes.
- Campbell et al. (2019) provided a detailed study of African penguin foraging from Robben Island. They tracked 75 chick‐provisioning penguins with GPS–time–depth devices, measured body condition of 569 chicks, quantified the diet of 83 breeding penguins and conducted 12 forage fish hydro‐acoustic surveys within a 20 km radius of Robben Island over three years (2011–2013), during the MPA/NTZ period at that colony. Local forage fish abundance explained 60% of the variation in time spent diving. Penguin foraging effort (time spent diving, number of wiggles per trip, number of foraging dives and the maximum distance travelled) increased and offspring body condition decreased as forage fish abundance declined. In addition, quantile regression revealed that variation in foraging effort increased as prey abundance around the colony declined. Their results demonstrate that local forage fish abundance influences seabird foraging and offspring fitness. They also highlight the potential for offspring condition and the mean–variance relationship in foraging behaviour to act as leading indicators of poor prey abundance. Those metrics were suggested as possible ones to use to manage MPAs for these breeding seabirds.
- Ludynia et al. (2014) studied the population trend and demography of African penguins at Dyer Island, where there has been a very large decrease in breeding numbers. They concluded that numbers breeding on the island were negatively correlated with purse-seine fishery catches from within 20 nautical miles around the island, but that once the colony had declined below 3,500 breeding pairs, the impact of fishing became less evident and other factors took over. Those particularly included predation impacts from fur seals and kelp gulls, which appear to show an increase when penguin numbers were depleted.
- Sherley et al. (2018) used Bayesian inference to examine changes in chick survival, body condition and population growth rate of African penguins in response to eight years of alternating time-area closures around two pairs of colonies. Their results demonstrate that fishing closures improved chick survival and condition, after controlling for changing prey availability. However, this effect was inconsistent across sites and years, highlighting the difficulty of assessing management interventions in marine ecosystems. Nevertheless, predicted increase in penguin population growth rate as a consequence of local fishery closure exceeded 1% at one colony. Fishing closures evidently can improve the population trend of a forage-fish dependent predator. Sherley et al. (2018) therefore recommended that they continue in South Africa and support their application elsewhere. However, they also noted that detecting demographic gains for mobile marine predators from small no-take zones requires experimental time frames and scales that will often exceed those desired by decision makers.
- Crawford et al. (2019) used Principal Component Analysis of seabird diets in the Benguela Upwelling Ecosystem to assess the effect of variation in forage fish abundance on these birds. They found that PC2 provided a Forage Availability Index that correlated with African penguin annual survival, emphasizing that while local MPA/NTZs may help to improve penguin breeding success, the abundance of forage fish in the wider ecosystem is important in influencing survival of penguins from year to year.
- This case study, based on a large amount of detailed research and experimental manipulation, provides strong evidence that a NTZ around African penguin colonies can reduce the foraging effort and increase breeding success of the birds, but also that this measure may not be enough on its own if the population decline is also caused by low forage fish abundance throughout the region that results in poor survival of birds when dispersed away from the breeding site.
The effectiveness of fisheries management changes to seabird populations
- The available evidence indicates that habitat management zones that are small can be effective for sedentary animals. But for seabirds, habitat management zones would be intended to enhance food supply, and the mobility of seabirds means that to be effective any such zones would need to be large. Outside the breeding season, seabirds tend either to migrate substantial distances to overwinter in areas with good food supplies and benign conditions, or in those species that do not migrate, the birds disperse from the breeding area.
- In the breeding season, seabirds become central-place foragers, commuting from their nest site to foraging habitat. While this constrains their spatial distribution, the maximum foraging ranges of many breeding seabirds are large.
- This review found numerous examples that changes to fisheries management (through MPAs with NTZs) improved prey species populations resulting in positive demographic change for seabird population that foraged on those prey. This was across a wide variety of seabird taxa, fish taxa, fisheries type and locations around the world. These results suggest that changes to the fisheries of key prey fish populations could provide suitable compensation measures for impacts predicted to affect protected seabird populations.
- There is therefore good evidence in general that compensation measures that have positive effects on sandeel stocks in the North Sea are likely to positively benefit seabird populations that forage on those sandeel stocks.
ANNEX B. Residual plots for each relationhip between species demographic rates and sandeel tsb in SA4
ANNEX B. Residual plots for each relationhip between species demographic rates and sandeel tsb in SA4
Figure 1.27 Residual plot for kittiwake return rates
Figure 1.28 Residual plot for guillemot return rates
Figure 1.29 Residual plot for razorbill return rates
Figure 1.30 Residual plot for puffin return rates
Figure 1.31 Residual plot for kittiwake productivity
Figure 1.32 Residual plot for guillemot productivity
Figure 1.33 Residual plot for puffin productivity
ANNEX C. Consultation with Stakeholders
- Throughout the development of the sandeel fisheries compensation plan the Applicant has consulted with statutory and non-statutory stakeholders on the approaches used. These consultations have resulting in useful feedback and improvements to this report. These are summarised below. Additional information regarding consultation undertaken by the Applicant is presented in Appendix 1 of the Derogation Case.
Questions asked of consultees
Questions asked of consultees
- During the consultations with key stakeholders four important questions were asked:
- Are the sandeel stock biomass scenarios a suitable basis for assessing efficacy of compensation measures?
- Are CGR and growth rates the most appropriate basis for assessing efficacy of compensation measures from PVA results?
- Are there other SPAs that should be assessed? and
- How do we estimate the compensation ratios based on SPAs that benefit from the proposed measures but are not impacted?
- Consultee responses for each of these questions are summarised below, with responses provided. Note that for clarity “stock biomass” refers to “total stock biomass” and is referred to as “TSB” hereafter. It is the estimated biomass of sandeels of all age classes, as presented in annual stock assessments by ICES. For sandeel, spawning stock biomass is defined as the biomass of fish 2 years old and older as few 1 year old sandeels spawn. Because a high proportion of the stock of this short-lived fish comprises 1 year old fish, TSB is usually considerably larger than SSB but the ratio between these can be variable.
Are the sandeel TSB scenarios a suitable basis for assessing efficacy of compensation measures?
- Marine Scotland stated that, “To confidently predict the effect of compensation measures would require data at a much finer scale than SA4. For a resident species like sandeel, showing limited movement and dispersal, data at the bank level are required. This would then need to be related to sandeel availability and accessibility to the breeding seabirds of interest (considering inter alia foraging ranges). Ideally time series of age structured data at the bank level would allow the estimation of mortality for each age class of sandeel and compensation measures should result in a decrease in mortality rate of the age classes impacted by the fishery and benefiting from the compensation measures. Crucially to understand how seabirds could benefit, sandeel abundance is not sufficient to estimate efficacy, the spatial aspects and temporal availability need to be considered.”
- These data are not likely to be suitable for these analyses for a variety of reasons:
- these data are not available from ICES (these are commercially sensitive data);
- these data will not be available across all of the relevant sand banks as a time series that can be linked to species’ demography on the Isle of May or at other SPA colonies;
- the seabirds being assessed here have sufficiently long foraging ranges that they are able to visit multiple sandbanks, and there is likely to be variation in this within and between years; and
- analysis (see 1.7) showed that there is no important difference in the response of kittiwake productivity between colonies likely foraging in the sandeel box and those foraging outside the sandeel box.
- ICES will hold the catch information on sandeels in SA4 at the bank scale across multiple years, However, since this is highly sensitive commercial data it is not publicly available. For the reasons listed below, it is also unlikely to provide a useful evidence base for assessing the effects on seabird demography.
- It is clear from the catch reporting from ICES (2022) that between 2006 and 2021 fishing effort on the east of Scotland has increased ( Figure 1.34 Open ▸ ).
Figure 1.34 Sandeel fishing in ICES SA and Division 3.a. Catch by ICES rectangles from 2006–2021. The area of the circles is proportional to catch by rectangle. From ICES 2022.
- The breeding season foraging ranges of the species being assessed here are sufficiently long it is likely that they are foraging across multiple sandbanks within any one year and it is likely that they forage across multiple sandbanks in both within and between years. The available data on sandeel stock sizes that combines spatially and temporally with seabird demographic parameters occurs most usefully at the SA4 level. At smaller spatial scales the catch or stock estimation data is not available at the temporal scales needed to understand the relationships between species demography and sandeel prey availability.
- Further analyses was undertaken on the relationship between sandeel TSB in SA4 and kittiwake productivity from colonies on the east coast from the Cromarty Firth to the Farne Islands This showed that the relationship between sandeel TSB in SA4 and kittiwake productivity in SA4 occurred down the whole of the east coast and did not appears to be substantially different for colonies inside and outside the sandeel box (see 1.7).
- NatureScot noted that the range of TSB scenarios tested was useful but noted that the historic maximum biomass (about 900,000 tonnes) “should be achievable again”. We agree that this may possibly occur with suitable fisheries management in place and sufficient time for stock recovery, but there is a possibility that the historic maximum can no longer be achieved as a result of impacts of climate change and ecosystem change, as suggested by Lindegren et al. (2018) in relation to SA1r, but the same argument applies to SA4. The maximum TSB used in the scenarios was 800,000 tonnes, which is similar to the historic maximum value. It is important to note that the stock is likely to fluctuate through natural processes, which is one reason why the scenario-based approach is likely to be useful when the range of responses are considered. So, while a maximum TSB may occur in the future due to changes in fisheries management, it is unlikely to occur in every year. The reported historic TSB from the 2022 ICES report (ICES 2022) occurred in 1997 at 779,492 tonnes.
- The scenario testing approach has been used for a variety of important reasons. The future TSB in SA4 is uncertain either under the current fisheries management or future changes to fisheries management. The baseline TSB used and the predicted increases in TSB as a result of compensation measures in each scenario covers a range of plausible changes. The aim of testing a wide range of scenarios is to present of potential outcomes from most precautionary to most optimistic based on the past information on sandeel TSB in SA4. The values used have been based on the historic TSB for SA4 ( Figure 1.35 Open ▸ ). The scenarios include all of the distribution, except values below 100,000 tonnes TSB. It is important to note that the large changes in species demography occur at the lower end of the scale of sandeel TSB, and that the choice to limit the baseline scenarios to 300,000 tonnes was based on the approximate “one third for the birds” rules of thumb described by Cury et al. (2011).
Figure 1.35 Frequency distribution of sandeel TSB in SA4 from 1993 to 2021
- NatureScot also noted that the there was a discrepancy between the “current” TSB and the statement that the TSB had not been above 500,000 tonnes since 2006. This is due to the availability of data on both the SA4 TSB and return rates and productivity of the relevant species in order to study relationships between these. There were no seabird demographic data available from the Isle of May in 2020 or 2021. During the period from 2004 to 2019 the TSB did not exceed 500,000 tonnes. The ICES (2022) predictions of sandeel TSB in SA4 is provided below ( Table 1.34 Open ▸ ) to provide a complete account of predictions at the stock level.
Table 1.34 Total Stock Biomass (TSB) in SA4 from 1993 to 2021 from ICES (2022).
Are CGR and growth rates the most appropriate basis for assessing efficacy of compensation measures from PVA results?
- While NatureScot stated that, “we agree that the ratio metrics are the most sensible approach to assessing predicted change with the different scenarios” the RSPB noted that, “Greater clarity is required as to why PVAs outputs only focus on projections of growth rate and the Counterfactual of Population Growth Rate, and do not include Counterfactuals of Populations Size, which is considered the metric easiest to interpret by non-specialists”.
- The population models run are density independent, as empirical information on density dependence in the populations being modelled are considered insufficient to inform a PVA assessment. There is therefore no mechanism within the model to prevent the population size from increasing without limits. Since the comparisons being made are between the two population scenarios (impacted but no compensation vs. impacted with compensation) it is likely that this will result in very large projected population sizes from the scenarios that include compensation measures, particularly when these are based on increases in both adult survival and productivity. Thus, the counterfactual of population size will be much higher as the models are density Independence. Since the models are being projected over 50 years, this difference will be much larger than at shorter time scales. The counterfactual of growth rate is much less affected by the density independence assumptions in the model and are therefore more useful in comparing scenarios.
- Are there other SPAs that should be assessed?
- It is clear that this question required further explanation. The question was whether there are any additional SPAs, that are either predicted to be impacted or not impacted, that should be included in the assessment of the compensation measures. The question of whether impacts are not adverse will be addressed in the Report to Inform the Appropriate Assessment. A complete list of the SPAs, and features, that will be assessed, is shown in Table 1.35 Open ▸ .
Table 1.35 SPAs and the relevant qualifying features including in the sandeel fisheries compensation measures assessment.
How do we estimate the compensation ratios based on SPAs that benefit from the proposed measures but are not impacted?
- It is typical for compensation measures to provide some level of surplus compensation to account for either uncertainty in the assessment or a gap in timing between impacts occurring on European site features and compensation measures occurring, or both. This surplus compensation is measured as a compensation ratio. This is the ratio of the predicted level of impact to the Natura network to the level of compensation secured. This ratio is commonly used for measures being applied to habitats in Special Areas of Conservation (SAC), where the ratio of habitat area lost due to a project compared to the area gained through compensation measures is a simple calculation. For the combination of impacts and compensation measures on populations of mobile species this approach is unlikely to be directly replicable.
- Since the sandeel fisheries compensation measures being proposed would be very likely to have positive effects on all of the SPAs that border ICES SA4 and will be much greater that is required to offset the impacts of the proposed Development only, it is likely that there will be surplus compensation to the SPA network for the features predicted to be impacted by the Proposed Development. However, the approach to assessing the combined effects of predicted impacts and sandeel compensation measures is to compare the predicted changes in population growth rate due to impacts only and the combined impacts and compensation measures. This is also based on a range of possible future changes in sandeel TSB in SA4, as it is uncertain what the possible future change in sandeel TSB in SA4 as result of compensation measures may be.
- The simplest solution is to compare the increase in estimated number of additional birds in each SPA with connectivity to SA4 that would occur as a result of the predicted changes in sandeel TSB. This is a simple calculation based on the change in adult survival, change in adult productivity, and both of these combined (where appropriate). This should give sufficient information to estimate an approximate predicted compensation ratio.
- We do not think that the predicted difference in end population size would be a meaningful approach to take, as the density independent assumptions made in the population models are known to be violated, so modelled population sizes are able to increase with no limitations which is clearly unrealistic.
- An effective approach would be to use the calculated number of additional adult birds per annum in the population and/or the additional number of adult birds per annum in the population as a result of the increase in productivity combined with the survival to age at first breeding. This approach has the advantage that the total number of additional adult birds in the population in one year as a result of the compensation measures across the SPA network can be compared with the predicted annual losses of adult birds in the SPA network as a result of the Proposed Development. From these numbers an approximation of the compensation ratio can be calculated and therefore compared in a meaningful way between compensation scenarios. This information, combined with the CGR information across the scenario it will be possible to characterise the over-compensation even if the “compensation ratio” value is not identical to the typical approach used for habitats.
Scallop fishing and sandeels
- Both NatureScot and RSPB requested further information on how this information may be taken forward as a compensation measure. At present we do not think that there is sufficient information to include this as a compensation measure. There is considerable uncertainty in the efficacy of restricting scallop dredging in order to benefit sandeels and it would not be possible to quantitatively predict the benefits of such a measure to the qualifying features of SPAs. However, this may be developed as part of the adaptive management, allowing gathering of the relevant information to predict the benefits to SPA seabirds should the proposed measures not be sufficient, as outlined within the Implementation and Monitoring Plan.
Climate change
- In relation to the effects of climate change on the proposed compensation measures NatureScot noted, “The proposed compensation measures should cover the full operational phase of the project. Within this time, we might expect to see potential changes to sandeel distribution associated with warmer/stormier seas. If sandeel biomass reduces over time, other fisheries measures might need to be considered to make up the short fall of available prey in the later years of operation”.
- It is important to note that climate change may cause changes to the baseline conditions as well as the compensation measures. The scenarios used for assessing compensation measures is based on a wide range of baseline conditions, from a TSB of 100,000 to 300,000 tonnes. The available information on SA4 TSB shows only four years with the TSB below 100,000 tonnes between 1991 and 2021. The available evidence therefore suggests that the future sandeel TSB in SA4 is unlikely to remain this low for long periods. At this sandeel TSB the change in demographic rates is relatively large across relatively small changes in TSB. As such, relatively small increases in TSB as a result of the proposed fisheries compensation measures would have a more important difference in the demographic response compared to the baseline condition.
- The response of sandeel populations to the effects of climate change are hard to predict at the level of accuracy and precision required to enumerate the effect. Clearly if climate change were to cause a large scale reduction in sandeel abundance in the North Sea this could have an effect on kittiwake populations. However, kittiwakes do nest much further south in Europe than the North Sea and forage on other species of fish in other areas. While there may be predictions of the negative effects of climate change on sandeels, there is also a possibility of positive effects on more southerly prey species that move north with changing climate (e.g. sardines, anchovies). This is speculative and it is unknown what the potential affect this might have on kittiwake populations in the North Sea.
- The recent BTO report predicting the effect of climate change on seabirds concluded that there was a high risk of a decline by 2050 to kittiwake and puffin (a predicted decline in population size of 54% and 89% respectively) and a medium risk to guillemot and razorbill. It is important to note that as populations decline, so will their predicted impacts. This highlights the importance of climate change mitigation plans and the value of projects, including the Proposed Development, to this plan.
- Further information on climate change effects on the assessment of the baseline conditions and impact assessment for the Proposed Development are provided in Chapter 20 (Inter-related Effects) of the EIA.
[1] https://www.ceh.ac.uk/isle-may-breeding-season-summaries
[2] https://www.dw.com/en/north-sea-warming-twice-as-fast-as-worlds-oceans/a-40427339