

4 Summary and Conclusions
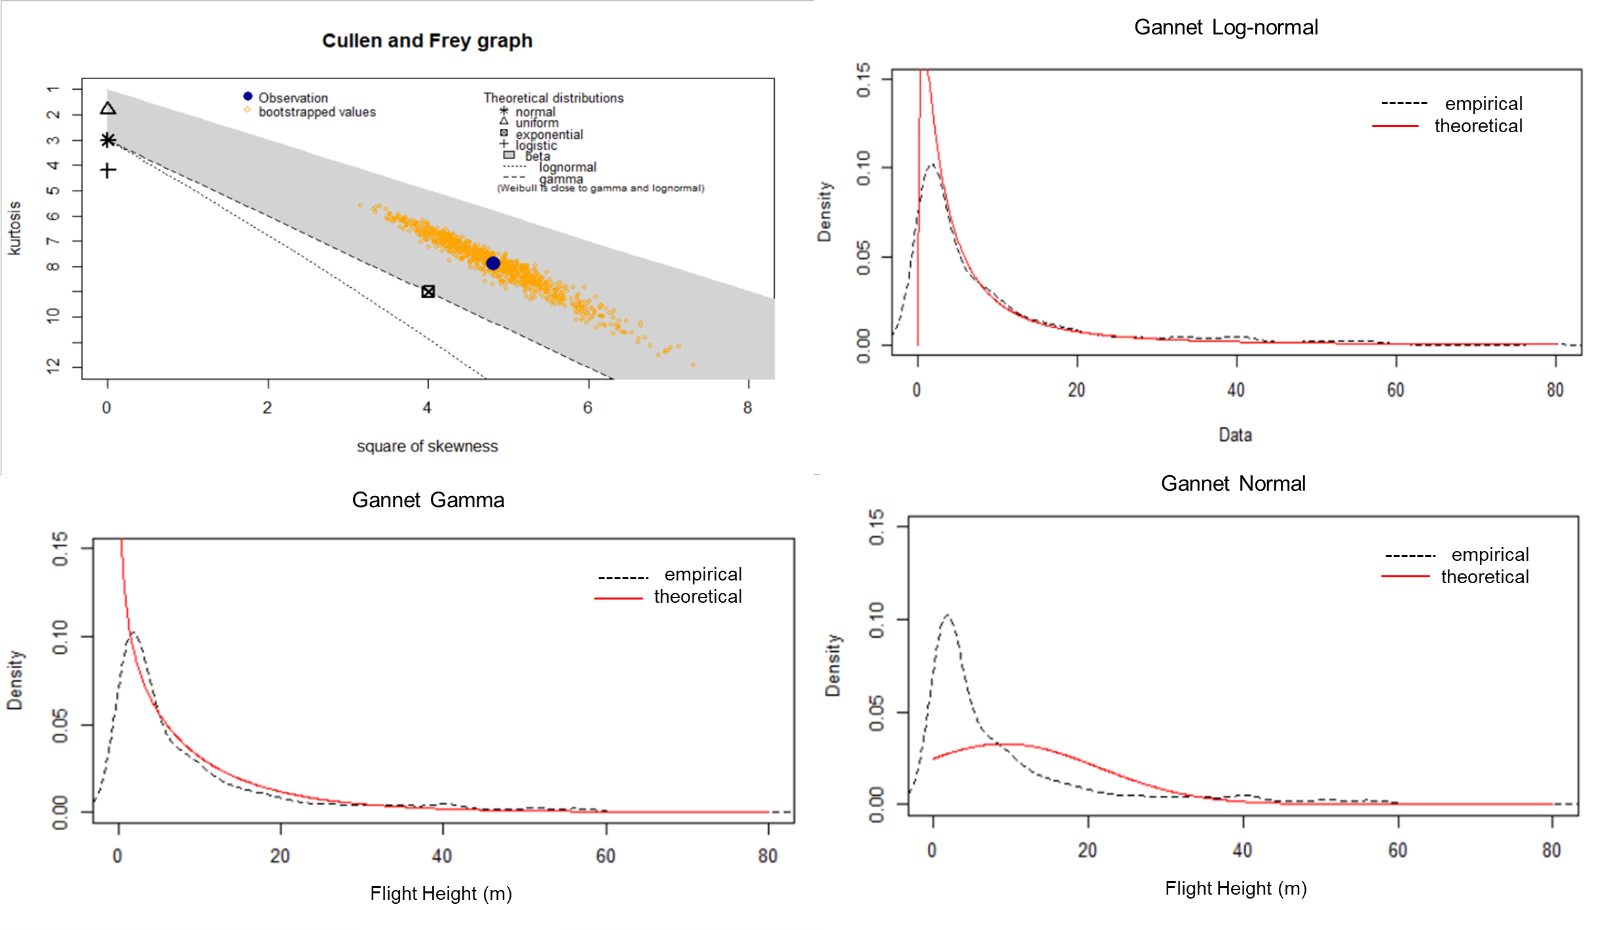
- Rangefinder flight height data collected for gannet during the 2020-2021 boat-based surveys were similar to that reported by Johnston et al. (2014). However, a slightly greater proportion of gannet were recorded flying at lower heights (< 5 m) than that reported by Johnston et al. (2014): rangefinder data estimated 54.93% of birds observed flying below 5 m, while Johnston et al. (2014) reported 46.26%. A higher proportion of birds were recorded flying within or close to the rotor swept zone of the proposed Berwick Bank turbine: rangefinder data 8.36% >30 m, 6.44% >35 m compared to Johnston et al. (2014) 4.01 % >30 m, 2.39% >35 m..
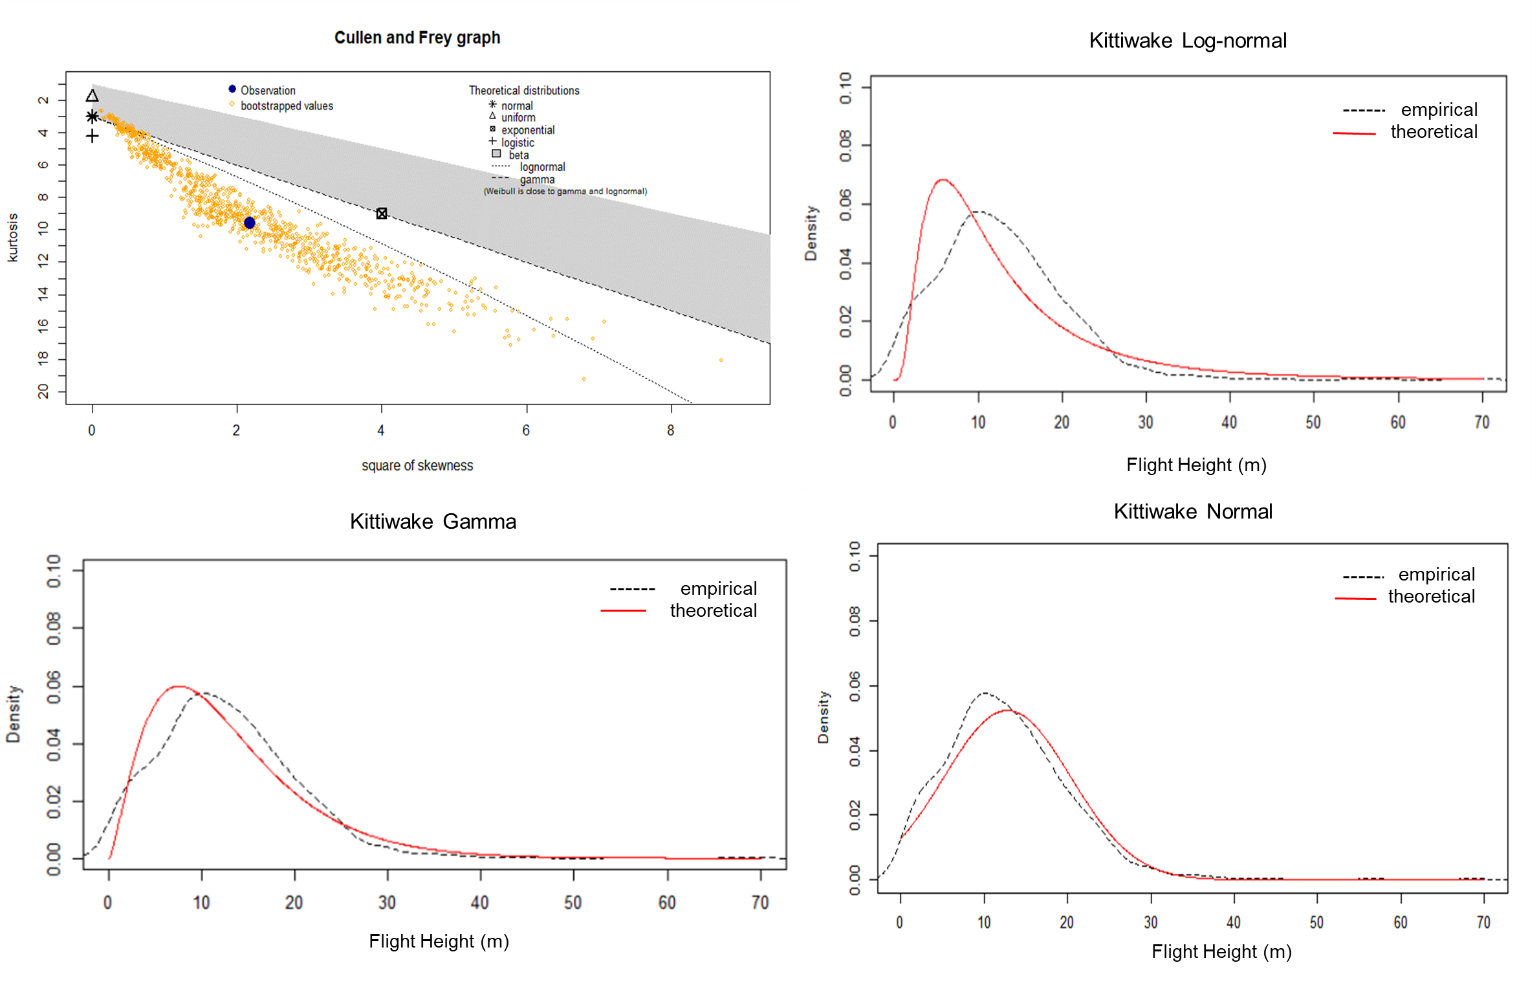
- Rangefinder flight height data collected for kittiwake differed considerably from what was reported by Johnston et al. (2014), with a lower proportion of birds observed flying within or close to the rotor swept zone of the Berwick Bank turbine: rangefinder data 2.01% >30 m, 1.01% >35 m compared to Johnston et al. (2014) 5.23 % >30 m, 3.23% >35 m.
- Visual surveyor flight height estimates recorded the lowest proportions of both gannet and kittiwake flying within or close to the rotor swept zone of the Berwick Bank turbine: gannet - 2.88% >30 m, 1.96% >35 m; kittiwake – 1.20% >30 m, 0.80% >35 m.
- There was some evidence that both gannet and kittiwake flight heights may be influenced by their position relative to the survey vessel. Although a statistical analysis has not been carried out within the scope of this report, there is indication from the observer-estimated flight heights that the closer the bird was to the boat the greater the proportion of recorded flights within height bands above 10 m; i.e. birds fly higher when close to the vessel. It could be speculated that this is because birds approaching the boat increase height relative to the boat deck to fly over or view the boat. However, the flight heights of both gannet and kittiwake as measured by the rangefinder showed a tendency to decrease closer to the survey vessel, perhaps as a reactive attraction towards the boat. An alternative explanation for the pattern seen in the observer-estimated flight height data is that observers estimated that flights are lower than their true height when flying at greater distances from the survey vessel.
- The data and analytical outputs are suitable for deriving flight heights proportions for use in the Band collision risk model, either Option 1 (proportion of birds at risk height), or Option 4 (site-specific flight height distribution).
- It is recommended that analyses of collision risk using flight height data derived from either the rangefinder or visual observer estimates are presented alongside Johnston et al. (2014) generic flight height data.
- There was no clear pattern indicating a relationship between seabird abundance and environmental data (surface temperature and salinity) collected during the surveys.
REFERENCES
Benaglia, T., Chauveau, D., Hunter, D.R., Young, D. (2009). mixtools : An R Package for Analyzing Finite Mixture Models. Journal of Statistical Software, 32: 1-29.
Buckland, S.T., Anderson, D.R., Burnham, K.P., Laake, J.L., Borchers, D.L. & Thomas, L. (2001). Introduction to Distance sampling, Estimating abundance of biological populations. Oxford University Press, Oxford: 432pp
Camphuysen, C.J., Fox, A.D. and Leopold, M.F. (2004). Towards Standardised Seabirds at Sea Census Techniques in Connection with Environmental Impact Assessments for Offshore Wind Farms in the U.K.: A Comparison of Ship and Aerial Sampling for Marine Birds, and their Applicability to Offshore Wind Farm Assessments. Report commissioned by COWRIE (Collaborative Offshore Wind Research into the Environment). Available at: www.offshorewindfarms.co.uk. Accessed June 2020.
Cleasby, I.R., Wakefield, E.D., Bearhop, S., Bodey, T.W., Votier, S.C. and Hamer, K.C. (2015). Three-dimensional tracking of a wide-ranging marine predator: flight heights and vulnerability to offshore wind farms. J. Appl. Ecol., 52, pp. 1474-1482, 10.1111/1365-2664.12529.
Cook, A.S.C.P., Ward, R.B., Hansen, W.S. & Larsen, L. (2018). Estimating Seabird Flight height using LiDAR. Scottish Marine and Freshwater Science Vol 9 No 14.
Corbeau, A., Collet, J., Fontenille, M. & Weimerskirch, H. (2019). How do seabirds modify their search behaviour when encountering fishing boats? PLoS ONE 14(9): e0222615. https://doi.org/10.1371/journal.pone.0222615
Coulson, J.C. (2011). The Kittiwake. T. & A.D. Poyser, London.
Cramp, S., Bourne, W.R.P. & Saunders, D. (1974). The Seabirds of Britain and Ireland. Collins, London.
Delignette-Muller, M.L., Dutang, C. (2015). fitdistrplus: An R Package for Fitting Distributions. Journal of Statistical Software, 64: 1-34.
Embling, C.B., Illian, J., Armstrong, E., Van der Kooij, J., Sharples, J., Camphuysen, C.J. and Scott, B.E. (2012). Investigating Fine-Scale Spatio-Temporal Predator-Prey Patterns in Dynamic Marine Ecosystems: A Functional Data Analysis Approach. J. Appl. Ecol., 49: 481-492.
Garthe, S. & Hüppop, O. (2004). Scaling Possible Adverse Effects of Marine Wind Farms on Seabirds: Developing and Applying a Vulnerability Index. J. Appl. Ecol., 41, pp724-734.
Harwood, A., Perrow, M. & Berridge, R. (2018). Use of an Optical Rangefinder to Assess the Reliability of Seabird Flight Heights from Boat-Based Surveyors: Implications for Collision Risk at Offshore Wind Farms. Journal Field Ornithology 89(4):372–383, 2018
Hill, S., Burrows, M.T. & Hughes, R.N. (2000). Increased turning per unit distance as an area-restricted search mechanism in a pause-travel predator, juvenile plaice, foraging for buried bivalves. J. Fish Biol. 2000;56: 1497–1508.
Johnston, A., Cook, A.S.C.P., Wright, L.J., Humphreys, E.M. & Burton, N.H.K. (2014). Modelling flight heights of marine birds to more accurately assess collision risk with offshore wind turbines. J. Appl. Ecol. 51: 31-41.
Lalli, C.M. & Parsons, T.R. (1997). Biological oceanography: An Introduction. Butterworth Heinemann, Oxford, pp. 265.
Miller, D.L. (2019). Distance: Distance Sampling Detection Function and Abundance Estimation. R package version 0.9.8
Miller, D.L., Rexstad, E., Thomas, L., Marshall, L. & Laake, J.L. (2019). Distance sampling in R. Journal of Statistical Software 89 (1).
Mitchell, P., Newton, S., Ratcliffe, N. and Dunn, T.E. (eds). (2004). Seabird Populations of Britain and Ireland. T & AD Poyser.
R Core Team (2020). R: A language and environment for statistical computing. R Foundation for Statistical Computing, Vienna, Austria
Seagreen Wind Energy (2012a). ES volume I. Chapter 10- Ornithology. Seagreen Wind Energy Ltd A4MR-SEAG-Z-DOC100-SPR-060: 137pp.
Seagreen Wind Energy (2012b). ES volume III (Appendices Part 2) F1- Ornithology Baseline Technical Report for Projects Alpha and Bravo & F2- Offshore Transmission Assets Project – Ornithological Technical Report & F3- Details of the risk matrix of displacement. Seagreen Wind Energy Ltd A4MR-SEAG-Z-DOC100-SPR-060: 338pp
Seagreen Wind Energy (2018). Ornithology Technical Report for Seagreen Alpha & Bravo Firth of Forth Offshore Wind Farm Development 2018. 171pp.
Tasker, M.L. Jones, P.H., Dixon, T.J. & Blake, B.F. (1984). Counting seabirds at sea from ships: a review of methods employed and a suggestion for a standardised approach. Auk, 101: 567-577.
Votier, S.C., Furness, R.W., Bearhop, S., Crane, J.E., Caldow, R.W.G. & Catry, P. (2004). Changes in fisheries discard rates and seabird communities. Nature. 2004;427: 727–730. pmid:14973483.
Wahl, T. R., & Heinemann, D. (1979). Seabirds and fishing vessels: Co-occurrence and attraction. Condor 81:390-396.
Webb, A. & Durinck, J. (1992). Counting birds from ship. In: Komdeur, J., Bertelsen, J. & Cracknell, G. (eds) Manual for aeroplane and ship surveys of waterfowl and seabirds. IWRB Special Publication No. 19, Natural Environmental Research Institute, Kalø, Denmark, pp.24-35.
Appendix 1 - Variation in fitted distributions for Gannet gannet and kittiwake rangefinder data
Kittiwake
Gannet
Appendix 2 Monthly observations during the 2020-2021 boat-based surveys
Table 4.1 Raw observations per month of all bird in Bands A-D with repeat sightings excluded
| Site 1 | Site 2 | Site 3 | Site 4 |
| ||||||||||||||||
|---|---|---|---|---|---|---|---|---|---|---|---|---|---|---|---|---|---|---|---|---|---|
Species | Jul | Aug | Apr | May | Jun | Jul | Aug | Apr | May | Jun | Jul | Aug | Apr | May | Jun | Jul | Aug | Apr | May | Jun | Total |
Auk species | 7 |
|
| 1 |
| 14 |
|
|
|
| 49 | 45 |
|
|
| 1 | 69 |
|
|
| 186 |
Sabine's Gull |
|
|
|
|
|
|
|
|
|
|
| 1 |
|
|
|
|
|
|
|
| 1 |
Arctic Skua | 1 |
|
|
| 1 |
|
|
|
|
|
| 1 |
|
|
|
|
|
|
|
| 3 |
Arctic Tern |
| 113 |
|
| 1 | 2 | 335 |
| 23 | 1 | 4 | 484 |
| 1 |
|
| 2565 |
|
|
| 3529 |
Black-headed Gull |
|
|
|
|
|
|
|
|
|
|
| 1 |
|
|
|
|
|
|
|
| 1 |
Common Gull |
| 10 |
|
|
| 1 |
|
| 1 |
|
|
| 2 |
| 1 |
| 2 |
|
|
| 17 |
Little Gull |
|
|
|
|
|
|
|
|
|
|
|
|
|
|
|
|
|
|
| 1 | 1 |
Common Tern |
|
|
|
|
|
| 1 |
|
|
|
|
|
|
|
|
|
|
|
|
| 1 |
Tern Species |
|
|
|
|
|
|
|
|
|
|
|
|
| 1 |
|
|
|
|
|
| 1 |
Curlew |
|
|
|
|
|
|
|
|
|
| 5 |
|
|
|
|
|
|
|
| 5 | 10 |
Fulmar | 21 | 58 | 32 | 12 | 20 | 11 | 31 | 71 | 15 | 32 | 9 | 47 | 40 | 6 | 26 | 22 | 41 | 30 | 31 | 17 | 573 |
Great Black-backed Gull | 3 |
| 7 |
|
| 3 |
| 20 |
|
| 3 |
| 6 |
| 1 |
| 1 | 5 |
|
| 49 |
Golden Plover |
| 1 |
|
|
|
|
|
|
|
|
|
|
|
|
|
|
|
|
|
| 1 |
Guillemot | 1158 | 122 | 132 | 387 | 802 | 1303 | 520 | 599 | 1531 | 607 | 1104 | 720 | 241 | 852 | 416 | 119 | 3498 | 456 | 118 | 648 | 15333 |
Gannet | 712 | 275 | 45 | 174 | 364 | 660 | 292 | 171 | 134 | 227 | 871 | 583 | 136 | 245 | 311 | 661 | 857 | 172 | 124 | 690 | 7704 |
Herring Gull | 89 | 3 |
| 1 | 10 | 200 |
|
|
| 4 | 182 | 1 |
| 1 | 8 | 18 | 171 |
|
| 8 | 696 |
Black-legged Kittiwake | 628 | 122 | 96 | 179 | 209 | 861 | 293 | 344 | 1509 | 213 | 684 | 785 | 1313 | 732 | 227 | 208 | 1973 | 491 | 328 | 113 | 11308 |
Lesser Black-backed Gull | 22 | 4 |
|
| 17 | 25 | 5 |
|
| 8 | 43 | 2 | 1 | 2 | 9 | 4 | 28 |
|
| 9 | 179 |
Large Gull species |
|
|
|
|
|
|
|
|
|
| 1 |
|
|
|
|
|
|
|
|
| 1 |
Manx Shearwater | 1 | 2 |
|
|
|
| 2 |
|
| 2 | 1 | 3 |
| 2 | 1 |
| 2 |
|
| 6 | 22 |
Great Skua | 1 | 1 | 1 |
|
|
| 1 |
|
|
| 1 | 4 | 1 |
|
|
| 2 |
|
|
| 12 |
Sooty Shearwater |
|
|
|
|
|
|
|
|
|
|
| 1 |
|
|
|
| 1 |
|
|
| 2 |
Puffin | 307 | 76 | 21 | 40 | 162 | 544 | 96 | 127 | 14 | 54 | 952 | 160 | 98 | 14 | 52 | 304 | 192 | 126 | 4 | 126 | 3469 |
Razorbill | 195 | 220 | 123 | 49 | 45 | 106 | 331 | 60 | 47 | 29 | 329 | 574 | 89 | 46 | 29 | 11 | 1522 | 760 | 12 | 48 | 4625 |
Redshank |
|
|
|
|
|
|
|
|
|
| 11 |
|
|
|
|
|
|
|
|
| 11 |
Swift |
|
|
|
| 2 |
|
|
|
| 1 |
| 1 |
|
|
|
|
|
|
|
| 4 |
Swallow | 1 |
|
|
|
|
|
|
|
|
|
|
|
|
|
|
|
|
|
|
| 1 |
Sedge Warbler |
|
|
|
|
|
|
|
|
|
|
|
|
|
|
|
| 1 |
|
|
| 1 |
Teal |
|
|
|
|
|
|
|
|
|
|
| 14 |
|
|
|
|
|
|
|
| 14 |
Sandwich Tern |
| 1 |
|
|
|
|
|
|
|
|
|
|
|
|
|
|
|
|
|
| 1 |
Storm Petrel | 2 | 2 |
|
|
|
|
|
|
|
|
| 1 |
|
|
|
|
|
|
|
| 5 |
Tree Pipit |
|
|
|
|
|
|
|
|
|
|
| 1 |
|
|
|
|
|
|
|
| 1 |
Meadow Pipit |
|
|
|
|
|
|
|
|
|
|
|
|
|
|
|
|
|
| 2 |
| 2 |
Turnstone |
|
|
|
|
|
| 2 |
|
|
| 1 |
|
| 1 |
|
|
|
|
|
| 4 |
Whimbrel |
|
|
|
|
|
|
|
|
|
|
|
|
|
|
| 1 |
|
|
|
| 1 |
Skylark |
|
|
|
|
|
|
| 1 |
|
|
|
|
|
|
|
|
|
|
|
| 1 |
Common Scoter |
|
|
|
|
|
|
|
|
|
|
|
|
|
|
|
|
|
| 1 |
| 1 |
Red-breasted Merganser |
|
|
|
|
|
|
|
|
|
|
|
| 1 |
|
|
|
|
|
| 1 | 2 |
Collard Dove |
|
|
|
|
|
|
| 1 |
|
|
|
|
| 1 |
|
|
|
|
|
| 2 |
Pink-footed goose |
|
|
|
|
|
|
|
|
|
|
|
|
|
|
|
|
|
|
| 2 | 2 |
Grand Total | 3148 | 1011 | 457 | 843 | 1633 | 3730 | 1909 | 1394 | 3274 | 1178 | 4250 | 3429 | 1928 | 1904 | 1081 | 1349 | 10925 | 2040 | 620 | 1674 | 47777 |