

3.5. MITIGATION MEASURES
Mitigation against effects on climate is the reduction in GHG emissions released in association with the Project, both during the construction and operation and maintenance phases. Mitigation should be applied to both the onshore Proposed Development and offshore Proposed Development where practicable.
Mitigation measures set out in Table 3-11 require consideration during the construction phase to reduce GHG emissions resulting from construction activities. However, these measures do not need to be implemented for the results and outcomes in Section 3.4.6 to be achieved. Their implementation would result in further GHG emissions savings.
Table 3-11 – Mitigation Measures During Construction
Life Cycle Module | Sub-component | Mitigation Measures |
|---|---|---|
Materials | Onshore | Reduction of materials consumption should be carried out, where possible, in line with any design changes. In addition, consideration should be given to alternative low carbon materials e.g. recycled aggregates, cement substitution etc. |
Offshore, specifically wind turbines | Low carbon alternatives should be investigated for the key bulk materials that make up the wind turbines, particularly steel, copper and fibreglass. The design team should work with the supply chain to identify possible alternative materials that could replace these key components. | |
Transport | Wind turbines, foundations | Transportation of the wind turbines and foundations should be reduced where possible. This includes reducing the distance of travel by sourcing wind turbine and foundation components from as close to the site as possible as well as minimising the number of vehicle/vessel movements required to transport each component to site. |
Materials | Transportation of materials should be reduced and/or avoided by minimising the quantity of materials required. Additionally, where possible detailed design and procurement measures should be specified to minimise the necessity to source materials from long distances. | |
Construction Processes | Construction plant use | Construction plant GHG emissions should be avoided and minimised by designing for efficient construction processes as part of design development. During construction, plant GHG emissions should be managed via the Construction Environmental Management Plan (CEMP), which should specify plant operator efficiency requirements. |
Construction water use | Construction water consumption should be minimised by designing for efficient construction processes as part of design development. During construction mains water consumption should be managed via the CEMP, which should specify reduction and reuse measures. | |
Construction waste transportation | Avoidance and reduction of waste generation and hence waste transport should be carried out in accordance with the mitigation measures outlined in the CEMP | |
Construction waste off-site processing | Avoidance and reduction of waste generation and hence off-site waste processing should be carried out in accordance with the mitigation measures outlined in the CEMP | |
Employee commuting | Local contractors should be used where possible, reducing the distance driven by employees. Public transport or low carbon options should be encouraged. |
Mitigation measures set out in Table 3-12 should be considered during the operation and maintenance phase to reduce GHG emissions resulting from operation and maintenance activities of the Project. The proposed mitigation measures do not need to be implemented for the results and outcomes in Section 3.4.6 to be achieved but to improve the results further. Several of the mitigation measures are already being considered by the Applicant.
Table 3-12 – Mitigation Measures During Operation and Maintenance
Life Cycle Module | Mitigation Measures |
Maintenance and repair | The mitigation measures detailed in Table 6-1 for the construction stage also apply to ongoing maintenance and repair. The design of the wind turbine components should be carefully considered to minimise the need for replacement. |
Operational energy use | Operational energy use within the onshore substation should be minimised by designing for use of low energy lighting, efficient heating and cooling systems, specification of controls that minimise on-time, and use of low carbon energy sources, where practicable. |
3.6. SUMMARY
The construction of the Project will contribute 6,226,793 tCO2e of GHG emissions during the construction phase. Once fully operational the Project will generate 1,412,137 tCO2e during its 35 year operation and maintenance phase, of which the vast majority (1,044,431 tCO2e) will be emitted by diverted shipping routes.
Based on the difference between the operational GHG intensity of the Project and the projected GHG intensity of marginal generation sources on the national grid for each year of operation, published by BEIS, it is estimated that the Project will save 2,951,519 tCO2e from being emitted over its lifecycle.
As the operational GHG intensity of the Project (2.8 gCO2e/kWh) is considerably lower than the projected marginal grid energy mix, the Project would directly aid both the UK and Scottish governments in meeting their carbon reduction targets.
The Project would take 8 years and 2 months to ‘pay back’ the construction phase GHG emissions from the start of operation. After this period, the Project would save 2,951,519 tCO2e from being emitted into the atmosphere by replacing conventional forms of energy generation (i.e. fossil fuels). This ‘payback’ period is in line with both governments’ net zero ambitions.
Therefore, the renewable energy generation of the Project would have a significant beneficial effect on the climate.
A cumulative assessment was completed for the Project and the Cambois connection as the implementation of the Cambois connection is determined by the implementation of the Project. The additional estimated GHG emissions from the Cambois connection (337,953 tCO2e) will result in the cumulative GHG emissions from the two projects to contribute 0.26% to any of the UK’s carbon budgets.
It is considered that these cumulative GHG emissions at no point will impact the UK Government’s ability to meet its Carbon Budgets. Therefore, the GHG emissions resulting from the cumulative assessment are considered to have a non-significant, minor adverse cumulative effect on the climate which occurs during the construction phase of both projects. The Project’s significant beneficial effect on the climate during the operation and maintenance phase is not changed when taking the Cambois connection into account, nor is the overall significant beneficial effect of the Project on the climate during its lifetime.
Without low-carbon energy generation, such as the Project, the average grid GHG intensity will not decrease as is projected, which could adversely affect the UK’s and Scotland’s ability to meet its carbon reduction targets.
4. CLIMATE VULNERABILITY
4.1. APPROACH
The IPCC describes climate vulnerability as the tendency or predisposition of a receptor to be adversely affected by changes to the climate. It therefore encompasses a variety of concepts and elements including sensitivity or susceptibility to harm and lack of capacity to cope and adapt (IPCC, 2018) .
The climate vulnerability assessment covers the Project’s design life (35 years). It is noted that it is not unusual for a development’s design life to be exceeded by its life span as many developments remain in situ after they have fulfilled their original objectives. With this in mind the climate vulnerability baseline uses long term climate projections.
4.1.1. Study Area
The Climate Vulnerability study area consists of both the onshore Proposed Development and offshore Proposed Development.
4.2. Baseline
4.2.1. METHODOLOGY TO INFORM BASELINE
Information on the current climate of the Climate Vulnerability study area was collected using the Met Office’s regional dataset of 30-year averages and data from the nearby meteorological station at Dunbar[8].
Consideration of the future climate for the Climate Vulnerability study area has been undertaken using climate projections from United Kingdom Climate Projections 2018 (UKCP18 (Met Office, 2018)). These projections have been developed by the Met Office Hadley Centre Climate Programme which is supported by BEIS and Defra. They provide the most up-to-date assessment of how the climate of the UK may change over the 21st century. The UKCP18 dataset used is Local (2.2 km) projections, the highest resolution data. UKCP18 uses a range of possible scenarios, classified as Representative Concentration Pathways (RCPs), which reflect future atmospheric concentrations of GHGs resulting from different emissions trends (IPCC, 2014). These RCPs “…specify the concentrations of greenhouse gases that will result in total radiative forcing increasing by a target amount by 2100, relative to preindustrial levels.” RCP 8.5 refers to a temperature increase of about 4.3˚C by 2100, relative to pre-industrial temperatures. Referred to as the business-as-usual scenario, and hence the worst-case scenario for climate change, this is the emission scenario used in this assessment. Other RCPs are provided in Table 4-1.
Table 4-1 – Representative Concentration Pathways (RCPs)
Name of RCP | Description | Change in Temperature (degrees Celsius) by 2081-2100 | Atmospheric GHG Concentration (parts per million) | GHG Emissions |
|---|---|---|---|---|
RCP2.6 | Peak in radiative forcing at around 3 W/m2, then decline | 1.6°C | Around 490 ppm CO2e by 2100 | Decline in the first quarter |
RCP4.5 | Stabilisation without overshoot pathway to 4.5 W/m2 | 2.4°C | Around 650 ppm CO2e by 2100 | Decline from mid-century |
RCP6.0 | Stabilisation without overshoot pathway to 6 W/m2 | 2.8°C | Around 850 ppm CO2e by 2100 | Decline in the last quarter of the century |
RCP8.5 | Rising radiative forcing pathway leading to 8.5 W/m2 | 4.3°C | Around 1370 ppm CO2e by 2100 | Rising continues until 2100 |
The local climate projections that are made available through UKCP18 are limited to RCP8.5 and two time periods (2021-2040 and 2061-2080). This precludes assessment of the changes in local climate risks over continuous time series for multiple scenarios. RCP8.5 represents the highest concentration scenario and is indicative of a mean global temperature rise of 4.3°C (range 3.2–5.4°C) by 2100. Although the latest IPCC assessment states that recent developments in climate policy and renewable energy make RCP8.5 less likely, it cannot be entirely ruled out due to uncertainties in both human actions and climate feedbacks (IPCC, 2021). Therefore RCP8.5 can be used to define a cautious worst case for climatic risks. Moreover, since the warming trajectory of RCP8.5 passes through conditions that are more representative of end-of-the-century temperature rises under lower concentration scenarios, mid-century projections under RCP8.5 can also be informative of other warming scenarios and used as a proxy for other RCPs.
The operational life of the Project is 35 years. The Climate Vulnerability assessment has considered a conservative scenario that considers the potential for operation beyond this design life horizon by using a high level of global GHG emissions up to the 2061-2080 period, based on the UK Climate Change Projections 2018 and Regional Climate Models[9].
4.2.2. Current baseline
Historic average climate data obtained from the Met Office website recorded by the closest meteorological station to the Project, Dunbar, and the East Scotland region for the 30-year climate period of 1991-2020 is summarised in Table 4-2 below. The data show that Dunbar has, on average warmer temperatures, fewer days of air frost, more hours of sunshine, and less rainfall compared to East Scotland as a whole.
Table 4-2 – Historic Climate Data for Dunbar and East Scotland, 1991-2020 [10] [11]
Parameter | Data (Dunbar) | Data (East Scotland) |
|---|---|---|
Average annual maximum temperature | 12.8°C | 11.1°C |
Warmest month on average: July | 19.1°C | 17.9°C |
Coldest month on average: January | 2.3°C | -0.3°C |
Average days of air frost per year | 24 | 82 |
Average annual sunshine (hours) | 1466 | 1283 |
Average annual rainfall (mm) | 622.1 | 1188.5 |
Wettest month on average (mm): July | 64.1 | 129.6 |
Driest month on average (mm): April | 34.3 | 72.3 |
Days of rainfall ≥ 1mm per year | 116 | 164 |
Mean wind speed at 10 m (knots) | - | 10.3 |
Mean with highest monthly wind speed on average (knots): November | - | 16.0 |
Mean with lowest monthly wind speed on average (knots): July | - | 8.5 |
The Met Office historic 30-year averages for the East Lothian region identify gradual but consistent warming across each 30-year period between 1961 and 2020 with gradual and consistent increases in rainfall.
4.2.3. Future baseline
This section presents the output of the UKCP18 climate change models that cover the Climate Vulnerability study area spanning the life of the Project’s infrastructure, anticipated to last until the 2060s (based on a 35-year operational life of the Project). This is used to describe the climate risk profile.
Projections of future temperatures, precipitation, sea levels and wind speed are provided below. As described above, data from the 2061-2080 period is used to inform the future baseline.
Temperatures
An increase in temperatures across all months in the Project area in the latter half of the 21st century is projected, with increases greatest in summer months. By 2061-2080, average temperature increases could exceed 5°C in summer months and 3°C in winter months under the high emissions scenario (RCP8.5) (Figures 4-1 and 4-2 respectively).
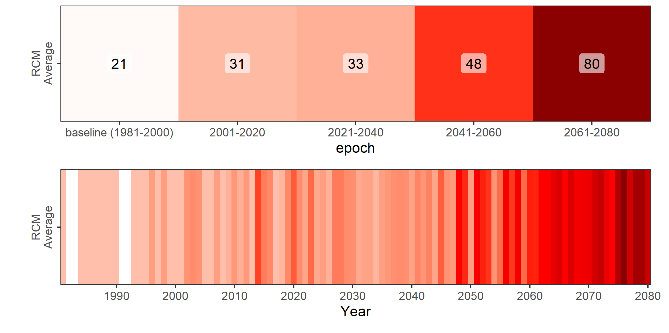
Maximum temperatures show a consistent warming trend throughout the century, with the hottest day of the year consistently exceeding 30°C by 2061-2080 under the high emissions scenario (RCP8.5), shown in Figure 4-3.
Heatwaves are defined by the Met Office as a period of at least three consecutive days with daily maximum temperatures meeting or exceeding 25°C. Heatwaves are projected to become around four times more frequent in the latter half of the 21st century. The current hottest temperature record will be surpassed, and maximum temperatures of 35°C or above are possible. Heatwaves are projected to become more frequent (Met Office, 2021), as shown in Figure 4-4.
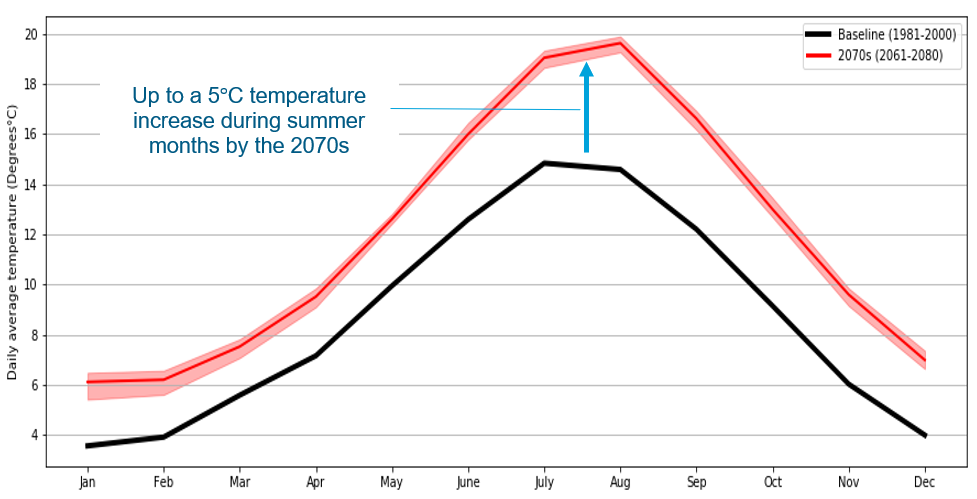
Figure 4-2 - Average Monthly Temperatures for the Baseline and Future Baseline Period Under the High Emissions Scenario
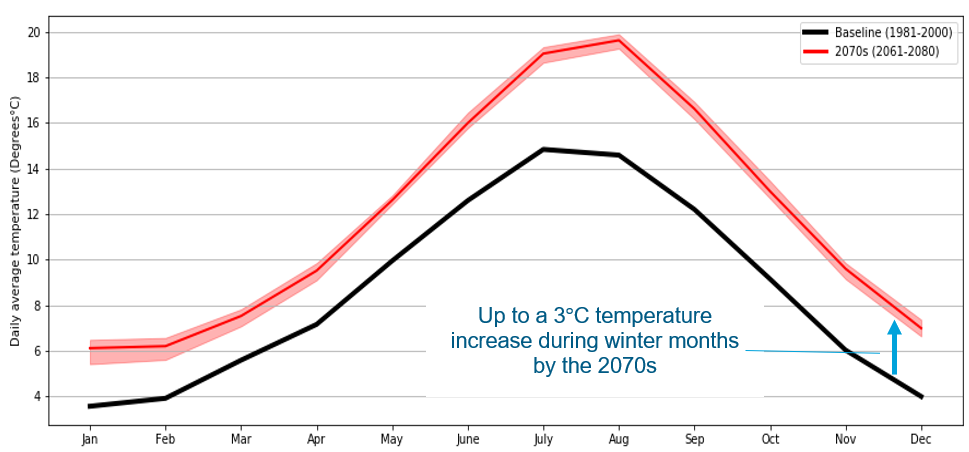
Figure 4-3 - Maximum Annual Temperature (degrees Celsius) in Edinburgh
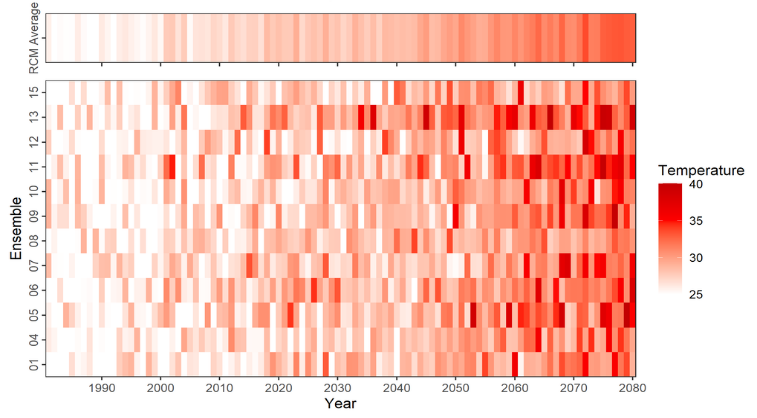
Figure 4-4 – Number of Heatwave Events (from 1990 to 2080)
Precipitation
UKCP18 projections indicate that Scottish winters will become wetter, with more heavy rainfall and a greater number of wet days, although this increase is less extreme in east Scotland than in the west. In summer months, total rainfall amounts are expected to decrease, while convectional rainfall will trigger storms between 10% and 45% more extreme than at present (Dale, 2021; Chan et al., 2022). Average summer rainfall in the Climate Vulnerability study area is projected to decrease in the coming decades, as shown in Figure 4-5, with average winter rainfall projected to increase in the latter half of the 21st century.
Summer heavy rainfall events are, however, also projected to become more extreme. This is a new finding from the latest UKCP18 ‘Local’ projections that use a 2.2 km climate model and include an improved representation of convective rainfall (the type of rainfall that drives summer storms). This is not evident in other UKCP climate products at coarser resolutions.
Local projections have been used to derive rainfall uplifts for specific storm return periods for the Climate Vulnerability study area. These are presented inTable 4-3 for the 2050s and 2070s. These uplifts demonstrate that a notable increase in storm intensity can be expected over the next 30 years, with further increases in the subsequent 20 years (Table 4-3).
Figure 4-5 - Daily Average Precipitation for the Baseline and Future Baseline Period Under the High Emissions Scenario
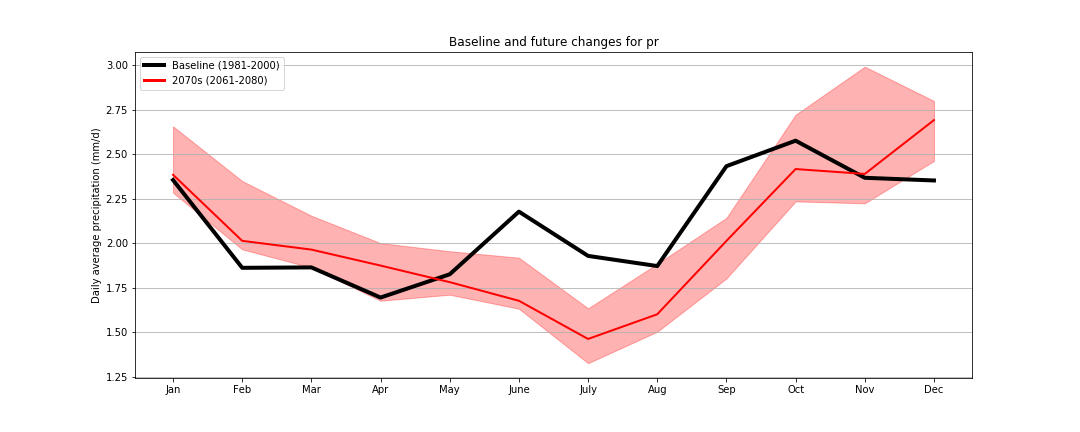
Table 4-3 – Heavy Rainfall Uplifts
Storm return period | 2050 | 2070 | ||
Central estimate (50th percentile[12]) | High estimate (95th percentile) | Central Estimate (50th percentile) | High Estimate (95th percentile) | |
50% chance annually (1 in 2 event) | 10-15% | 20-25% | 15% | 30-35% |
1% chance annually (1 in 100 event) | 15% | 30-35% | 20% | 40-45% |
Sea Levels
Sea levels around the UK rose at a rate of around 1.4 mm/year in the 20th century. This trend is projected to continue to the end of the 21st century and beyond. Rates of increase are largely independent of emissions scenarios over the next 20 years, with increases of 16-20 cm possible by 2040 relative to the 1981-2000 baseline. However, under RCP8.5, rates could increase by 38 cm by 2060 and by 62 cm by 2080 (Met Office, 2018).
Extreme sea levels are expected to increase due to the rise in mean sea level, as well as the risk of coastal flood events, but there is greater uncertainty in projecting these extreme levels. The estimated still water (the average sea level at any instance, excluding local variations due to waves) return levels are also provided for each return period. Rates vary notably in the latter half of the century, with possible increases as high as 90 cm under the high emissions scenario (RCP8.5). Figure 4-6 shows the visual representation of projected sea level rise in Edinburgh (Leith) under RCP8.5, RCP4.5 and RCP2.6. The bold lines show the 50th percentile[13] projections with the lower and upper dotted lines showing the 5th and 95th percentile[14] for each RCP.
Figure 4-6 – Sea Level Rise Rates Based on Different RCPs
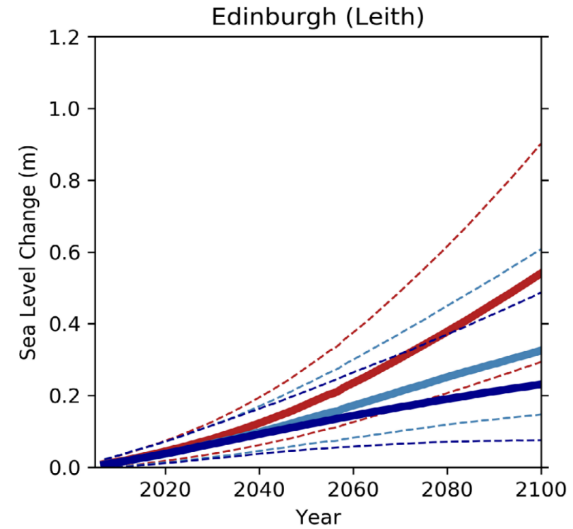
Note: Red line is RCP8.5, light blue line is RCP4.5 and dark blue line is RCP2.6
Wind Speed and Waves
Wind speeds around the UK are difficult to project; however, studies have shown that wind resources are projected to change seasonally with increases in winter and decreases in summer (Hdidouan, & Staffell, 2017). The latest UKCP18 global projections indicate an increase in near surface wind speeds over land over the UK during the winter season for the second half of the 21st century accompanied by an increase in frequency of winter storms over the UK. However, the increase is small when compared to interannual (year-to-year) variability (Met Office, 2019).
Waves in climate models are driven by the winds of the atmospheric model, where typically, the global model winds drive the seas well in open water in oceans like the Atlantic and in sea basins like the North and Baltic Seas. The challenges lie in coastal regions where high-resolution winds and better representation of the local coastline and bathymetry are needed. With current scientific understanding and uncertainty, it is difficult to ascertain changes in wave climate.
4.3. ASSESSMENT METHODOLOGY
4.3.1. GUIDANCE
The Climate Vulnerability assessment has been undertaken in accordance with IEMA (2020) Environmental Impact Assessment Guidance for Climate Change Resilience & Adaptation assessment.
4.3.2. IMPACTS TO BE ASSESSED
The climate hazards scoped in and those not progressed for further assessment are provided in Table 4-4. Further details about the potential impacts that the scoped in climate hazards could cause are provided later in Section 4.4.
Table 4-4 – Climate Hazards Scoped Into Assessment or Not Progressed for Further Assessment
Climate Hazard | Scoped In/ Not Progressed for Further Assessment |
|---|---|
Storms and high winds | Scoped In – impacts are relevant for wind turbines, offshore substation platforms, foundations and vessels during construction and operation and maintenance |
Extreme temperature events | Scoped In – impacts are relevant for workers during construction and operation and maintenance |
Soil stability and subsidence | Scoped In – impacts are relevant for onshore infrastructure |
Sea level rise / flooding | Scoped In – impacts could affect construction as well as assets during their operation |
Changing temperature (chronic) | Not progressed for further assessment – small changes in future temperatures are not expected to affect the Project |
Cold wave / frost | Not progressed for further assessment – short term impacts from colder temperatures are not expected to affect the Project |