

1. Introduction
A baseline noise survey was undertaken to characterise the existing noise climate within the onshore development area of Berwick Bank Wind Farm Onshore Substation (OnSS). Sensitive receptor locations in the vicinity of the onshore development area were agreed with East Lothian Council (ELC). Figure 1 shows the survey locations. Surveys were undertaken between 7th and 20th May 2021 and between 25th June and 5th July 2021.
A total of six sensitive receptor locations were agreed as part of consultation. This Technical Note details the baseline noise survey approach as well as quantifying the existing acoustic environment within the onshore development area.
Baseline survey measurements were conducted in accordance with current guidance, including British Standard (BS) 4142:2014+A1:2019 Method for rating and assessing industrial and commercial sound and BS 7445:2003 Description and measurement of environmental noise and the methodology used was agreed with relevant stakeholders during consultation.
Sound level meters (SLM) were fully calibrated, traceable to UKAS standards and satisfied the requirements of BS EN 61672-1:2013 for a ‘Class 1’ Sound Level Meter (SLM).
Measurements were undertaken during favourable weather conditions, i.e. with windspeed <5m/s and no precipitation.
2. Survey Results
2.1 Onshore Substation Study Area
The onshore substation study area encompasses the proposed substation locations, and the nearest sensitive receptors.
Measurements were conducted at six substation receptor locations (SSRs), details of which are shown in Table 1 and on Figure 1.
Table 1 – Baseline Noise Monitoring Locations
Receptor Identifier | Address (Nearest) | OSGB Coordinates (X, Y) |
|---|---|---|
SSR1 | Lawfield Cottage | 375087, 672993 |
SSR2 | Railway Cottage | 373565, 674743 |
SSR3 | Crowhill Farm Cottages | 373637, 674105 |
SSR4 | Thornton Mill | 374154, 674095 |
SSR5 | Blackberry Farm, 6 Thorntonloch Holdings | 374075, 673738 |
SSR6 | 12 Thorntonloch Holdings | 374341, 673712 |
At the six substation receptor locations continuous logging equipment was installed for up to two weeks and unattended measurements were taken in fifteen-minute reference interval periods. This approach ensured representative, repeatable background noise measurements were obtained of the existing soundscape and followed best practice in accordance with guidance contained within BS4142:2014+A1:2019.
Samples of LA90 were cross referenced against weather data recorded on site during the corresponding measurement period. All samples influenced by adverse weather conditions (representative environmental noise measurements should be undertaken during favourable weather conditions, i.e. with windspeed <5m/s and no precipitation) were considered unsuitable for noise monitoring due to noise interference and have been removed from the final results.
Statistical analysis (following guidance in BS4142:2014+A1:2019) methods have been applied to the resulting data sets in order to assess the background noise levels with a greater degree of scrutiny.
Table 2 through to Table 13 contain a summary of the long term measured baseline noise data within the onshore substation study area at the six receptor locations, respectively.
Graphical outputs of the statistical analysis and the time series used for determining representative LA90 (background) noise levels at each long-term measurement location are included in Chart 1 to Chart 18.
2.1.1 SSR1 Lawfield Cottage
Surveyor observations at SSR1 during the installation and decommissioning of equipment noted that the noise climate was affected predominantly by natural sounds such as wind rustling vegetation and bird calls. Activities at the farm adjacent to the property were occasional contributors, as were infrequent vehicles passing on the road to the northwest.
Table 2 – Baseline Noise Data Analysis, SSR1 Daytime
Period | Date | Average, dBLA90,15min | Mode, dBLA90,15min | Standard Deviation |
|---|---|---|---|---|
Daytime | 25th June to 5th July 2021 | 34 | 31 | 4.8 |
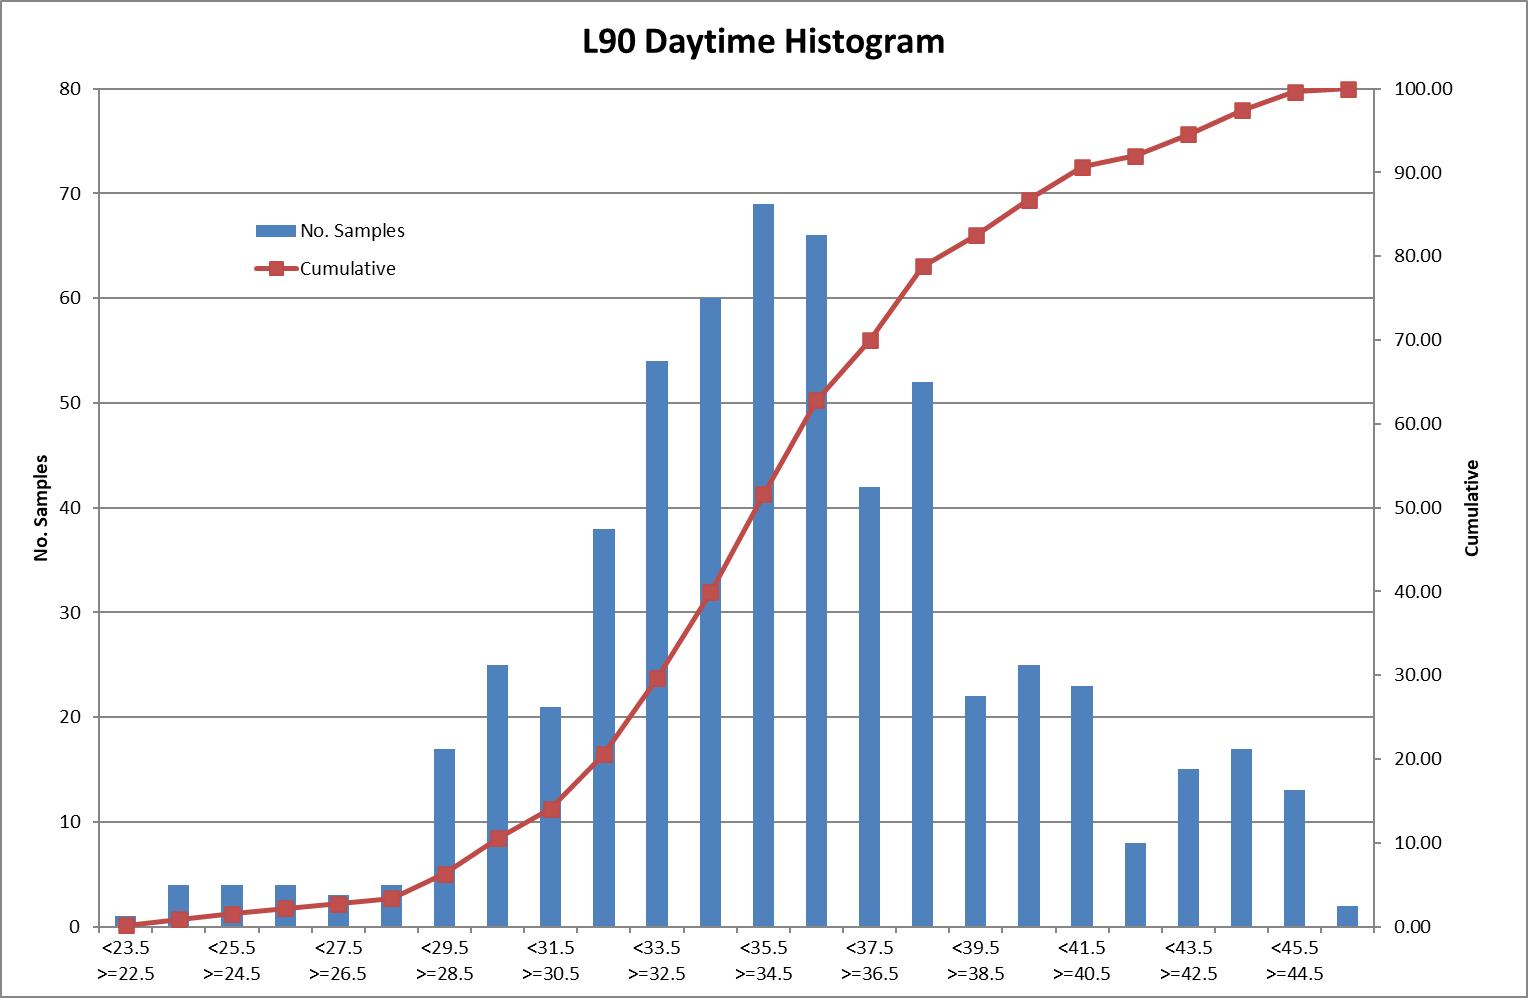
Chart 1 – Baseline Noise Data Cumulative Distribution, SSR1 Daytime
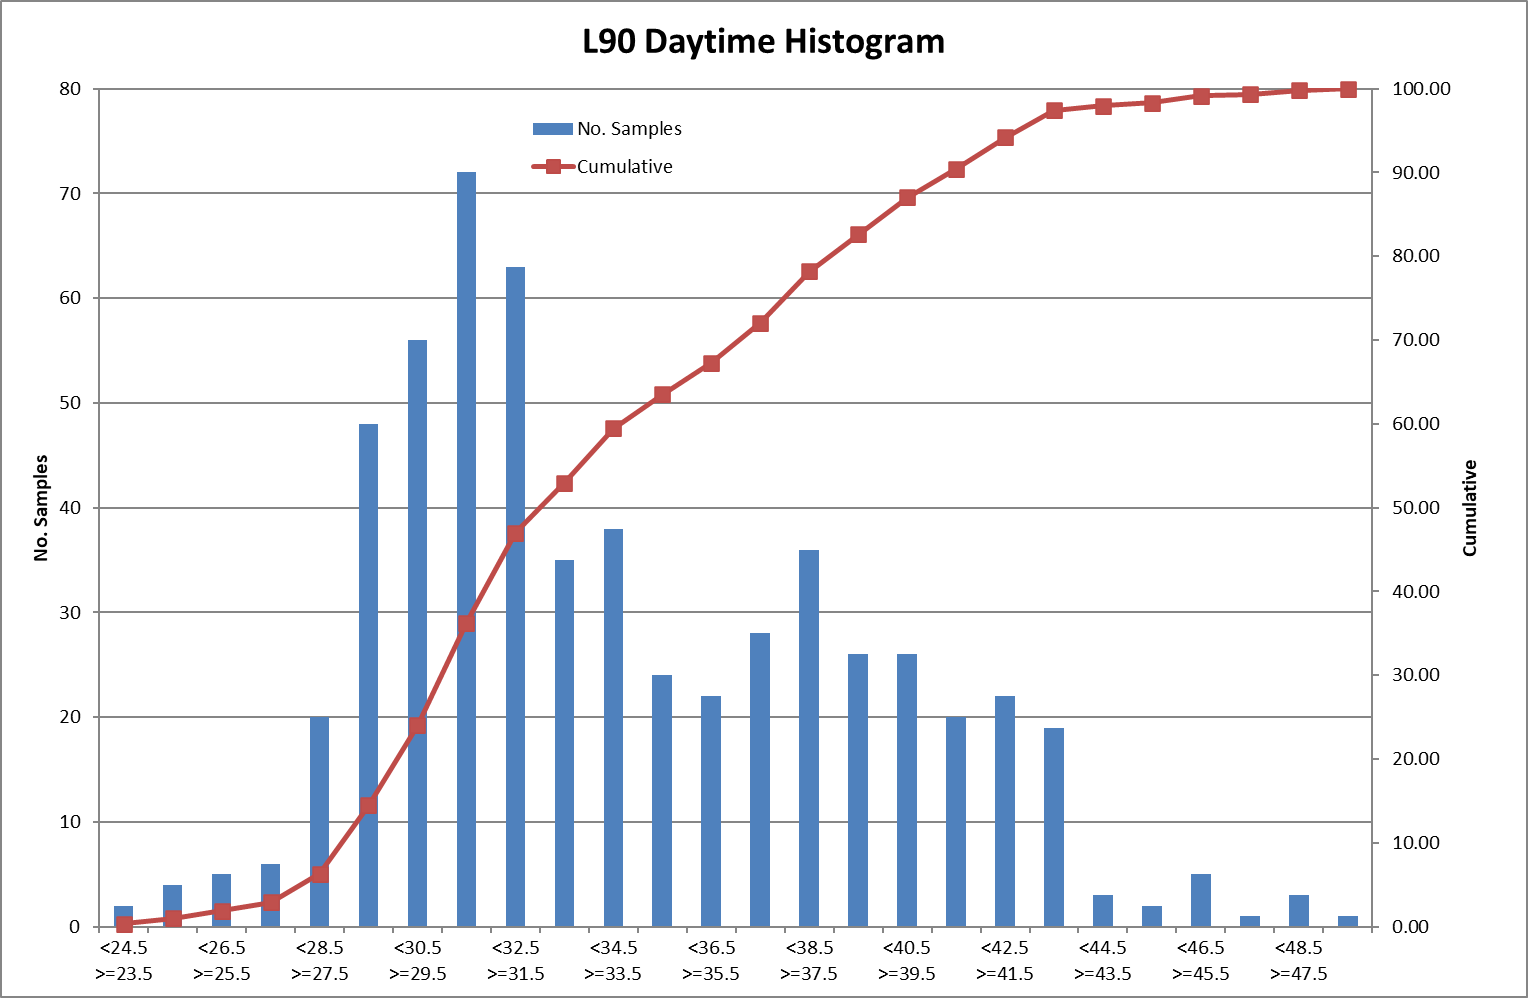
In Chart 1 the data follows a distribution curve that is skewed from the normal with a greater distribution in the lower half of the curve. There is a clear modal value at 31 dB; given the curve is skewed towards this modal value, 31 dB was chosen as the representative daytime LA90.
Table 3 – Baseline Noise Data Analysis, SSR1 Night-time
Period | Date | Average, dBLA90,15min | Mode, dBLA90,15min | Standard Deviation |
|---|---|---|---|---|
Night-time | 25th June to 5th July 2021 | 32 | 32 | 5.0 |
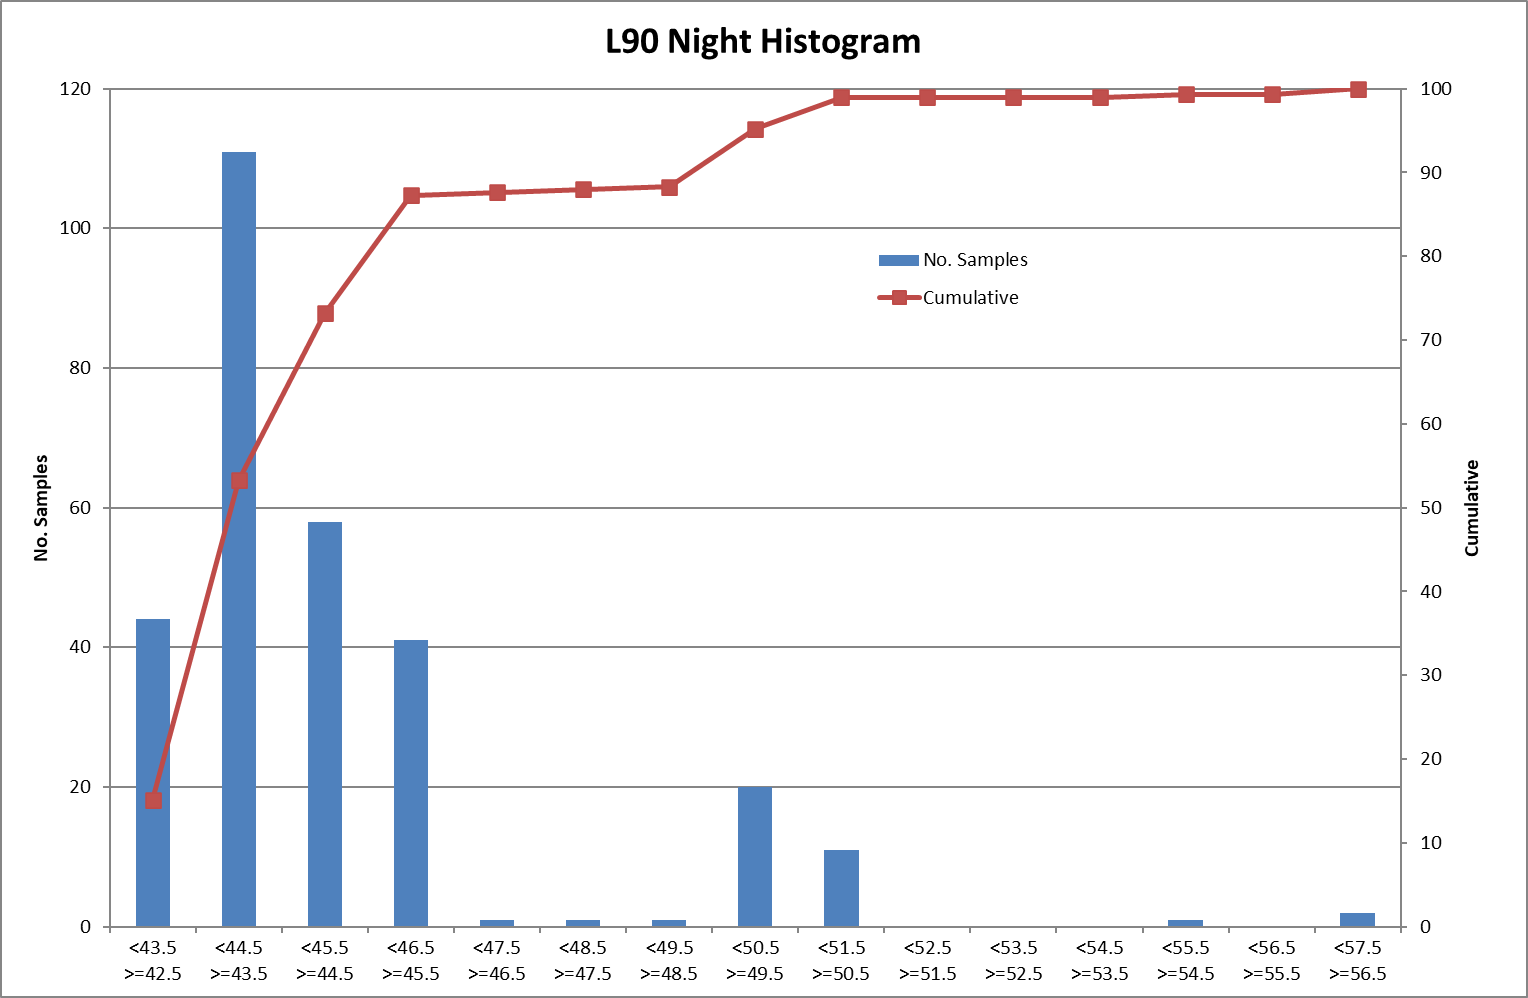
Chart 2 – Baseline Noise Data Cumulative Distribution, SSR1 Night-time
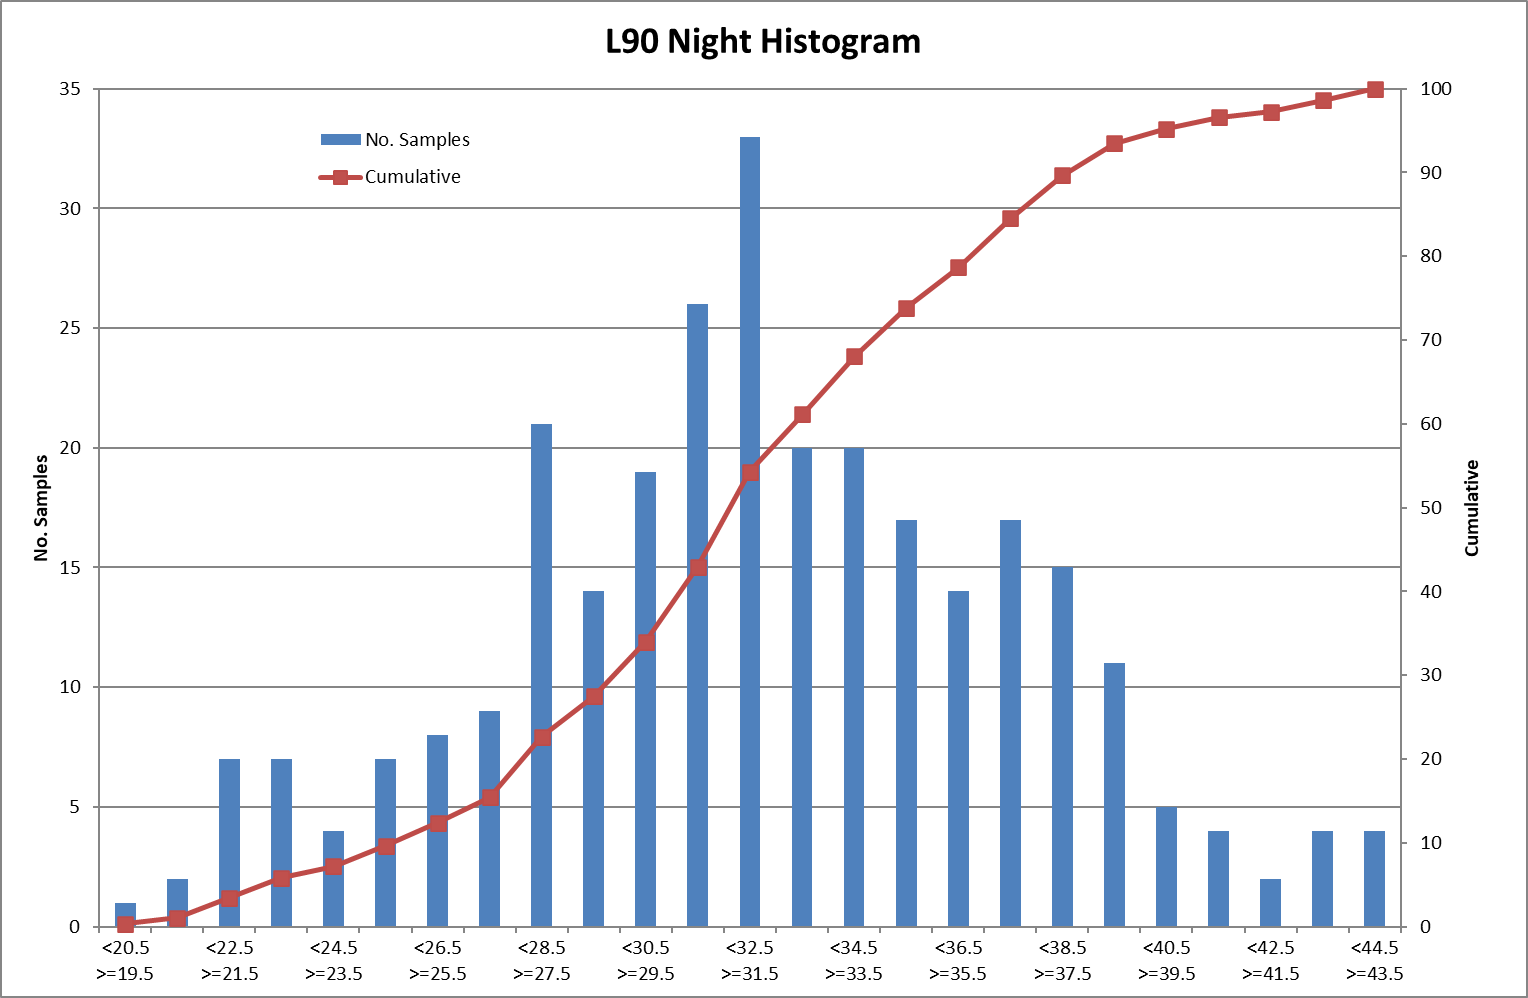
Chart 3 – LA90,15min, Windspeed and Rainfall, SSR1
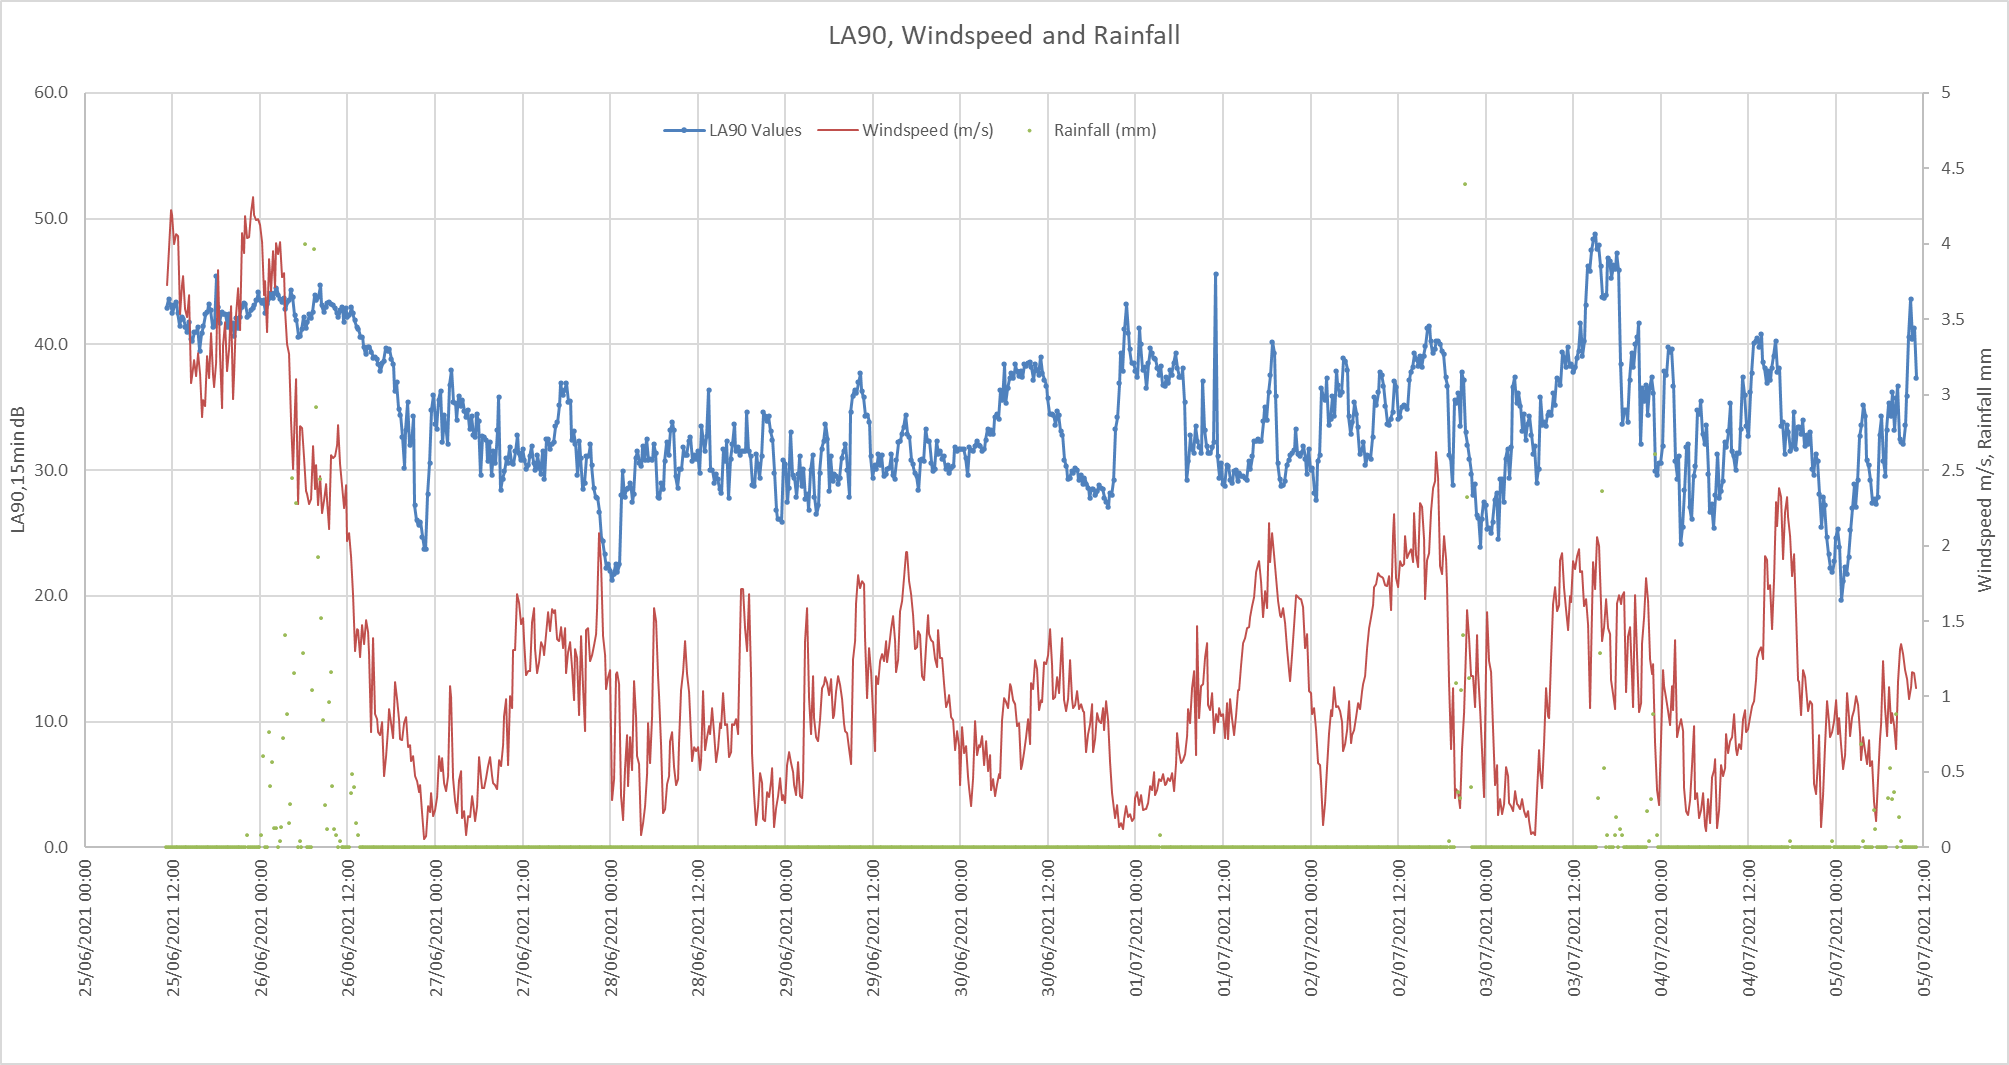
Chart 3 shows that measured wind speeds throughout the survey period were below 5 m/s, and therefore meet the requirements of BS4142. Measured background noise levels show little correlation with wind speed at lower wind speeds, but a closer correlation at higher wind speeds. Heavy rainfall events correlated with elevated background noise levels, however, little rainfall occurred during the survey.
2.1.2 SSR2 Railway Cottage
Surveyor observations at SSR2 noted that the noise climate was affected predominantly by continuous road traffic on the A1 and intermittent train passes on the East Coast Mainline adjacent to the property. Natural sounds, such as bird calls and barking dogs, were occasional contributors.
Table 4 – Baseline Noise Data Analysis, SSR2 Daytime
Period | Date | Average, dBLA90,15min | Mode, dBLA90,15min | Standard Deviation |
|---|---|---|---|---|
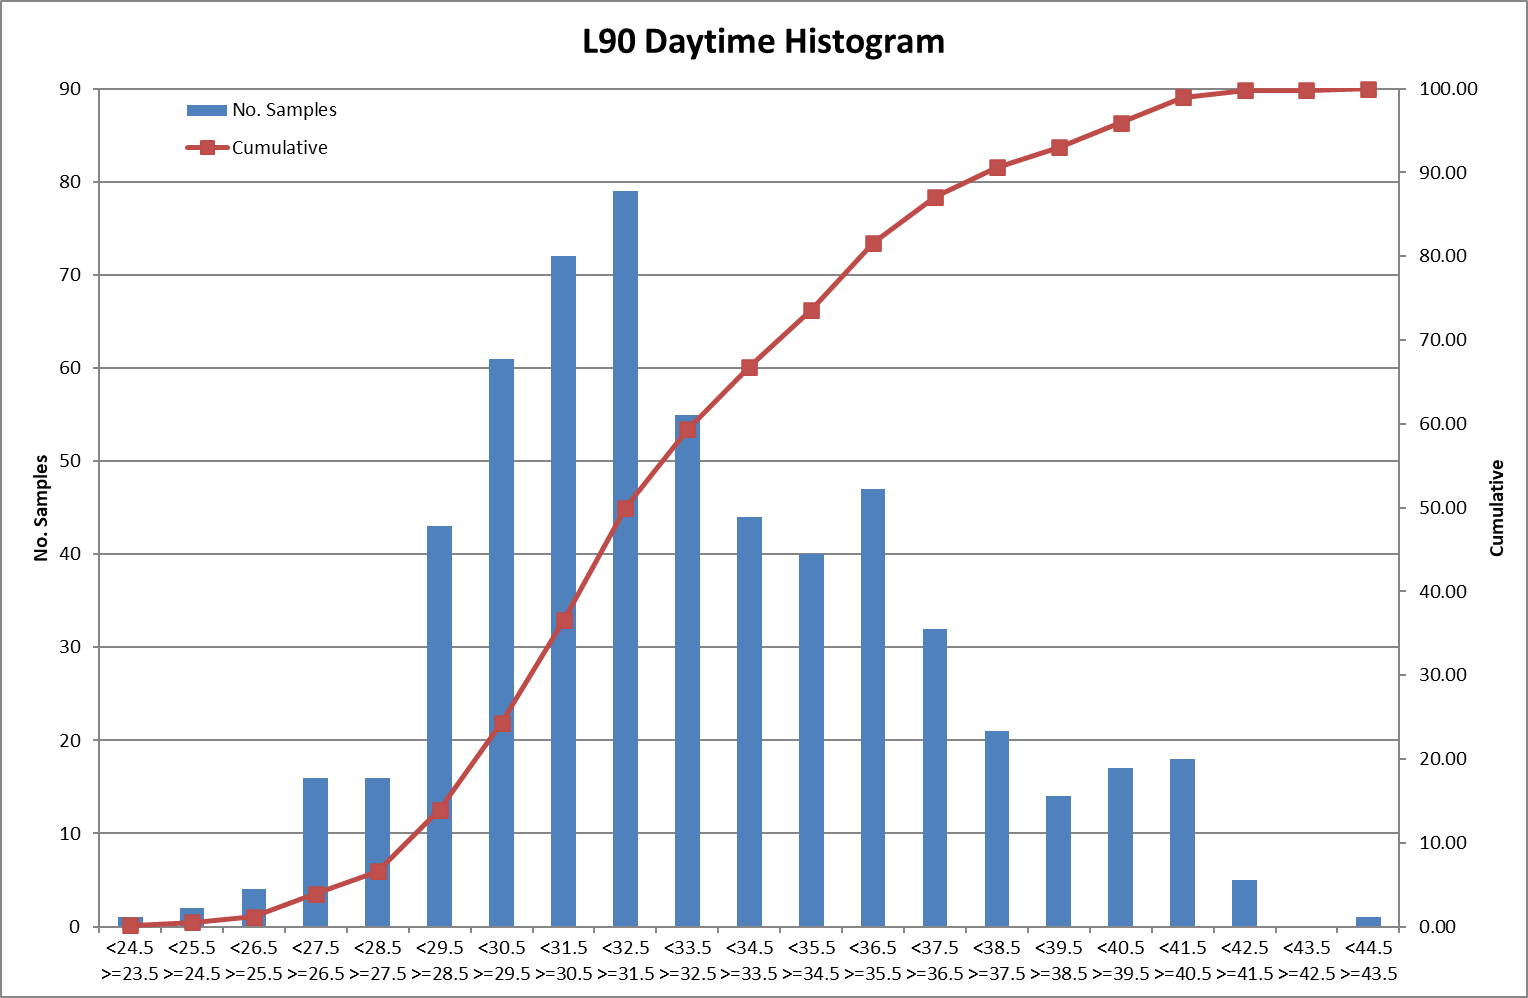
Daytime | 25th June to 5th July 2021 | 46 | 48 | 6.3 |
Chart 4 – Baseline Noise Data Cumulative Distribution, SSR2 Daytime
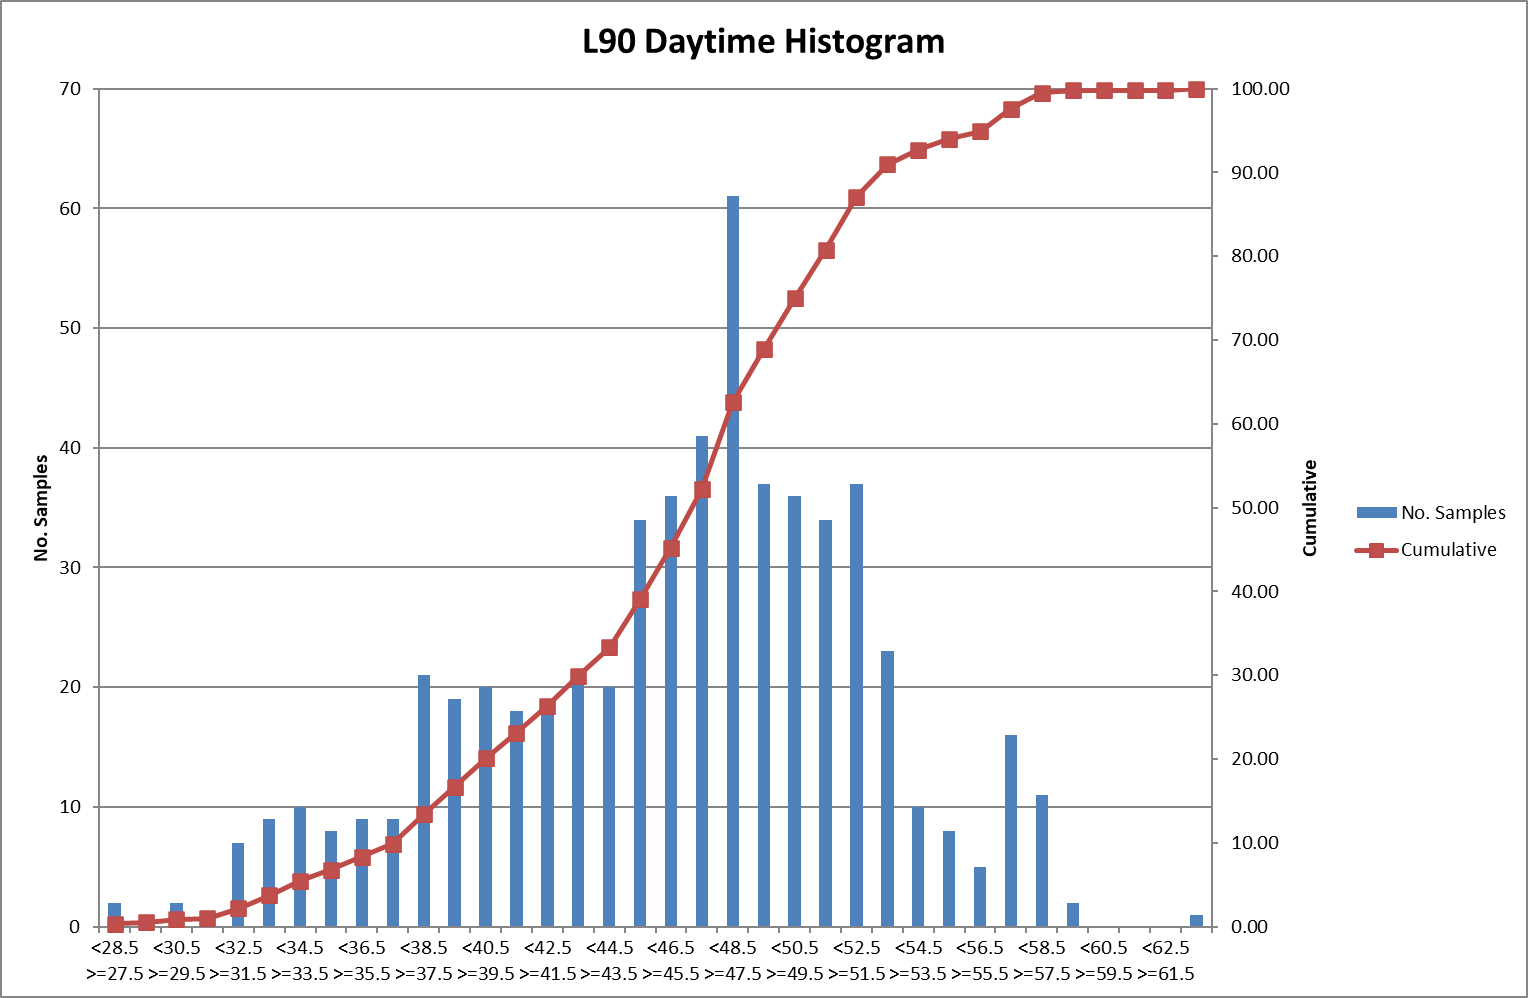
Whilst the modal peak appears at 48 dB, the data displays a slightly skewed normal distribution, with the modal peak appearing to the higher end of the cumulative distribution. A large proportion of the samples are clustered around this modal peak in the range 45 dB to 53 dB. The lower end of this range, 45 dB, was chosen as the representative daytime LA90.
Table 5 – Baseline Noise Data Analysis, SSR2 Night-time
Period | Date | Average, dBLA90,15min | Mode, dBLA90,15min | Standard Deviation |
|---|---|---|---|---|
Night-time | 25th June to 5th July 2021 | 35 | 31 | 5.6 |
Chart 5 – Baseline Noise Data Cumulative Distribution, SSR2 Night-time
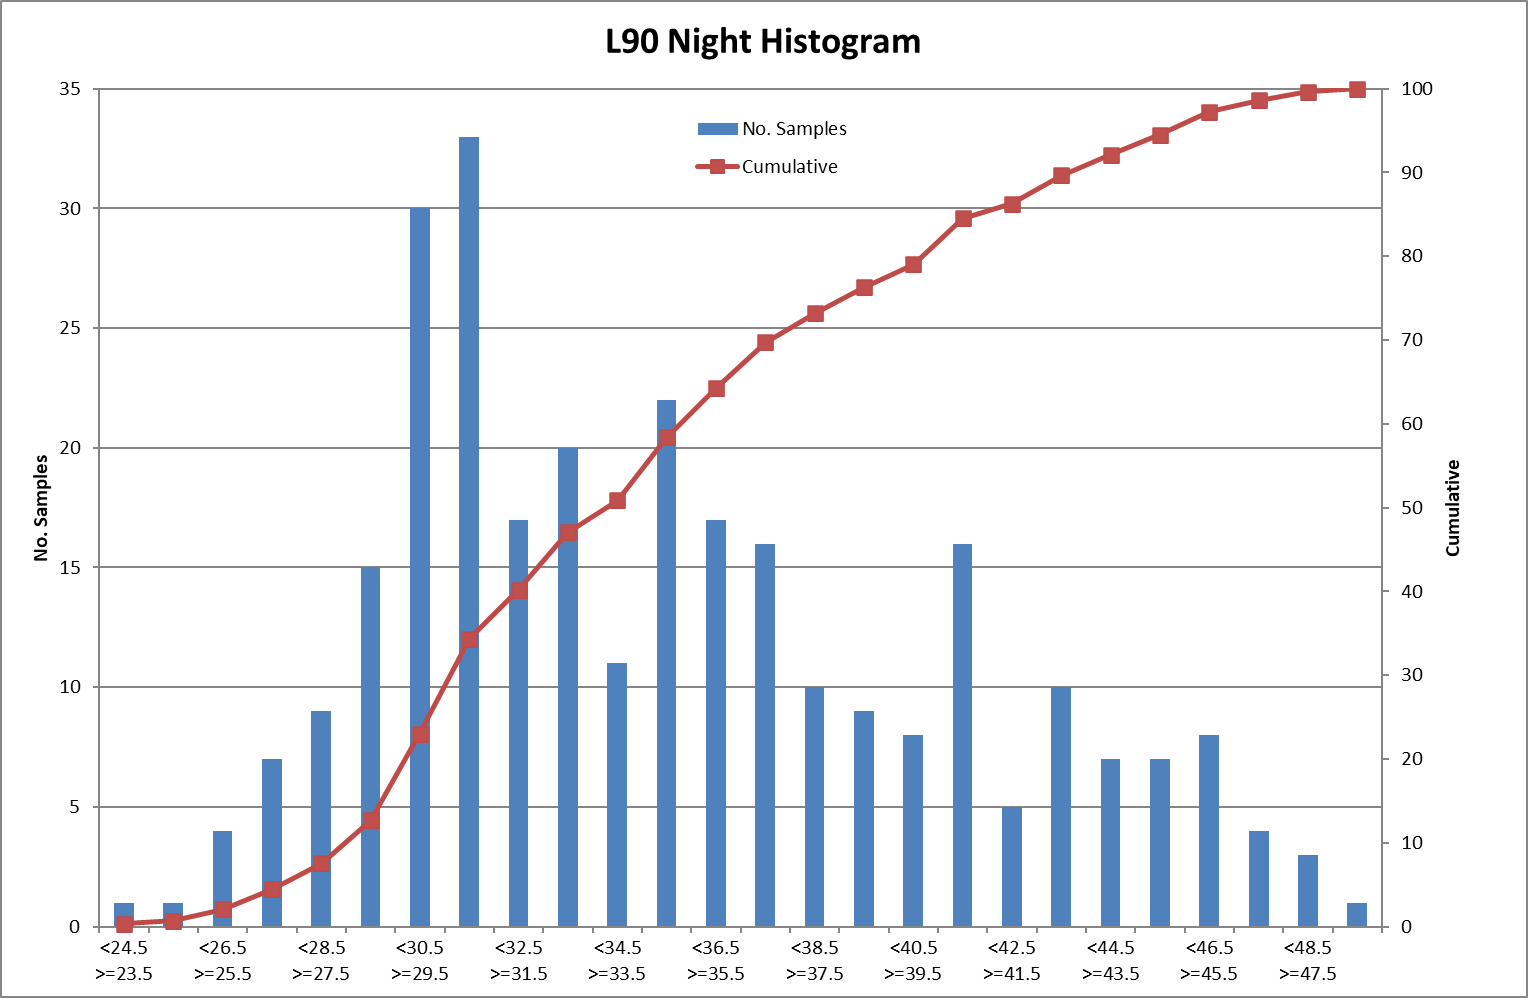
A modal peak appears at 31 dB, with a secondary, lesser peak at 30 dB. Whilst these are at the lower end of the cumulative distribution the peaks are quite prominent and, therefore, in this instance, the secondary modal value of 30 dB has been chosen as the representative night-time LA90.
Chart 6 – LA90,15min, Windspeed and Rainfall, SSR2
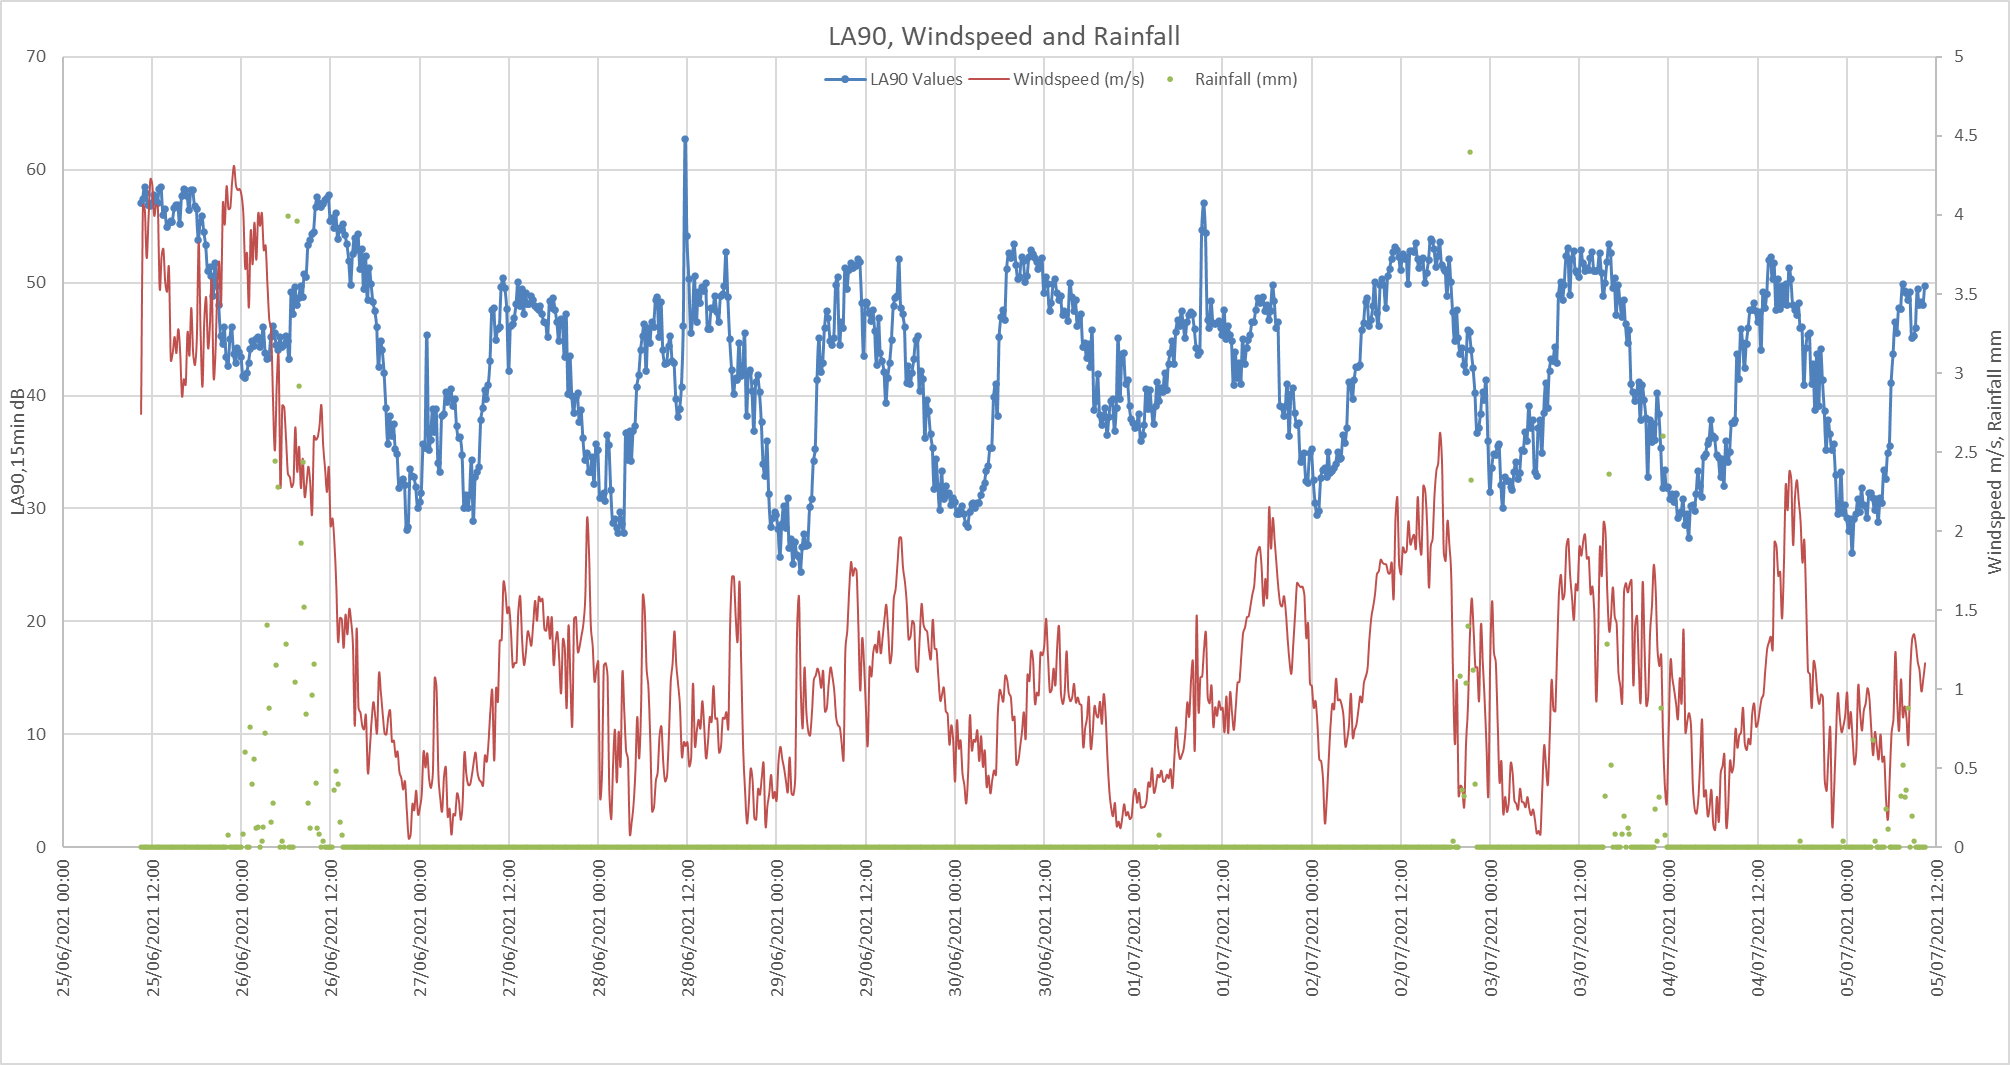
Chart 6 shows a strong diurnal pattern at SSR2 with the noise climate dominated during the day by continuous traffic on the A1 and intermittent trains passing. There is also evidence of a correlation with windspeed, at both lower and higher windspeed. During the night, as the transport noise sources subside, background levels drop considerably.
2.1.3 SSR3 Crowhill Farm Cottages
Surveyor observations at SSR3 noted that the noise climate was affected predominantly by continuous, distant road traffic on the A1 and intermittent train passes on the East Coast Mainline. Natural sounds, such as wind rustling vegetation, were also contributors. Lesser contributions came from nearby residential premises and infrequent vehicles passing through the village.
Table 6 – Baseline Noise Data Analysis, SSR3 Daytime
Period | Date | Average, dBLA90,15min | Mode, dBLA90,15min | Standard Deviation |
|---|---|---|---|---|
Daytime | 25th June to 5th July 2021 | 33 | 32 | 3.6 |
Chart 7 – Baseline Noise Data Cumulative Distribution, SSR3 Daytime
A modal peak appears at 32 dB, with a secondary and tertiary peak at 31 dB and 30 dB respectively. Whilst these are at the lower end of the cumulative distribution the peaks are quite prominent and, therefore, in this instance, the secondary modal value of 31 dB has been chosen as the representative daytime LA90.
Table 7 – Baseline Noise Data Analysis, SSR3 Night-time
Period | Date | Average, dBLA90,15min | Mode, dBLA90,15min | Standard Deviation |
|---|---|---|---|---|
Daytime | 25th June to 5th July 2021 | 29 | 31 | 3.4 |
Chart 8 – Baseline Noise Data Cumulative Distribution, SSR3 Night-time
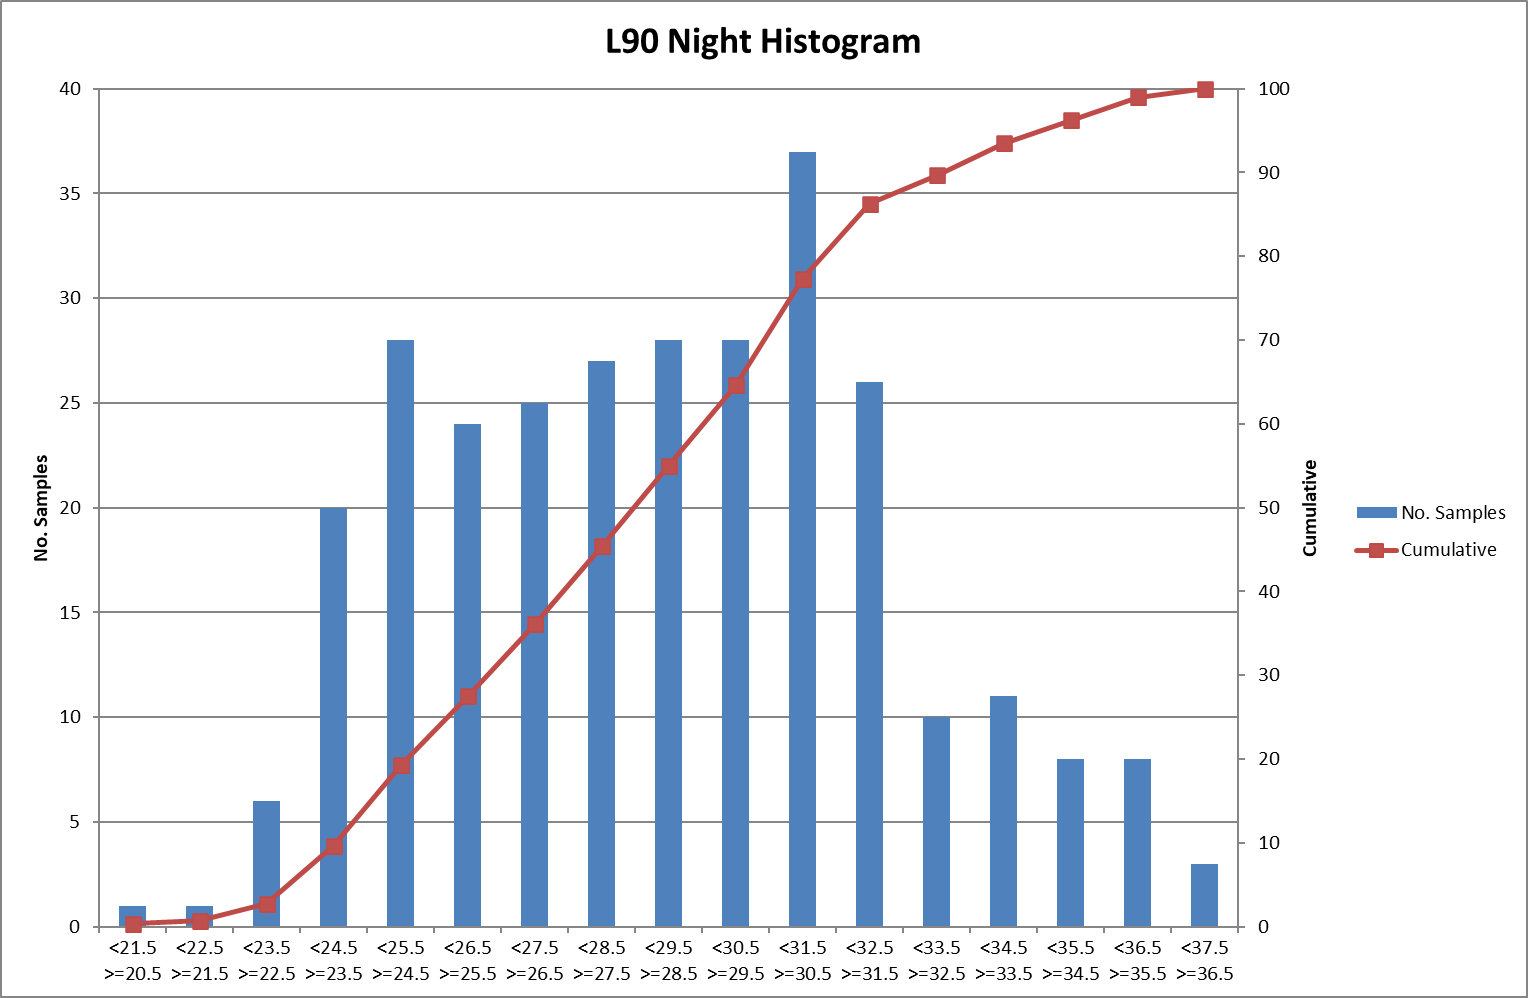
Whilst the modal peak appears at 31 dB, the data does not display a classic normal distribution, with the modal peak appearing to the higher end of the cumulative distribution. A secondary modal peak appears towards the lower end of the cumulative distribution, at 25 dB. A value of 28 dB, corresponding to a mid-point between the primary and secondary modal peaks was chosen as the representative night-time LA90.
Chart 9 – LA90,15min, Windspeed and Rainfall, SSR3
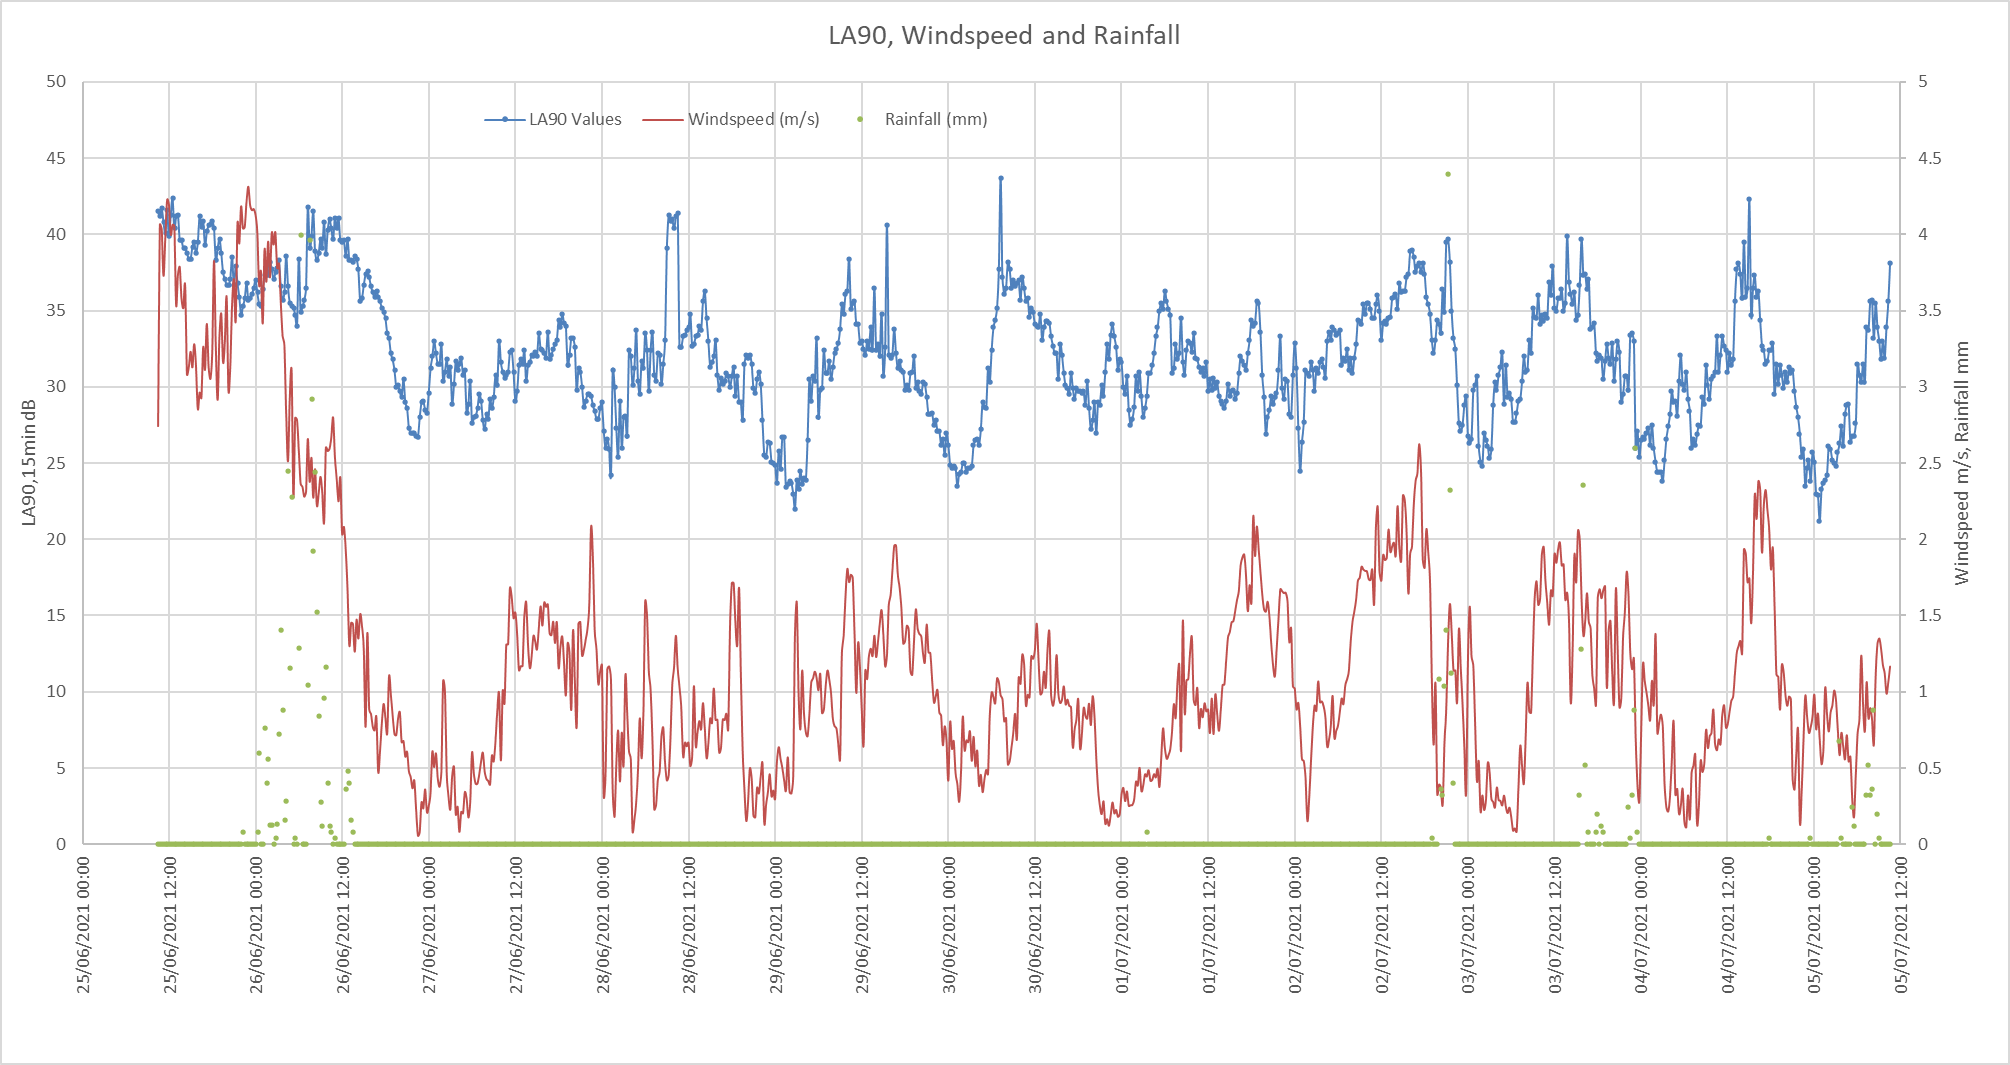
Chart 9 shows background levels following a diurnal pattern, indicative of the village location of this property and the influence of anthropogenic noise sources such as passing vehicles and noise from residents. The background levels also show correlation with windspeed.
2.1.4 SSR4 Thornton Mill
Surveyor observations at SSR4 noted that the noise climate within the garden/external amenity area was affected predominantly by continuous noise from the watercourse/burn to the edge of the garden. Lesser contributions came from wind-blown vegetation, distant road traffic on the A1 and intermittent train passes on the East Coast Mainline. Aircraft were noted passing overhead during the survey set-up.
Table 8 – Baseline Noise Data Analysis, SSR4 Daytime
Period | Date | Average, dBLA90,15min | Mode, dBLA90,15min | Standard Deviation |
|---|---|---|---|---|
Daytime | 25th June to 5th July 2021 | 46 | 44 | 2.5 |
Chart 10 – Baseline Noise Data Cumulative Distribution, SSR4 Daytime
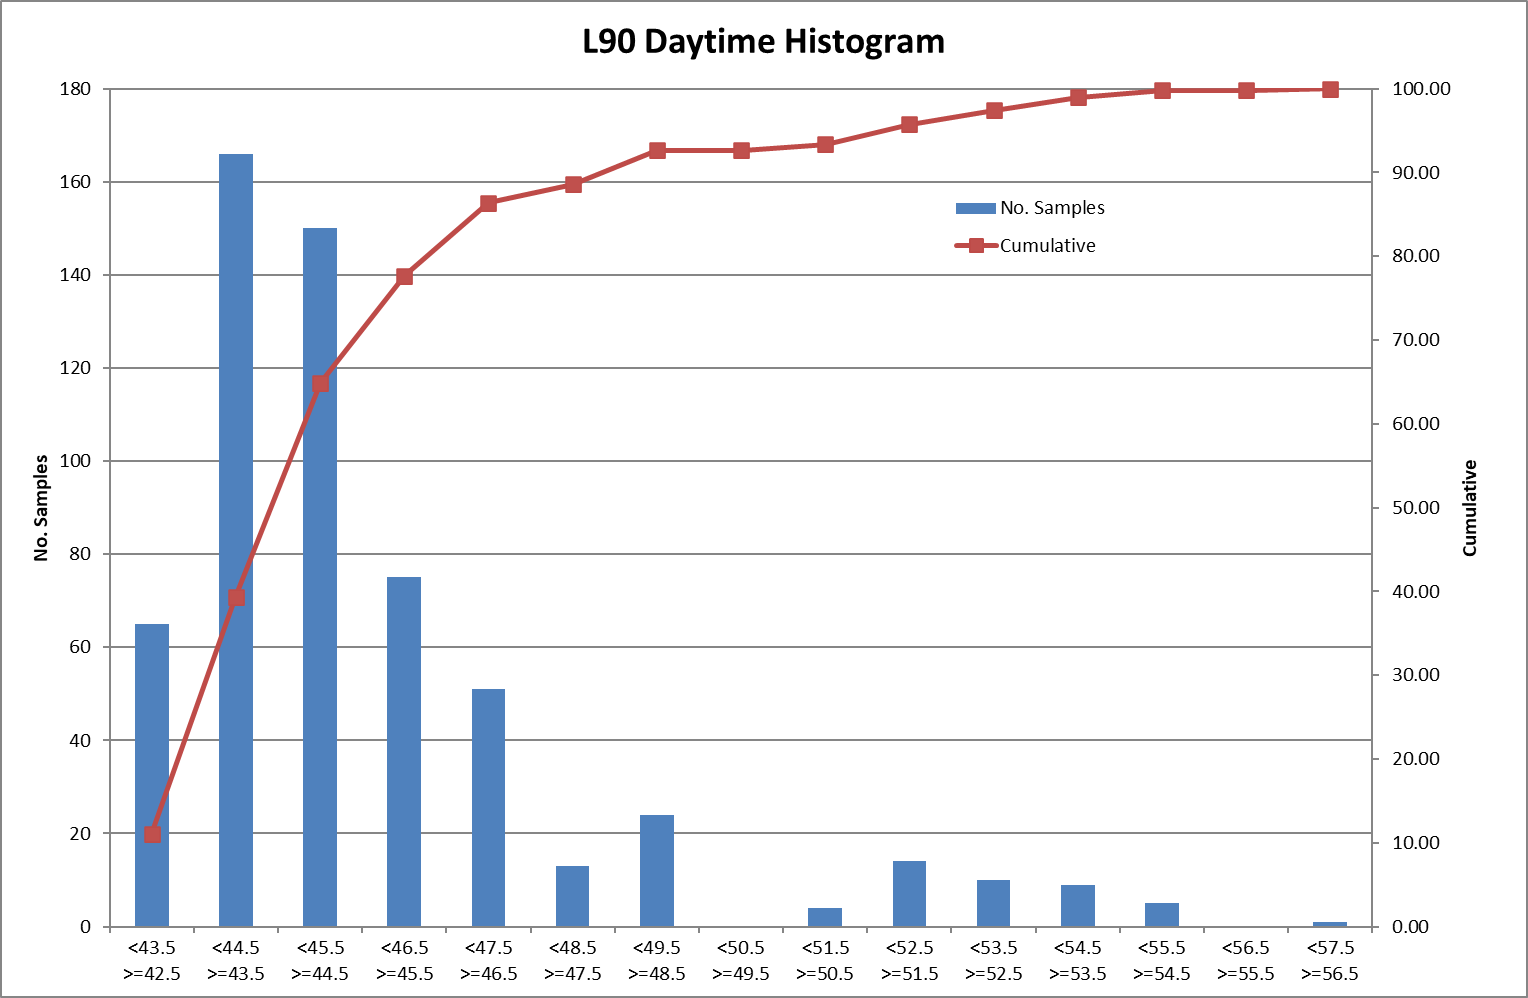
Table 9 – Baseline Noise Data Analysis, SSR4 Night-time
Period | Date | Average, dBLA90,15min | Mode, dBLA90,15min | Standard Deviation |
|---|---|---|---|---|
Night-time | 25th June to 5th July 2021 | 45 | 44 | 2.4 |
Chart 11 – Baseline Noise Data Cumulative Distribution, SSR4 Night-time
An atypical distribution is evident in the data at SSR4 and a very clear modal peak at 44 dB during both daytime and night-time. The receptor was noted to have a burn running at the edge of the property’s garden area, and the watercourse is considered the dominant noise source at this location and the determinant factor in the LA90.
Whilst a representative LA90 of 44 dB is appropriate for this property, for both daytime and night-time, the property can only be considered in isolation and will not be taken as representative of any other receptor.
Chart 12 – LA90,15min, Windspeed and Rainfall, SSR4
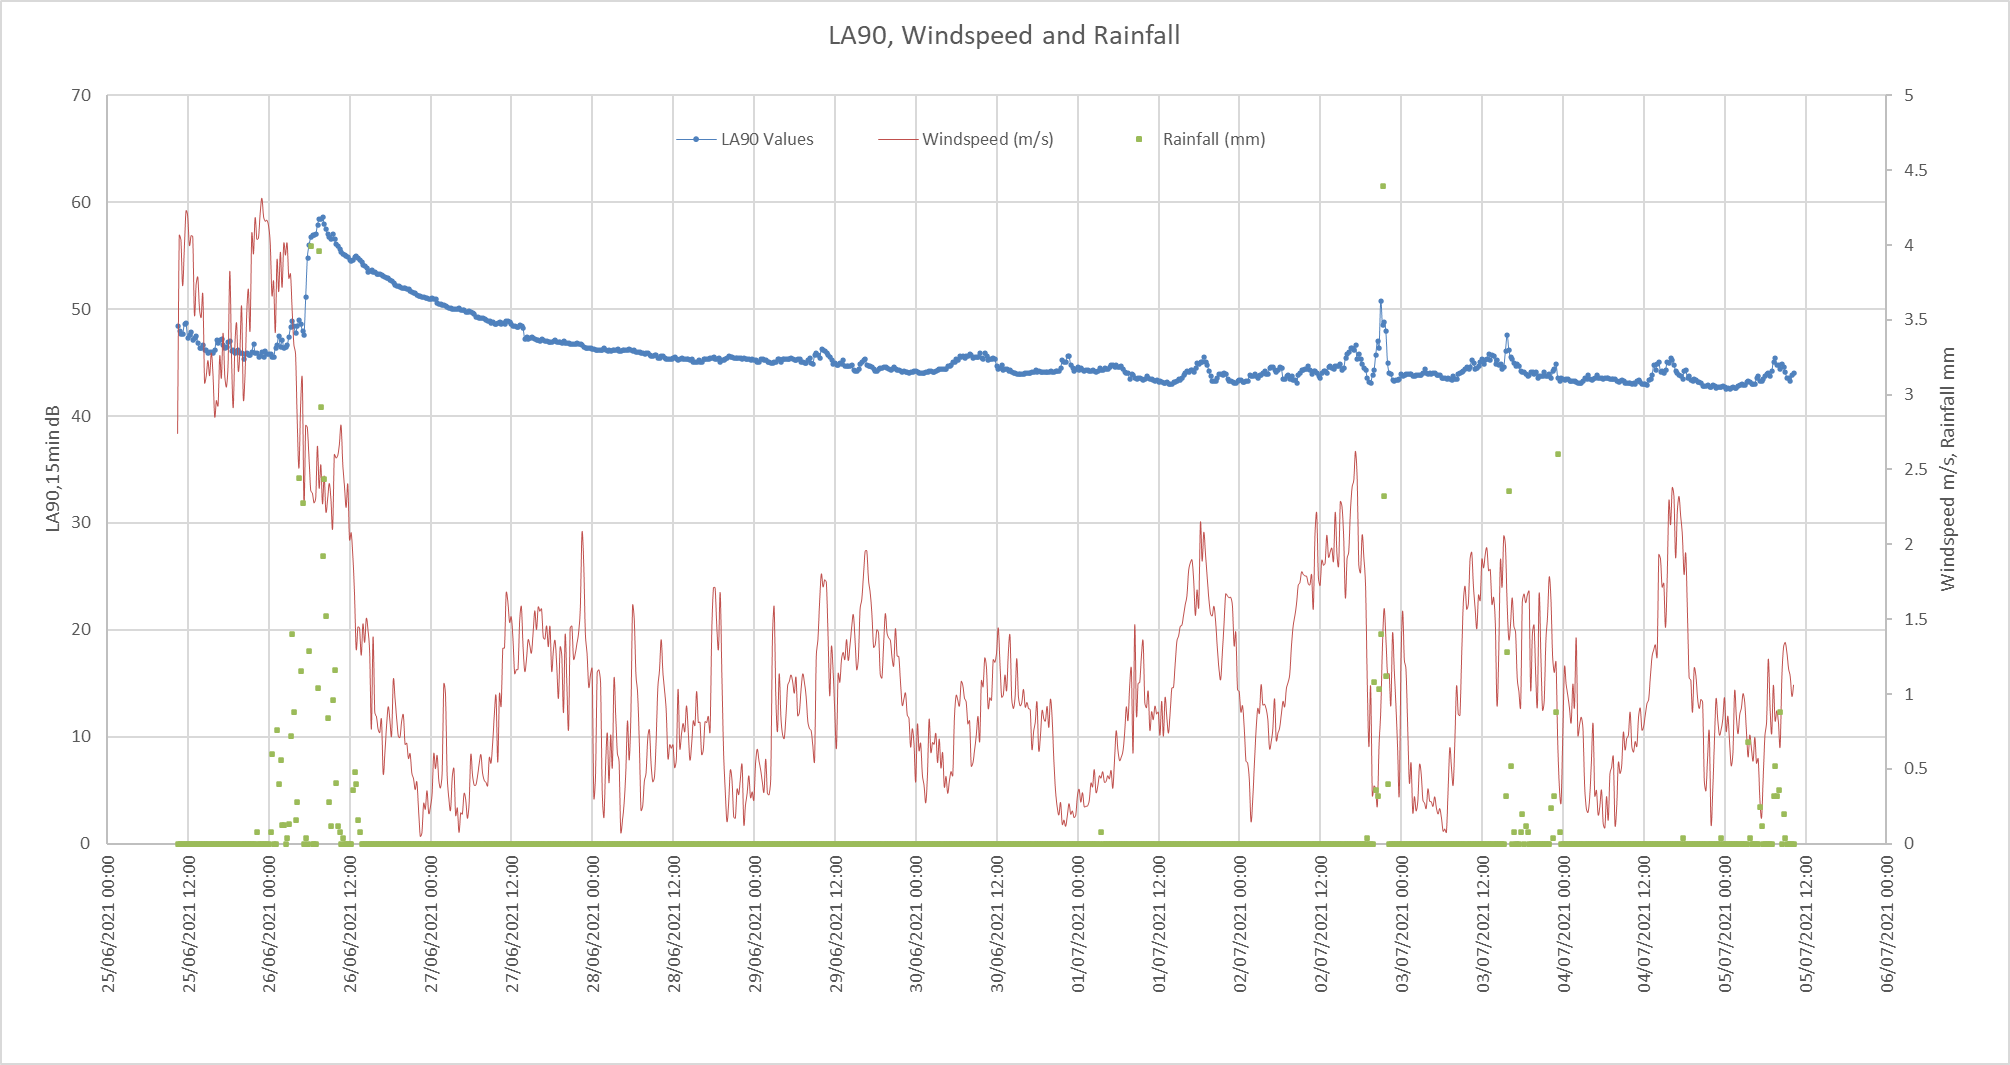
Measured background noise levels were fairly constant throughout the survey, attributed to the dominance of noise from the watercourse. Higher noise levels occurred during and shortly after a period of heavy rainfall on 26th June, consistent with resultant higher flow within the watercourse. Watercourse noise returned to ‘dry conditions’ levels by 28th June. Smaller increases of shorter duration occurred following rainfall events later in the survey.
2.1.5 SSR5 Blackberry Farm
Surveyor observations at SSR5 noted that the noise climate was affected predominantly by natural sounds such as wind rustling vegetation, bird calls, barking dogs and noise from livestock (hens) at the farm. Lesser contributions came from distant road traffic on the A1 and intermittent train passes on the East Coast Mainline.
Table 10 – Baseline Noise Data Analysis, SSR5 Daytime
Period | Date | Average, dBLA90,15min | Mode, dBLA90,15min | Standard Deviation |
|---|---|---|---|---|
Daytime | 25th June to 5th July 2021 | 36 | 35 | 4.2 |
Chart 13 – Baseline Noise Data Cumulative Distribution, SSR5 Daytime
In Chart 13 the modal peak during the daytime is seen at 35 dB. With reference to Chart 15 (below), the background noise level during the daytime period is subject to considerable variance, occasionally dropping below 30 dB, often above 40 dB but more usually between 32 dB and 36 dB. A value of 34 dB was considered to be the representative daytime LA90 in this instance.
Table 11 – Baseline Noise Data Analysis, SSR5 Night-time
Period | Date | Average, dBLA90,15min | Mode, dBLA90,15min | Standard Deviation |
|---|---|---|---|---|
Daytime | 25th June to 5th July 2021 | 31 | 31 | 4.8 |
Chart 14 – Baseline Noise Data Cumulative Distribution, SSR5 Night-time
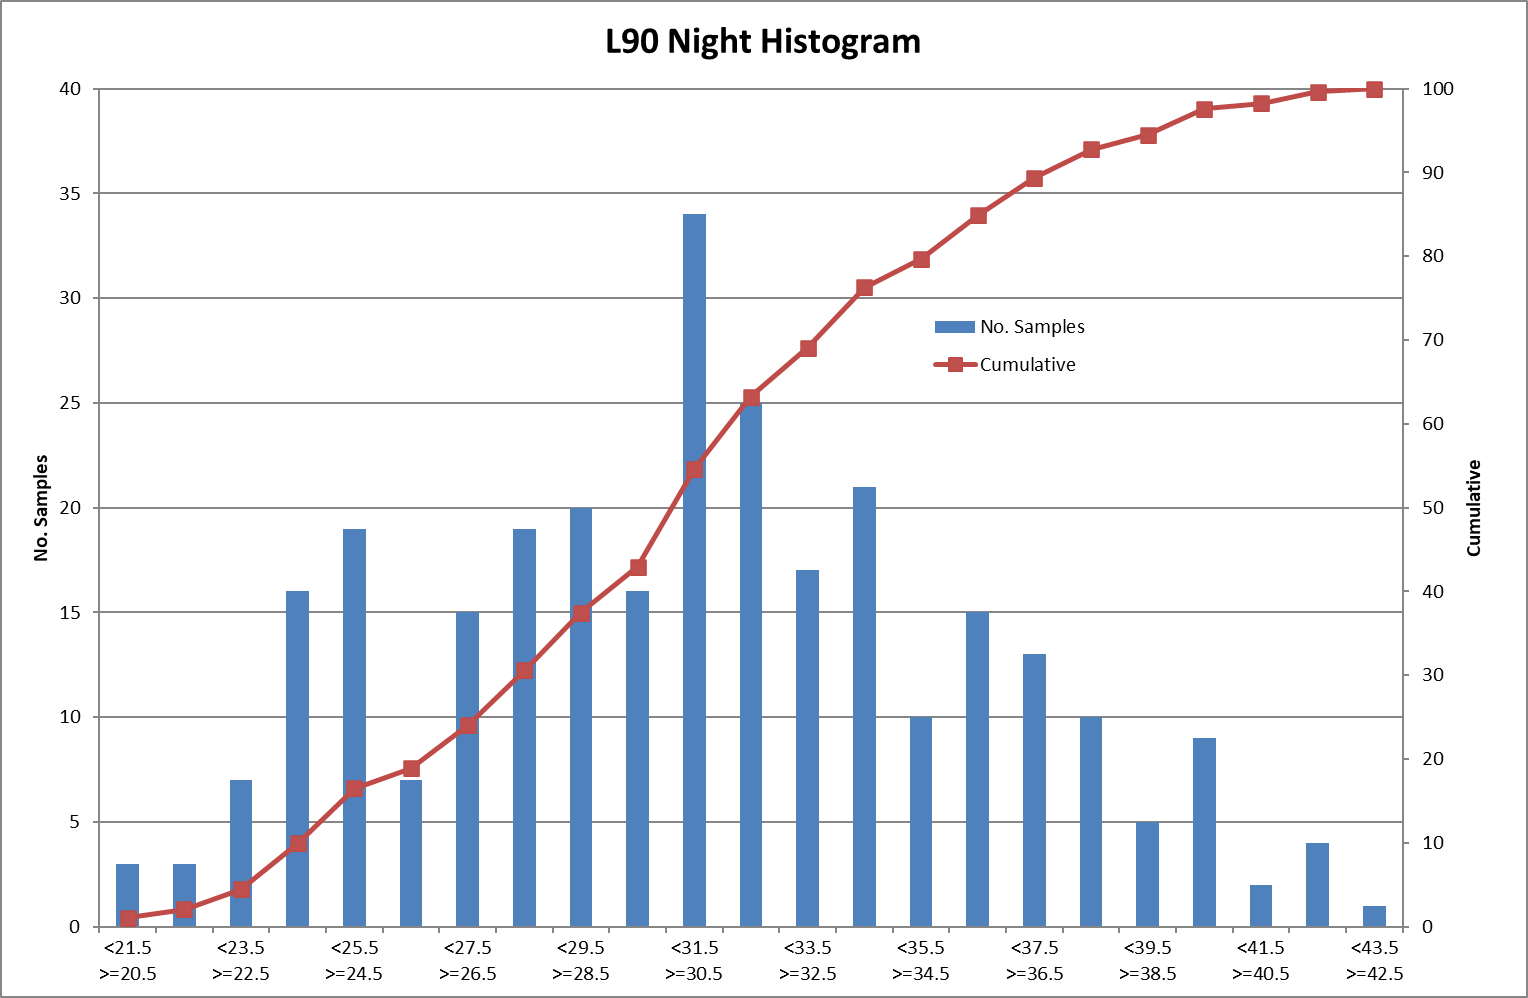
Chart 15 – LA90,15min, Windspeed and Rainfall, SSR5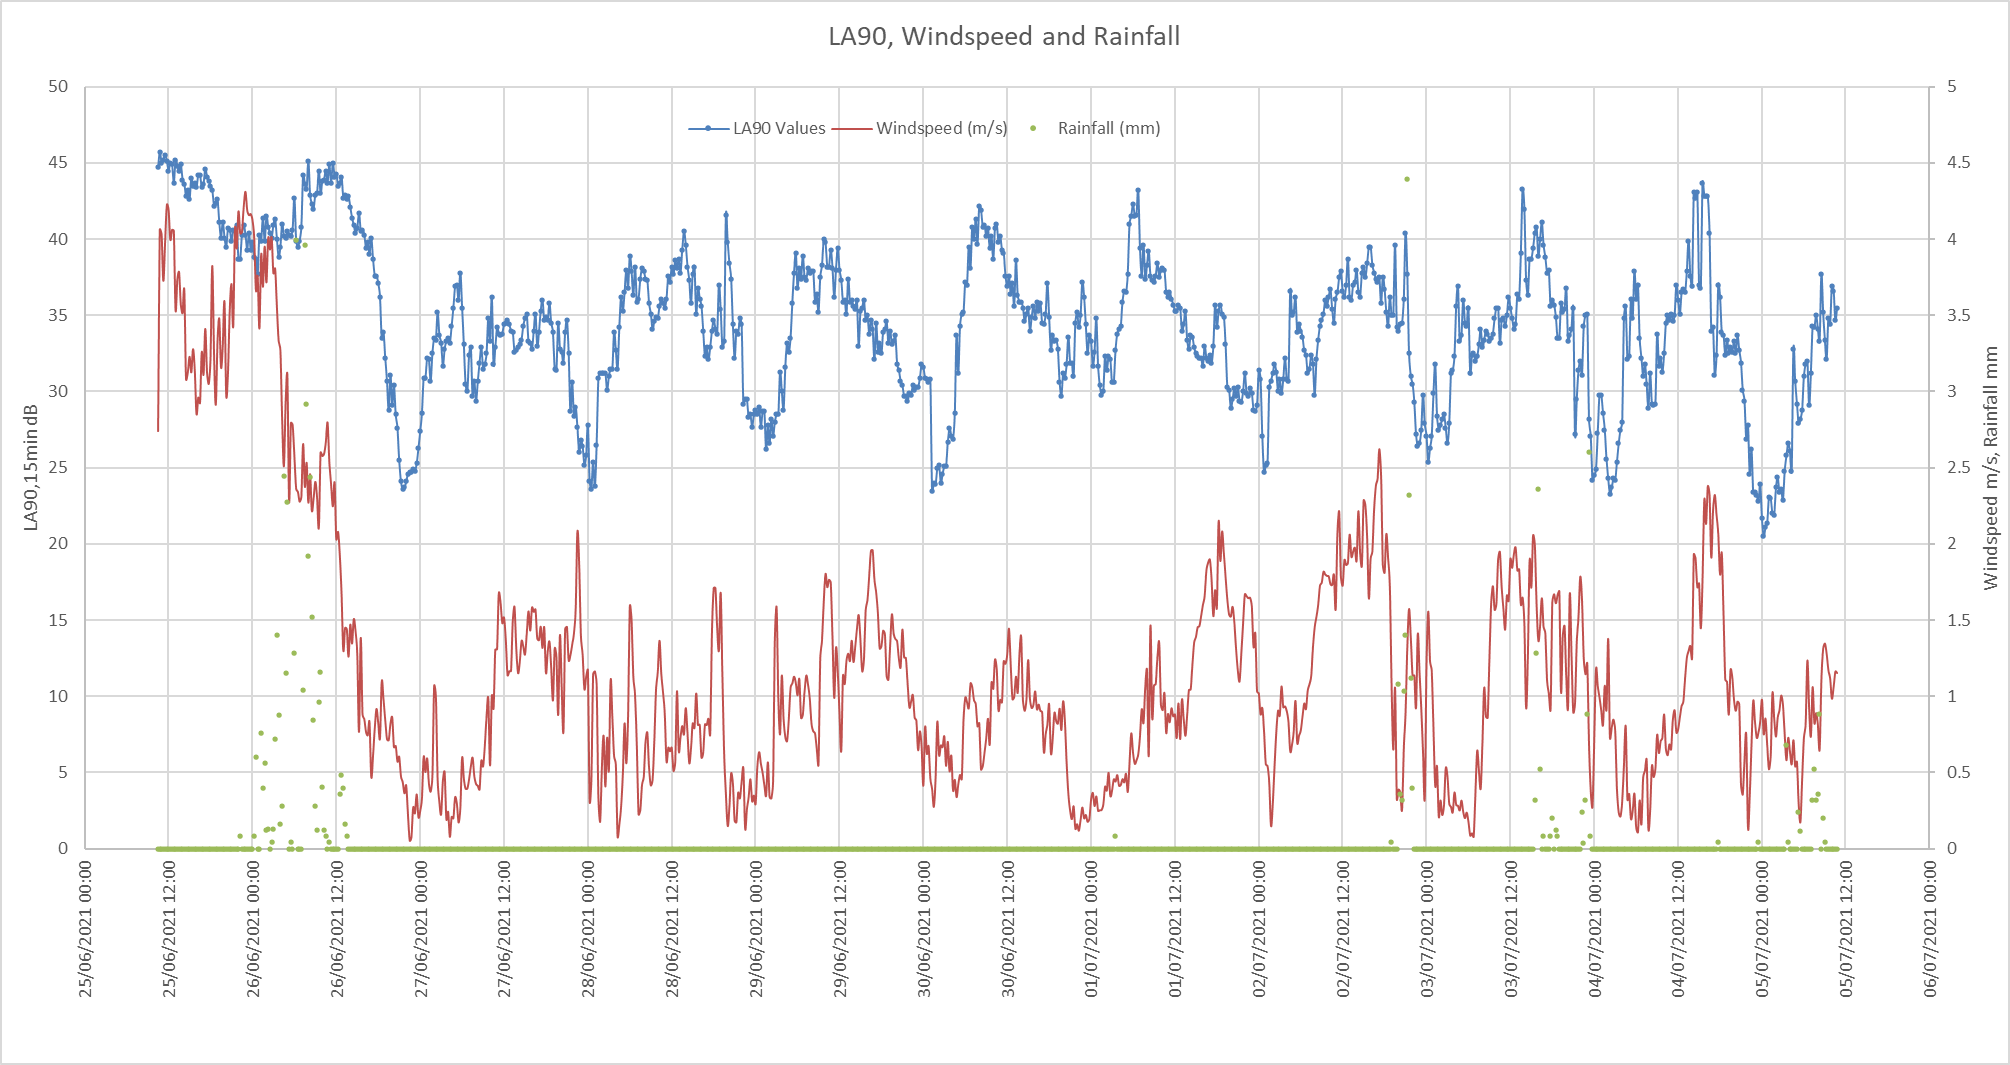
As noted above, the background level shows substantial diurnal variation. Higher wind speeds correlate with an increase in background noise levels, while low wind speeds typically correlate with low background levels.
2.1.6 SSR6 12 Thorntonloch Holdings
Surveyor observations at SSR6 noted that the noise climate was affected predominantly by natural sounds such as wind rustling vegetation. Lesser contributions came from distant road traffic on the A1 and intermittent train passes on the East Coast Mainline.
Table 12 – Baseline Noise Data Analysis, SSR6 Daytime
Period | Date | Average, dBLA90,15min | Mode, dBLA90,15min | Standard Deviation |
|---|---|---|---|---|
Daytime | 7th to 20th May 2021 | 35 | 33 | 4.2 |
Chart 16 – Baseline Noise Data Cumulative Distribution, SSR6 Daytime
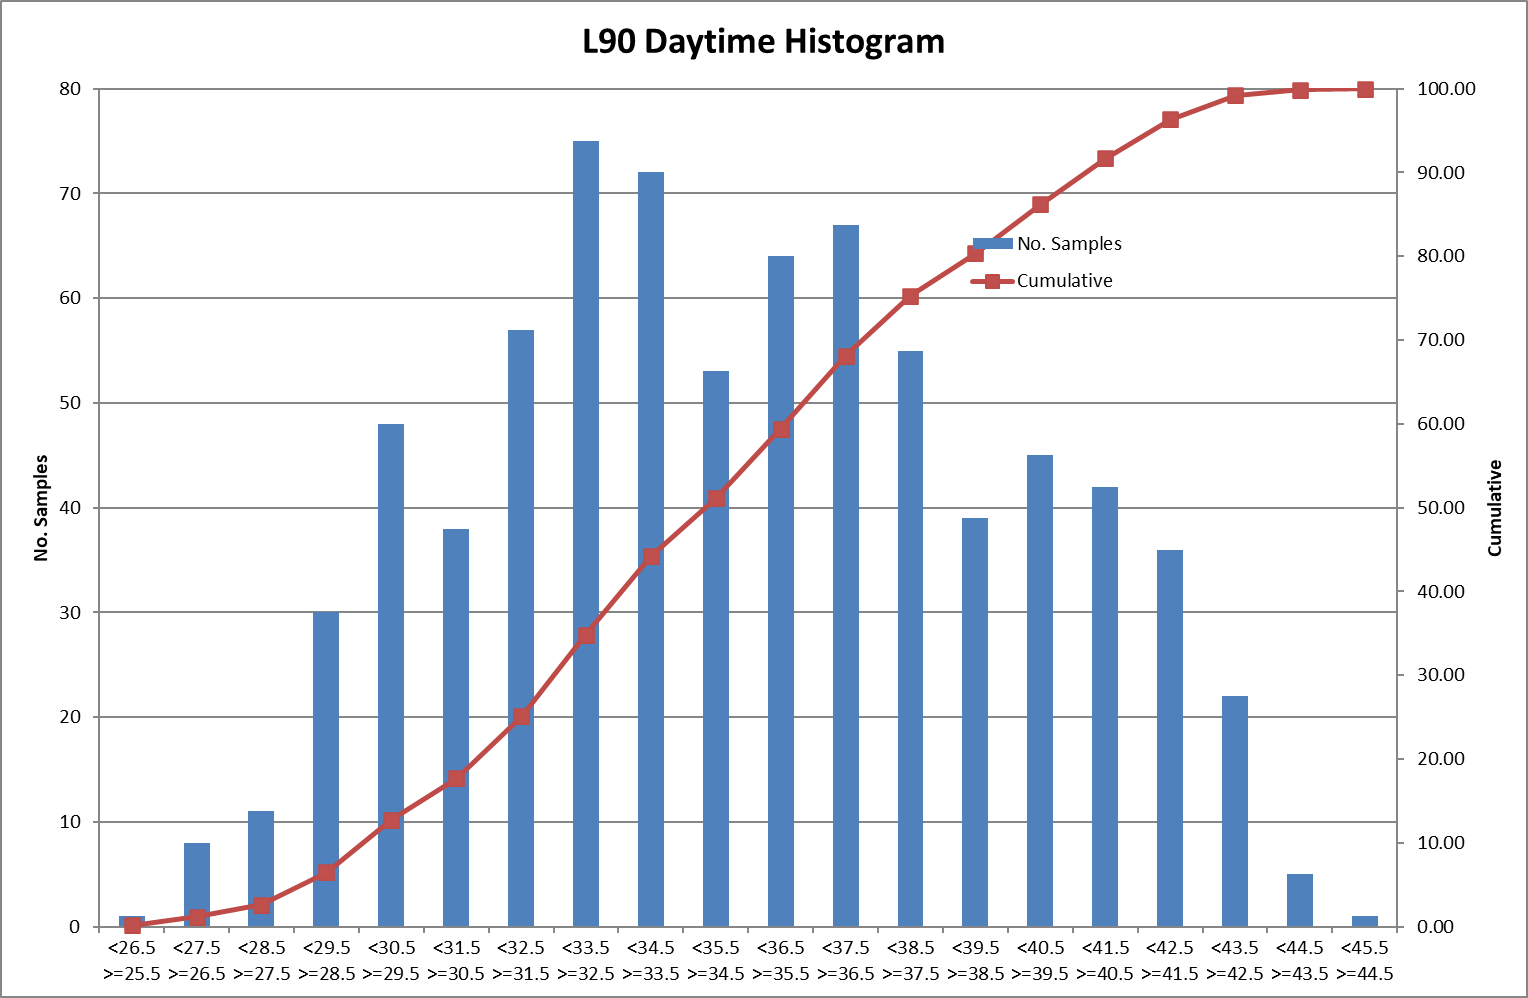
Chart 16 shows that the modal peak during the daytime is 33 dB with a secondary peak at 34 dB. Whilst these are within the lower end of the cumulative distribution the peaks are quite prominent and within the second quartile of the distribution, therefore, in this instance, the primary modal value of 33 dB has been chosen as the representative daytime LA90.
Table 13 – Baseline Noise Data Analysis, SSR6 Night-time
Period | Date | Average, dBLA90,15min | Mode, dBLA90,15min | Standard Deviation |
|---|---|---|---|---|
Daytime | 7th June to 20th May 2021 | 34 | 35 | 4.0 |
Chart 17 – Baseline Noise Data Cumulative Distribution, SSR6 Night-time
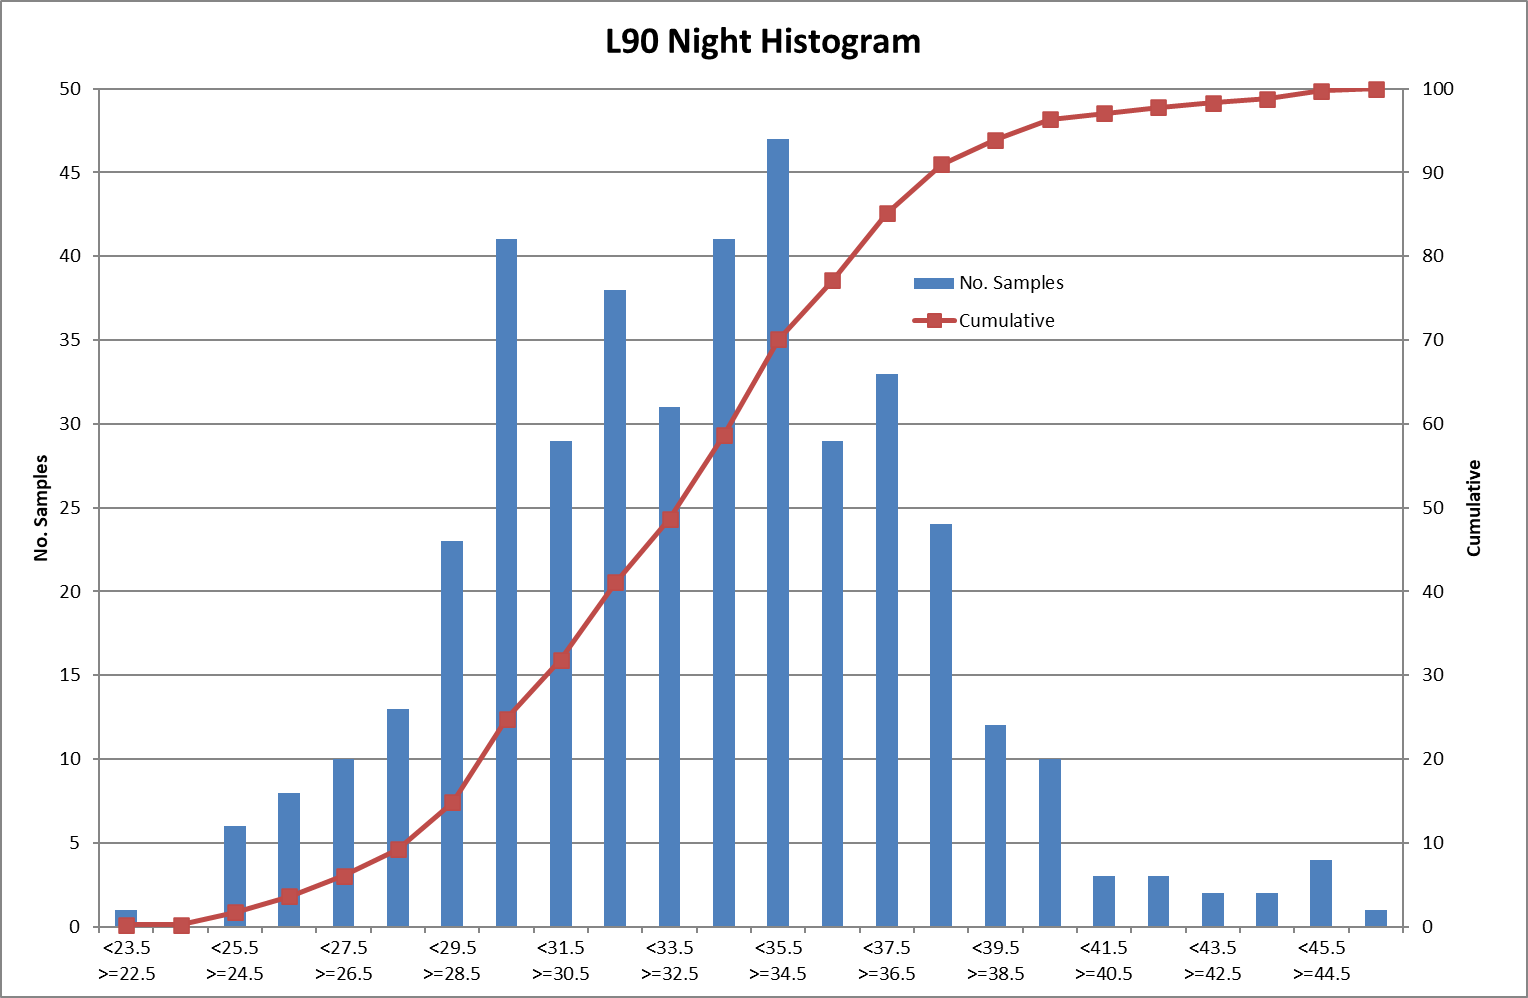
Chart 17 shows that the modal peak during the night-time is 35 dB and this is higher than the daytime modal peak of 33 dB. However, with reference to Chart 18 (below), the background level during the night-time period is subject to considerable variance, occasionally dropping below 30 dB, but more usually being between 30 and 35 dB. A value of 33 dB was considered to be the representative background in this instance.
Chart 18 – LA90,15min, Windspeed and Rainfall, SSR6
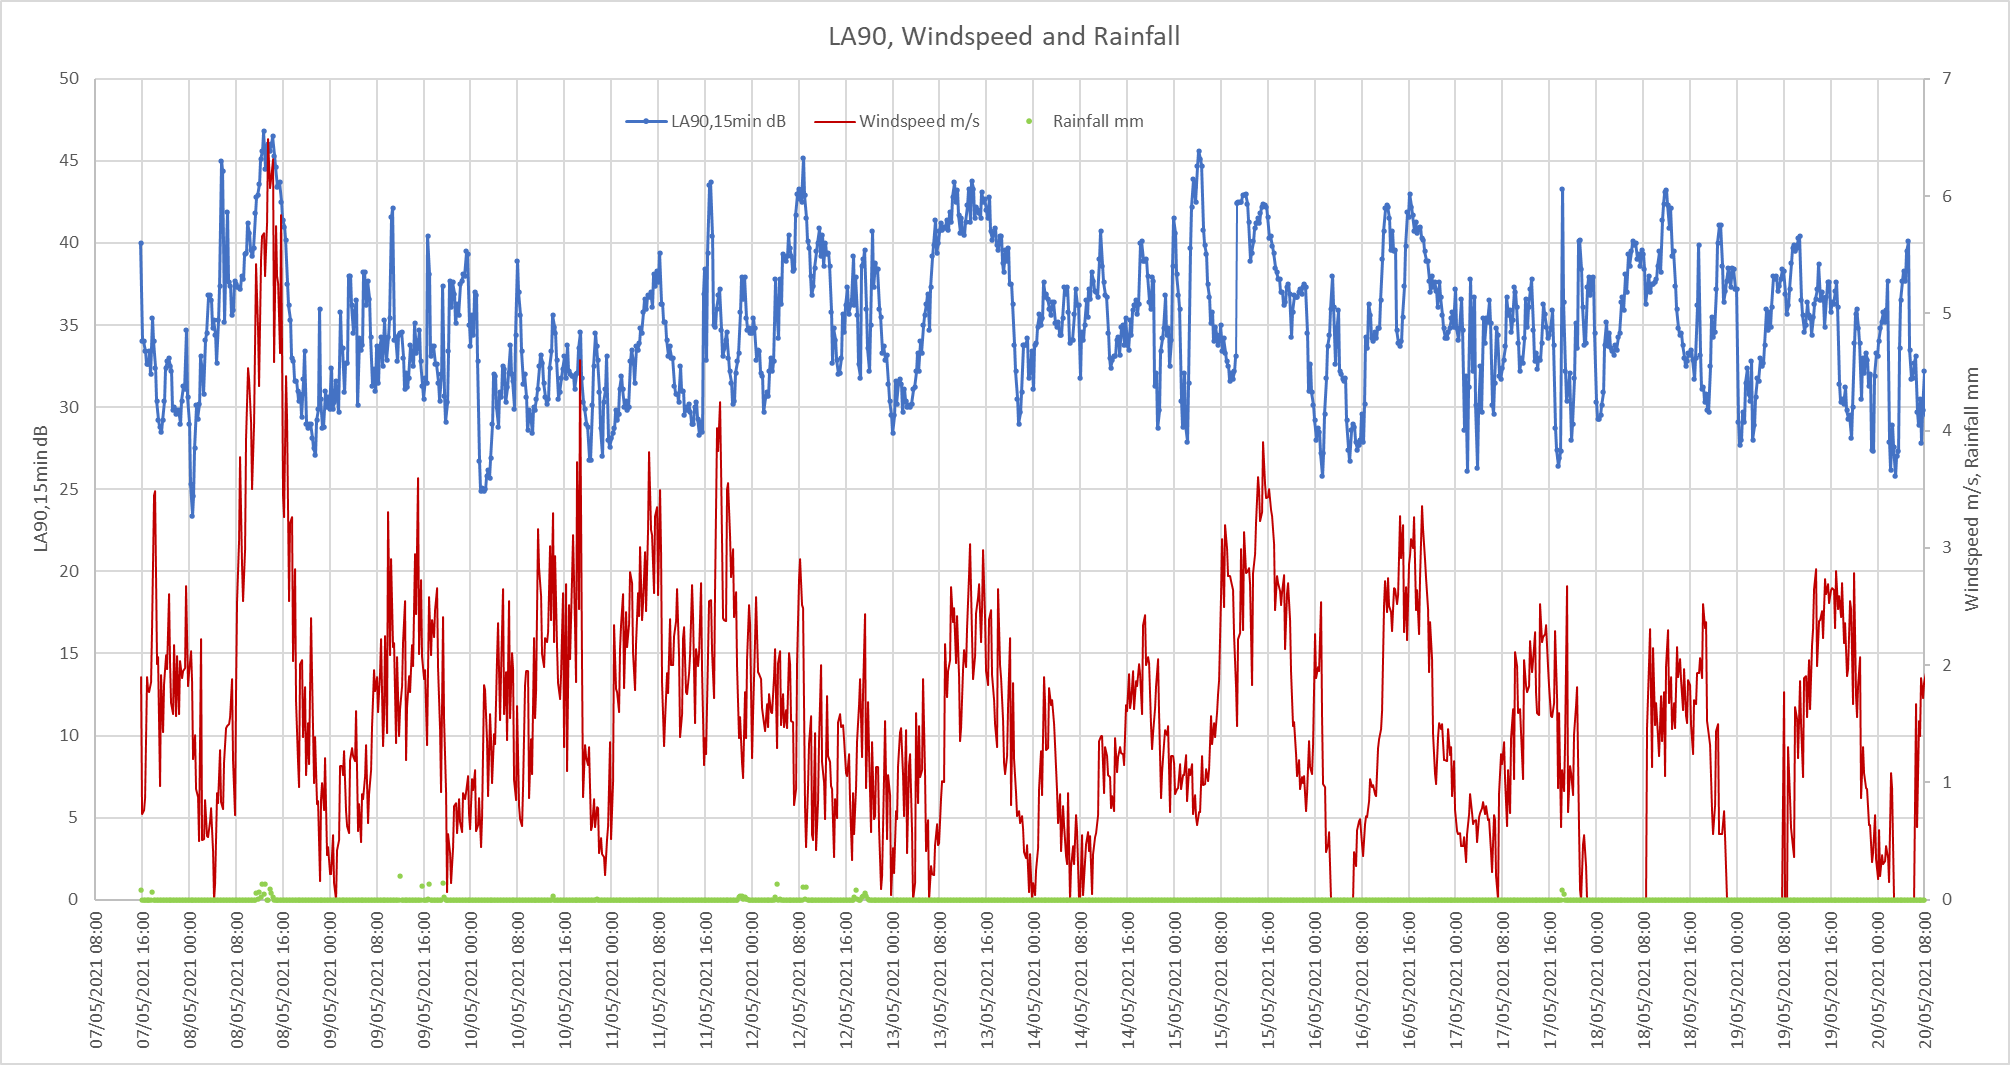
The measured background levels show a close correlation with windspeed, particularly at higher windspeeds. A diurnal pattern is also evident though this is considered lesser than the influence of windspeed.