

3.4.3. ELECTRICITY GENERATION
Due to the lower operational GHG intensity of the Project compared to the national grid GHG intensity projections, a net reduction in GHG emissions will be achieved as a result of the Project as offshore wind power is a less GHG intensive form of energy generation than the projected marginal generation in 2028 onwards, which includes a small residual amount of generation using unabated fossil fuels.
Electricity generation from the Project during the first full year of operation (when 4.1 GW of capacity is installed) is estimated to be 14,445,415 MWh. The Project is anticipated to produce 505,589,525 MWh of electricity over its 35-year operation and maintenance phase.
The average operational GHG intensity of the Project has been calculated at 2.8 grams of CO2 equivalent per kWh (gCO2e/kWh) by dividing the total operational GHG emissions by the total electricity generation of the Project. Construction GHG emissions have not been included within this calculation to allow a like-for-like comparison with the projected grid intensity, as the BEIS GHG intensity projections also only account for operational GHG emissions.
When compared to the current projections for the GHG intensity of marginal generation on the national grid from 2028 to 2067 (BEIS, 2021) as noted in Table 3-7 Open ▸ , the GHG intensity of the Project is much lower throughout the entire operation and maintenance phase. This means that the Project will produce fewer GHG emissions per kWh of energy generated than the marginal generation sources it displaces from national grid supply.
Table 3-7 – GHG Intensity and GHG Emissions Saved by the Project
Based on the difference between the operational GHG intensity of the Project and the projected marginal GHG intensity for each year of operation, published by BEIS, it is estimated that the Project would save the amount of 9,178,312 tCO2e from being emitted into the atmosphere during its operation and maintenance phase (see Table 3-7 Open ▸ ).
3.4.4. COMPARISON TO ALTERNATIVE FORMS OF ELECTRICITY GENERATION
The beneficial impact of the Project is further realised in relation to alternative forms of electricity generation.
This comparison uses a different GHG intensity to that presented in section 3.4.3 and accounts for construction GHG emissions to provide a like-for-like comparison from a lifecycle perspective.
Based on the total electricity generation of the Project and the lifecycle GHG emissions of 7,638,930 tCO2e, the lifetime GHG intensity of the Project is 15 gCO2e/kWh. This compares favourably with other low carbon energy generation and is significantly better than fossil fuel energy generation. Table 3-8 Open ▸ outlines energy intensity ranges of alternative forms of energy generation (CCC, 2013).
Table 3-8 – Comparison of Lifecycle GHG Intensities of Various Forms of Electricity Generation
3.4.5. COMPARISON TO UK CARBON BUDGETS
The Applicant is committed to reducing GHG emissions wherever practicable and to supporting the UK and Scottish Governments in meeting their carbon reduction targets.
It is assumed that the construction phase takes place from 2025 to 2032 and that the GHG emissions resulting from this phase are spread evenly over this period. This period falls over the 4th (2023-2027) and 5th (2028-2032) carbon budgets of the UK Government.
The Project will operate during the entire 5th and 6th carbon budget periods. The operation and maintenance phase will extend until after the 2050 net zero target date.
Table 3-9 Open ▸ shows the proportion of the relevant carbon budgets that the Project would contribute to the UK Government’s 5-year budget period.
Table 3-9 – Comparison of Project to UK Government Carbon Budgets (tCO2e)
Note: This table does not include the GHG emissions resulting from the replacement of key offshore Proposed Development components as it is not known at this stage when any replacements might take place and hence into which carbon budget they would fall.
Table source: Advice on reducing the UK’s emissions - Climate Change Committee (theccc.org.uk)
3.4.6. ASSESSMENT OF SIGNIFICANCE
The annual GHG emissions from the construction and operation and maintenance of the Project do not contribute to more than 0.24% to any of the UK Carbon Budgets that fall within this phase. Therefore, it is considered that the Project’s GHG emissions at no point will impact the UK Government’s ability to meet its Carbon Budgets. The UK Carbon Budgets align with the GHG emissions reduction trajectory required to limit warming to 1.5C, in line with IEMA guidance (2022) for determining significance, as noted in section 3.3.5.
Therefore, the GHG emissions resulting from the construction phase of the Project are considered to have a non-significant, minor adverse effect on the climate.
Despite the GHG emissions produced during the operation and maintenance phase, the Project is anticipated to save 9,178,312 tCO2e from being emitted into the atmosphere due to its lower GHG intensity than the grid’s marginal generation sources it displaces in the future baseline scenario. Without the Project, higher GHG emitting sources of energy generation will be required. Even when construction emissions are included in this equation, the Project would still save 2,951,519 tCO2e from being emitted into the atmosphere over its lifecycle.
The Project would take 8 years and 2 months to ‘pay back’ the GHG emissions relating to the construction phase from the start of the operation and maintenance phase.
The Project would begin providing carbon savings in 2036 and would continue to do so throughout its operational life. This would provide a beneficial contribution to both the UK and Scottish Governments in reaching their net zero targets by avoiding the release of GHG emissions to the atmosphere that would have been released by conventional sources of energy generation with higher GHG emissions.
This demonstrates how low-carbon energy generation sources such as this Project are crucial to the National Grid GHG intensity of electricity generation in the UK decreasing as projected.
The anticipated 9,178,312 tCO2e savings during the operation and maintenance phase mean that the Project would directly contribute to the UK and Scotland meeting their carbon reduction targets and results in GHG emissions being avoided from being emitted into the atmosphere. Therefore, the operation and maintenance phase of the Project is considered to have a significant beneficial effect on the climate.
Overall, the assessment has found that the Project would save 2,951,519 tCO2e GHG emissions from being emitted over the lifetime of the Project. This would provide a beneficial impact in relation to the UK and Scotland meeting their carbon reduction targets and cause GHG emissions to be overall avoided from the atmosphere. Therefore, the Project is considered to have a significant beneficial effect on the climate.
3.4.7. CUMULATIVE EFFECTS
The effects of GHG emissions are essentially cumulative; it is their concentration in the atmosphere, not the actual level of GHG emissions, that determines the warming effect (i.e. it is the ‘stock’ rather than the ‘flow’ which is important). In addition, it is the global excess of GHG emissions from human activities all over the world that contributes to the overall effect on climate, not only local GHG emissions. And it is the global atmosphere that is the receptor for these GHG emissions. For these reasons, the impact of the Project should be considered in the context of overall GHG emissions from the UK and globally. As noted in the IEMA guidance, the effects of GHG emissions from specific cumulative projects should not be individually assessed as there is no basis for selecting any particular project over any other.
The Cambois connection[7] will export electricity from the offshore Proposed Development array area to the National Grid via a grid connection at Blyth substation, Northumberland. The Cambois connection will be constructed during a two-year period between 2028 and 2031. It would only be constructed if the Project is implemented. Since the Cambois connection is therefore directly dependent on the implementation of the Project, a cumulative assessment of the GHG emissions associated with the Cambois connection together with the onshore Proposed Development and the offshore Proposed Development is presented here in order to provide a precautionary, worst-case assessment of potential GHG emissions.
Since the Cambois connection is at the scoping stage, full design details are not known at this stage, but the worst-case scenario for the construction phase GHG emissions is estimated to be 337,935 tCO2e. The vast majority of these GHG emissions are embodied GHG emissions from the four export cables used along the up to 170 km offshore export cable route.
The GHG emissions for the operation and maintenance phase are not known at this stage but are considered to be minor. This is due to the likely limited operational energy and maintenance requirements associated with the export of electricity.
Table 3-10 Open ▸ compares the cumulative GHG emissions of the two projects with the UK carbon budgets. As the Cambois connection is due to be constructed within a two-year period between 2028 to 2031, the cumulative GHG emissions will only occur during the 5th UK carbon budget. The two projects combined will release 4,523,604 tCO2e during the 5th carbon budget. This equates to only 0.26% of this UK carbon budget.
Table 3-10 - Comparison of Cumulative GHG Emissions to UK Government Carbon Budgets (tCO2e)
The cumulative GHG emissions from the two projects do not contribute to more than 0.26% of any of the UK Carbon Budgets that fall within the construction and operation and maintenance phases of the Project. Therefore, it is considered that these cumulative GHG emissions will not impact the UK Government’s ability to meet its Carbon Budgets. The UK Carbon Budgets align with the GHG emissions reduction trajectory required to limit warming to 1.5C, in line with IEMA guidance (2022) for determining significance.
Taking the GHG emissions from the Cambois connection into account results in saving 2,613,584 tCO2e from being emitted into the atmosphere during the lifecycle of the Project.
Whilst the GHG emissions resulting cumulatively from the Project and the Cambois connection are considered to have a non-significant, minor adverse cumulative effect on the climate, they only occur cumulatively during the construction phases of both projects. The Project’s significant beneficial effect on the climate during the operation and maintenance phase is not changed when taking the Cambois connection into account, nor is the overall significant beneficial effect of the Project on the climate during its lifetime.
3.5. MITIGATION MEASURES
Mitigation against effects on climate is the reduction in GHG emissions released in association with the Project, both during the construction and operation and maintenance phases. Mitigation should be applied to both the onshore Proposed Development and offshore Proposed Development where practicable.
Mitigation measures set out in Table 3-11 Open ▸ require consideration during the construction phase to reduce GHG emissions resulting from construction activities. However, these measures do not need to be implemented for the results and outcomes in Section 3.4.6 to be achieved. Their implementation would result in further GHG emissions savings.
Table 3-11 – Mitigation Measures During Construction
Mitigation measures set out in Table 3-12 Open ▸ should be considered during the operation and maintenance phase to reduce GHG emissions resulting from operation and maintenance activities of the Project. The proposed mitigation measures do not need to be implemented for the results and outcomes in Section 3.4.6 to be achieved but to improve the results further. Several of the mitigation measures are already being considered by the Applicant.
Table 3-12 – Mitigation Measures During Operation and Maintenance
3.6. SUMMARY
The construction of the Project will contribute 6,226,793 tCO2e of GHG emissions during the construction phase. Once fully operational the Project will generate 1,412,137 tCO2e during its 35 year operation and maintenance phase, of which the vast majority (1,044,431 tCO2e) will be emitted by diverted shipping routes.
Based on the difference between the operational GHG intensity of the Project and the projected GHG intensity of marginal generation sources on the national grid for each year of operation, published by BEIS, it is estimated that the Project will save 2,951,519 tCO2e from being emitted over its lifecycle.
As the operational GHG intensity of the Project (2.8 gCO2e/kWh) is considerably lower than the projected marginal grid energy mix, the Project would directly aid both the UK and Scottish governments in meeting their carbon reduction targets.
The Project would take 8 years and 2 months to ‘pay back’ the construction phase GHG emissions from the start of operation. After this period, the Project would save 2,951,519 tCO2e from being emitted into the atmosphere by replacing conventional forms of energy generation (i.e. fossil fuels). This ‘payback’ period is in line with both governments’ net zero ambitions.
Therefore, the renewable energy generation of the Project would have a significant beneficial effect on the climate.
A cumulative assessment was completed for the Project and the Cambois connection as the implementation of the Cambois connection is determined by the implementation of the Project. The additional estimated GHG emissions from the Cambois connection (337,953 tCO2e) will result in the cumulative GHG emissions from the two projects to contribute 0.26% to any of the UK’s carbon budgets.
It is considered that these cumulative GHG emissions at no point will impact the UK Government’s ability to meet its Carbon Budgets. Therefore, the GHG emissions resulting from the cumulative assessment are considered to have a non-significant, minor adverse cumulative effect on the climate which occurs during the construction phase of both projects. The Project’s significant beneficial effect on the climate during the operation and maintenance phase is not changed when taking the Cambois connection into account, nor is the overall significant beneficial effect of the Project on the climate during its lifetime.
Without low-carbon energy generation, such as the Project, the average grid GHG intensity will not decrease as is projected, which could adversely affect the UK’s and Scotland’s ability to meet its carbon reduction targets.
4. CLIMATE VULNERABILITY
4.1. APPROACH
The IPCC describes climate vulnerability as the tendency or predisposition of a receptor to be adversely affected by changes to the climate. It therefore encompasses a variety of concepts and elements including sensitivity or susceptibility to harm and lack of capacity to cope and adapt (IPCC, 2018) .
The climate vulnerability assessment covers the Project’s design life (35 years). It is noted that it is not unusual for a development’s design life to be exceeded by its life span as many developments remain in situ after they have fulfilled their original objectives. With this in mind the climate vulnerability baseline uses long term climate projections.
4.1.1. Study Area
The Climate Vulnerability study area consists of both the onshore Proposed Development and offshore Proposed Development.
4.2. Baseline
4.2.1. METHODOLOGY TO INFORM BASELINE
Information on the current climate of the Climate Vulnerability study area was collected using the Met Office’s regional dataset of 30-year averages and data from the nearby meteorological station at Dunbar[8].
Consideration of the future climate for the Climate Vulnerability study area has been undertaken using climate projections from United Kingdom Climate Projections 2018 (UKCP18 (Met Office, 2018)). These projections have been developed by the Met Office Hadley Centre Climate Programme which is supported by BEIS and Defra. They provide the most up-to-date assessment of how the climate of the UK may change over the 21st century. The UKCP18 dataset used is Local (2.2 km) projections, the highest resolution data. UKCP18 uses a range of possible scenarios, classified as Representative Concentration Pathways (RCPs), which reflect future atmospheric concentrations of GHGs resulting from different emissions trends (IPCC, 2014). These RCPs “…specify the concentrations of greenhouse gases that will result in total radiative forcing increasing by a target amount by 2100, relative to preindustrial levels.” RCP 8.5 refers to a temperature increase of about 4.3˚C by 2100, relative to pre-industrial temperatures. Referred to as the business-as-usual scenario, and hence the worst-case scenario for climate change, this is the emission scenario used in this assessment. Other RCPs are provided in Table 4-1 Open ▸ .
Table 4-1 – Representative Concentration Pathways (RCPs)
The local climate projections that are made available through UKCP18 are limited to RCP8.5 and two time periods (2021-2040 and 2061-2080). This precludes assessment of the changes in local climate risks over continuous time series for multiple scenarios. RCP8.5 represents the highest concentration scenario and is indicative of a mean global temperature rise of 4.3°C (range 3.2–5.4°C) by 2100. Although the latest IPCC assessment states that recent developments in climate policy and renewable energy make RCP8.5 less likely, it cannot be entirely ruled out due to uncertainties in both human actions and climate feedbacks (IPCC, 2021). Therefore RCP8.5 can be used to define a cautious worst case for climatic risks. Moreover, since the warming trajectory of RCP8.5 passes through conditions that are more representative of end-of-the-century temperature rises under lower concentration scenarios, mid-century projections under RCP8.5 can also be informative of other warming scenarios and used as a proxy for other RCPs.
The operational life of the Project is 35 years. The Climate Vulnerability assessment has considered a conservative scenario that considers the potential for operation beyond this design life horizon by using a high level of global GHG emissions up to the 2061-2080 period, based on the UK Climate Change Projections 2018 and Regional Climate Models[9].
4.2.2. Current baseline
Historic average climate data obtained from the Met Office website recorded by the closest meteorological station to the Project, Dunbar, and the East Scotland region for the 30-year climate period of 1991-2020 is summarised in Table 4-2 Open ▸ below. The data show that Dunbar has, on average warmer temperatures, fewer days of air frost, more hours of sunshine, and less rainfall compared to East Scotland as a whole.
Table 4-2 – Historic Climate Data for Dunbar and East Scotland, 1991-2020 [10] [11]
The Met Office historic 30-year averages for the East Lothian region identify gradual but consistent warming across each 30-year period between 1961 and 2020 with gradual and consistent increases in rainfall.
4.2.3. Future baseline
This section presents the output of the UKCP18 climate change models that cover the Climate Vulnerability study area spanning the life of the Project’s infrastructure, anticipated to last until the 2060s (based on a 35-year operational life of the Project). This is used to describe the climate risk profile.
Projections of future temperatures, precipitation, sea levels and wind speed are provided below. As described above, data from the 2061-2080 period is used to inform the future baseline.
Temperatures
An increase in temperatures across all months in the Project area in the latter half of the 21st century is projected, with increases greatest in summer months. By 2061-2080, average temperature increases could exceed 5°C in summer months and 3°C in winter months under the high emissions scenario (RCP8.5) (Figures 4-1 and 4-2 respectively).
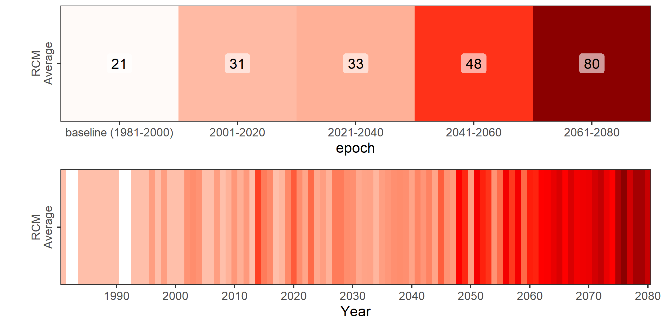
Maximum temperatures show a consistent warming trend throughout the century, with the hottest day of the year consistently exceeding 30°C by 2061-2080 under the high emissions scenario (RCP8.5), shown in Figure 4-3.
Heatwaves are defined by the Met Office as a period of at least three consecutive days with daily maximum temperatures meeting or exceeding 25°C. Heatwaves are projected to become around four times more frequent in the latter half of the 21st century. The current hottest temperature record will be surpassed, and maximum temperatures of 35°C or above are possible. Heatwaves are projected to become more frequent (Met Office, 2021), as shown in Figure 4-4.

Figure 4-2 - Average Monthly Temperatures for the Baseline and Future Baseline Period Under the High Emissions Scenario

Figure 4-3 - Maximum Annual Temperature (degrees Celsius) in Edinburgh
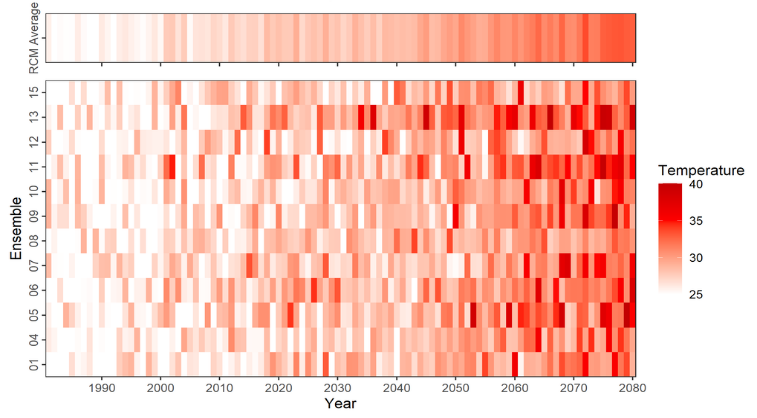
Figure 4-4 – Number of Heatwave Events (from 1990 to 2080)
Precipitation
UKCP18 projections indicate that Scottish winters will become wetter, with more heavy rainfall and a greater number of wet days, although this increase is less extreme in east Scotland than in the west. In summer months, total rainfall amounts are expected to decrease, while convectional rainfall will trigger storms between 10% and 45% more extreme than at present (Dale, 2021; Chan et al., 2022). Average summer rainfall in the Climate Vulnerability study area is projected to decrease in the coming decades, as shown in Figure 4-5, with average winter rainfall projected to increase in the latter half of the 21st century.
Summer heavy rainfall events are, however, also projected to become more extreme. This is a new finding from the latest UKCP18 ‘Local’ projections that use a 2.2 km climate model and include an improved representation of convective rainfall (the type of rainfall that drives summer storms). This is not evident in other UKCP climate products at coarser resolutions.
Local projections have been used to derive rainfall uplifts for specific storm return periods for the Climate Vulnerability study area. These are presented in Table 4-3 Open ▸ for the 2050s and 2070s. These uplifts demonstrate that a notable increase in storm intensity can be expected over the next 30 years, with further increases in the subsequent 20 years ( Table 4-3 Open ▸ ).
Figure 4-5 - Daily Average Precipitation for the Baseline and Future Baseline Period Under the High Emissions Scenario
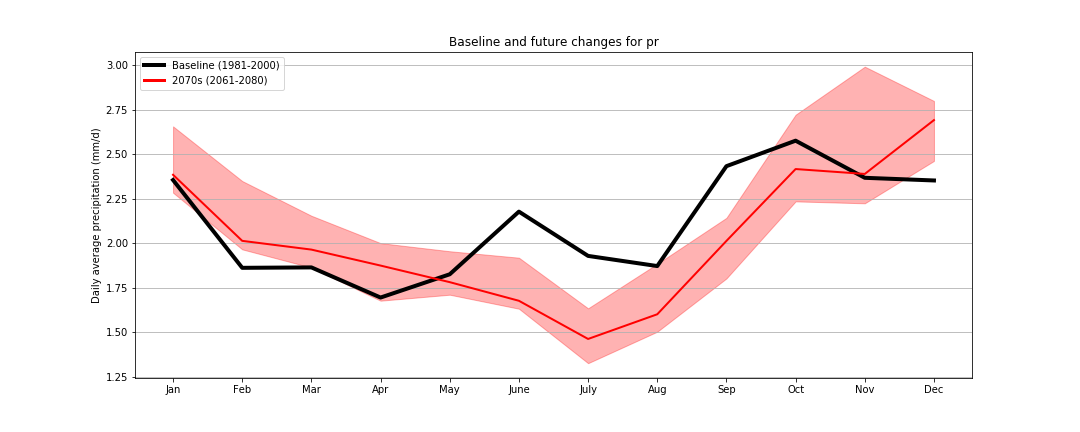
Table 4-3 – Heavy Rainfall Uplifts
Sea Levels
Sea levels around the UK rose at a rate of around 1.4 mm/year in the 20th century. This trend is projected to continue to the end of the 21st century and beyond. Rates of increase are largely independent of emissions scenarios over the next 20 years, with increases of 16-20 cm possible by 2040 relative to the 1981-2000 baseline. However, under RCP8.5, rates could increase by 38 cm by 2060 and by 62 cm by 2080 (Met Office, 2018).
Extreme sea levels are expected to increase due to the rise in mean sea level, as well as the risk of coastal flood events, but there is greater uncertainty in projecting these extreme levels. The estimated still water (the average sea level at any instance, excluding local variations due to waves) return levels are also provided for each return period. Rates vary notably in the latter half of the century, with possible increases as high as 90 cm under the high emissions scenario (RCP8.5). Figure 4-6 shows the visual representation of projected sea level rise in Edinburgh (Leith) under RCP8.5, RCP4.5 and RCP2.6. The bold lines show the 50th percentile[13] projections with the lower and upper dotted lines showing the 5th and 95th percentile[14] for each RCP.
Figure 4-6 – Sea Level Rise Rates Based on Different RCPs
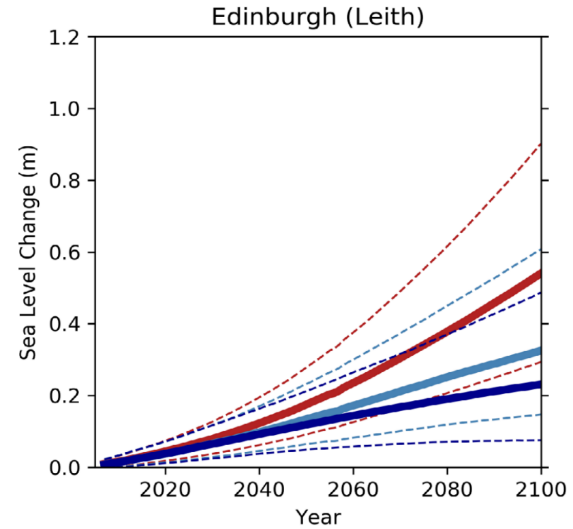
Note: Red line is RCP8.5, light blue line is RCP4.5 and dark blue line is RCP2.6
Wind Speed and Waves
Wind speeds around the UK are difficult to project; however, studies have shown that wind resources are projected to change seasonally with increases in winter and decreases in summer (Hdidouan, & Staffell, 2017). The latest UKCP18 global projections indicate an increase in near surface wind speeds over land over the UK during the winter season for the second half of the 21st century accompanied by an increase in frequency of winter storms over the UK. However, the increase is small when compared to interannual (year-to-year) variability (Met Office, 2019).
Waves in climate models are driven by the winds of the atmospheric model, where typically, the global model winds drive the seas well in open water in oceans like the Atlantic and in sea basins like the North and Baltic Seas. The challenges lie in coastal regions where high-resolution winds and better representation of the local coastline and bathymetry are needed. With current scientific understanding and uncertainty, it is difficult to ascertain changes in wave climate.
4.3. ASSESSMENT METHODOLOGY
4.3.1. GUIDANCE
The Climate Vulnerability assessment has been undertaken in accordance with IEMA (2020) Environmental Impact Assessment Guidance for Climate Change Resilience & Adaptation assessment.
4.3.2. IMPACTS TO BE ASSESSED
The climate hazards scoped in and those not progressed for further assessment are provided in Table 4-4 Open ▸ . Further details about the potential impacts that the scoped in climate hazards could cause are provided later in Section 4.4.
Table 4-4 – Climate Hazards Scoped Into Assessment or Not Progressed for Further Assessment
4.3.3. SIGNIFICANCE ASSESSMENT
Determination of Receptor Sensitivity
In accordance with IEMA guidance receptors considered include:
- Human health receptors (e.g., construction workers and operational and maintenance staff); and
- Project Infrastructure (onshore and offshore).
Sensitivity, in relation to climate change vulnerability, for each receptor has been determined using quantifiable data as well as professional judgement. In accordance with IEMA guidance the following have been considered:
- Susceptibility – ability for the receptor to be affected by climate change;
- Vulnerability – potential exposure of receptor to climate change; and
- Value – importance of receptor.
Susceptibility and vulnerability have been determined based on the criteria set out in IEMA guidance and shown in Table 4-5 Open ▸ and Table 4-6 Open ▸ . Criteria for defining a receptor’s value are set out in Table 4-7 Open ▸ .
Table 4-5 – Criteria for Determining Susceptibility
Table 4-6 - Criteria for Determining Vulnerability
Table 4-7 - Criteria for Determining Value
The receptor’s sensitivity is a combination of its vulnerability, susceptibility and value score. It is determined by summing these scores and then categorising as follows:
- Score 0-4 Negligible
- Score 5-7 Low
- Score 8-9 Medium
- Score 10-12 High
Determination of Impact Magnitude
Due to the inherent uncertainty of future climate change predictions, a risk-based approach has been used to identify impact magnitude, after mitigation, which considers a combination of the consequence of a climate change impact occurring and the probability of occurrence.
The probability of a specific climate variable changing is determined using available data and professional judgement. The categories range from negligible through low and medium to high. When defining probability, consideration has been given to the projected return periods of future events (where known), and the confidence in the direction of projected changes.
The consequence of climate change impacts has been defined as shown in Table 4-8 Open ▸ .
Table 4-8 – Criteria for Determining Impact Consequence
The impact magnitude is determined by considering the impact’s consequence and probability in combination as shown in Table 4-9 Open ▸ .
Table 4-9 – Determining Impact Magnitude
Determination of Significance
The significance of effect is determined by considering the relationship between the sensitivity of the receptor and the impact magnitude. Major or Major/Moderate effects are deemed to be significant. Everything less than this (Moderate, Moderate/Minor, Minor, Minor/Negligible and Negligible) are deemed to be not significant. Table 4-10 Open ▸ acts as a guide and professional judgement is used at each step to make a reasoned judgement on whether an effect is significant or not.
Table 4-10 – Determining Significance of Effect
4.4. ASSESSMENT
4.4.1. RECEPTORS
Table 4-11 Open ▸ shows the receptors that have been considered in the climate vulnerability assessment and shows how their sensitivity has been derived.
Table 4-11 - Receptors Considered in the Impact Assessment
4.4.2. POTENTIAL CONSTRUCTION IMPACTS
The Project's construction is not expected to be so far in the future that the current climate conditions will notably change. Gradual changes to average climatic conditions are therefore not expected to impact construction.
If construction coincides with extreme weather event(s), such as drought or storms, which are projected to become more frequent and more severe, there may be construction related impacts. These are set out in the following subsections.
Delayed Construction Schedule
Extreme weather events that compromise the viability of the construction site, for example, heavy rain resulting in closure of local roads and power cuts due to flooding or flood inundation of the construction site itself, could restrict working hours and delay construction.
Delays could also be linked to unsuitable weather conditions for certain construction activities or damage to construction materials, plant and equipment.
During installation, specialist vessels are required for heavy lifting and piling operations; these vessels are often jack-up vessels that are fitted with long support legs that can be raised or lowered. These vessels are particularly sensitive to wind speed, wave height and wave period when en route from port to the offshore location, transitioning between wind turbines, and heavy lifting crane operations at height.
Increased Health and Safety Risks
During severe weather events, for example, extreme heat events, there could be increased health and safety risks to the workforce.
Mitigation and Assessment
Construction impacts are addressed as required by the relevant topics within the Onshore and Offshore EIA Reports. Potential construction related surface water flood risks related to extreme weather are addressed within the Geology, Hydrology, Soils and Flood Risk Chapter (Onshore EIA Report, Volume 1, Chapter 11). Any potential construction impacts related to climate that are not covered by other chapters in the EIA Reports will be managed through the CEMP for example by the inclusion of severe weather construction plans and risk assessments.
4.4.3. POTENTIAL OPERATION AND MAINTENANCE IMPACTS
The operation and maintenance phase impact assessment for Climate Vulnerability is set out in Table 4-12 Open ▸ .
Table 4-12 – Operation and Maintenance Phase Impact Assessment
4.4.4. Potential decommissioning impacts
Climate change could affect metocean conditions. Vessels will be required for decommissioning the offshore infrastructure similar to the operation phase. A similar, suitable and appropriate level of planning to ensure safe operation will be required. Mitigation and the residual impact for this impact is the same during decommissioning as it is in the assessment presented in Table 4-12 Open ▸ .
4.4.5. CUMULATIVE ASSESSMENT
A cumulative assessment for Climate Vulnerability has not been taken forward for the following reasons:
- There are no cumulative risks when considering the onshore Proposed Development and the offshore Proposed Development combined (intra-Project cumulative risks) for Project assets, energy production, and staff since both the onshore Proposed Development and offshore Proposed Development will be different assets with their own construction and operation and maintenance programmes, management and workers;
- There is no likelihood for significant cumulative effects of the onshore Proposed Development with the onshore aspects (assets and workers) of the Cambois connection[16] due to the large geographical distance and separate management of the onshore aspects of the onshore Proposed Development (Branxton, Scotland) and the Cambois connection (Blyth, North England); and
- There is no likelihood for significant cumulative effects of the offshore Proposed Development with the offshore aspects (assets and workers) of the Cambois connection, considering that the offshore export cables of both the offshore Proposed Development and of the Cambois connection will be buried in the seabed and/or covered (see the project description of the offshore Proposed Development in the Offshore EIA report, volume 1, chapter 3) and that risks to staff wellbeing and occupational health and safety would be managed separately for both the offshore Proposed Development and the Cambois connection during construction and operation and maintenance.
An in-combination climate impact assessment is presented in volume 4, appendix 5.2, annex A.
4.5. SUMMARY
The assessment has considered the vulnerability of the Project to climate change impacts and has presented mitigation measures to manage these. No significant residual effects have been identified.