

Razorbill
- Return rates of razorbills also showed a relationship with sandeel abundance ( Figure 1.12 Open ▸ ). It is important to note that, as with breeding success, these relationships are non-linear. There can be large differences in sandeel abundance between moderate and high abundance over which range adult survival remains high; survival falls much faster when sandeel abundance falls below a critical threshold level. This means that gains depend on the starting point on the graph. Residuals for each plot are in ANNEX B.
Figure 1.12 Annual return rates of adult razorbills at the Isle of May (UKCEH data from online annual reports) in relation to ICES estimates of annual sandeel total stock biomass (tonnes) in SA4 between 2004 and 2018 (ICES 2022). Data for 2019-2021 are not yet published.
- Unlike the other species, there was not a relationship between the productivity of razorbills on the Isle of May and the sandeel stock in SA4 across the same time period ( Figure 1.13 Open ▸ ). This was likely due to the greater influence of weather and predation events strongly affecting the survival of eggs or chick, compared with the effects of these factors on adult survival. It may also be influenced by the fact that razorbill chicks fledge when only partly grown and continue their growth and development at sea; in this species productivity only measures success to shortly before chicks leave the nest sites. Razorbill nests are also difficult to monitor for breeding success as they tend to be hidden in cracks in the cliff or under boulders.
Figure 1.13 Annual productivity rates of adult razorbills at the Isle of May (UKCEH data from online annual reports) in relation to ICES estimates of annual sandeel total stock biomass (tonnes) in SA4 between 2004 and 2019 (ICES 2022). Data for 2020-2021 are not yet published.
- There was also a linear relationship between population size of razorbills on the Isle of May and sandeel stock biomass ( Figure 1.14 Open ▸ ).
Figure 1.14 Population size (individuals on land) of adult razorbills at the Isle of May (UKCEH data from online annual reports) in relation to ICES estimates of annual sandeel total stock biomass (tonnes) in SA4 between 2004 and 2021 (ICES 2022).
Puffin
- Return rates of puffins also showed a relationship with sandeel abundance ( Figure 1.15 Open ▸ ). It is important to note that, as with breeding success, these relationships are non-linear. There can be large differences in sandeel abundance between moderate and high abundance over which range adult survival remains high; survival falls much faster when sandeel abundance falls below a critical threshold level. This means that gains depend on the starting point on the graph. Residuals for each plot are in ANNEX B.
Figure 1.15 Annual return rates of adult puffins at the Isle of May (UKCEH data from online annual reports) in relation to ICES estimates of annual sandeel total stock biomass (tonnes) in SA4 between 2004 and 2018 (ICES 2022). Data for 2019-2021 are not yet published.
- There was also a relationship between the productivity of puffins on the Isle of May and the sandeel stock in SA4 across the same time period ( Figure 1.16 Open ▸ ). This relationship was slightly less clear than that for survival. This was likely due to the greater influence of weather and predation events strongly affecting the survival of eggs or chick, compared with the effects of these factors on adult survival.
Figure 1.16 Annual productivity rates of adult puffins at the Isle of May (UKCEH data from online annual reports) in relation to ICES estimates of annual sandeel total stock biomass (tonnes) in SA4 between 2004 and 2019 (ICES 2022). Data for 2020-2021 are not yet published.
- Puffins nest in burrows, which makes large colonies, such as the Isle of May, challenging to count. The counts on the Isle of May only occur every five years. There were therefore too few data to describe a relationship between the numbers of breeding birds on the Isle of May and the sandeel stock biomass in SA4.
Evidence that reducing or removing fishing pressure results in an increase in sandeel abundance
- While it has been shown that seabird demography is positively affected by sandeel abundance, it is also important to demonstrate that reducing or removing fishing pressure can result in a positive effect on sandeel abundance.
- Longer-term monitoring data show that with low fishing mortality in SA4 from 2005 to 2015, biomass of sandeels in SA4 increased from <100,000 tonnes around 2005 to >500,000 tonnes in 2015, providing further empirical evidence for recovery when fishing pressure is greatly reduced.
- A comparison of spawning stock biomass (SSB) with fishing effort (total number of vessel days in a year) showed that higher fishing effort resulted in lower SSB in the following year ( Figure 1.17 Open ▸ ). This comparison was made based on the change in SSB, as fishing effort is almost exclusively during the spring prior to the appearance of Group 0 fish in the stock. The fishery avoids catch of Group 0 fish, due to their lower lipid content, thus comparisons of fishing effort with SSB are more meaningful than comparisons with TSB. This comparison excluded the change in stocks following years with zero (or near zero) fishing effort. ICES defines SSB as 2+ group sandeels, which assumes that one year old sandeels are immature. While almost all 2+ sandeels spawn, some one-year-old sandeels also spawn but the proportion of spawning one year old sandeels varies between years. Thus, the ICES definition of SSB provides a more stable definition for making comparisons of the effects of fishing effort between years.
Figure 1.17 Change in SSB compared with fishing effort (vessel days) in SA4 for non-zero fishing effort years.
- Monitoring of sandeel abundance at Shetland ended shortly after the sandeel fishery terminated. However, seabird breeding success has only very recently shown much improvement, suggesting that any recovery of sandeel stock at Shetland was very slow, and incomplete. That would be consistent with the idea that recovery of a heavily depleted forage fish stock can be inhibited by high levels of natural predation imposed on the reduced biomass (the “predator pit hypothesis”; Saraux et al. 2020). Seabirds, marine mammals and large predatory fish remain numerous at Shetland. High levels of natural mortality seem a likely consequence of forage fish stock depletion when large numbers of predators remain in the system. The stock in SA4 has not shown a similar lack of recovery with TSB showing positive increases since the introduction of the box and reduction in fishing pressure (see Section 1.4)
- Studies of sandeels on numerous small sandbanks off southern Norway indicate a tendency for fishing of sandeels to cause depletion on the fished sandbanks, with recovery of sandeel abundance occurring after fishery closure (ICES 2017). However, full recovery may take some time, as depleted populations depend on high larval survival and settlement onto the sandbank. This could reasonably be expected to occur in a few years after the closure of fishing. However, to provide adequate compensation for the predicted impacts full recovery is not required. The evidence from Cury et al. (2011) is that stocks above one third of their historic maximum biomass is sufficient to provide forage fish for seabird populations. For the SA4 sandeel stock, this one third value is about 300,000 to 400,000 tonnes. Any recovery above this would result in smaller gains as the TSB level increases.
- When the box off east Scotland was closed to sandeel fishing, research was carried out to monitor the response of sandeels in that area immediately after the fishery closure. Closure of the fishery was followed by an immediate increase in sandeel stock biomass (Greenstreet et al. 2010) and over time altered the age structure of the sandeel population. When the stock was heavily fished, very few sandeels lived beyond two years old, resulting in high variability in abundance from year to year depending on the highly variable level of production of young fish. When the fishery was closed, sandeels tended to live longer, with large cohorts remaining in the stock for up to six years (Peter Wright, pers. Comm.). The longer life expectancy of sandeels when not subject to fishing not only increases mean biomass of the stock, but also reduces variability in abundance driven by variable recruitment.
- No closures have been implemented in SA1r, but detailed retrospective modelling (Lindegren et al. 2018) provides strong evidence that a reduction, or closure, of sandeel fishing on that stock would result in a large increase in sandeel stock biomass. Lindegren et al. (2018) stated, “Our results show that fishing largely contributed to the abrupt stock decline during the late 1990s” and conclude that reducing F at that time would most likely have maintained the stock biomass above ecologically safe levels rather than causing serious decline. However, they caution that complete recovery from the current depleted state might be impossible because of impacts of climate change and impacts of increased populations of predatory fish, especially mackerel.
- In summary, several examples show that sandeel abundance can recover after the closure of sandeel fishing, although this may not occur immediately after closure, particularly in cases of extreme depletion, such as in SA7. A process of recovery after reduced fishing mortality is also seen in many other depleted fish stocks around the world, so is typical of fish stocks and not just sandeels (Murawski 2010). It is also worth making the point that the sandeel fishery is mostly carried out during spring, relatively early in the seabird breeding season, and so removes fish that might otherwise be available to the seabirds that same breeding season.
Discussion and Conclusions
- Strong evidence was found for correlations between sandeel TSB in SA4 and adult return rates (as a proxy for adult survival), productivity and population size for all species, except for razorbill. Razorbill showed strong correlations between adult return rate and population size, but not productivity. It was thought that the lack of a relationship between sandeel TSB in SA4 and razorbill productivity was most likely due to the difficulty of studying the breeding success of this species, due to it’s preferred nesting locations in hard to observe locations, such as cracks in rocks, under boulders, etc.
- Strong evidence that the reduction or removal of fishing pressure in sandeel stocks in SA4 was also shown. This study showed that there was a negative correlation between SSB and fishing effort (in the previous year), thus SSB would be higher if fishing effort was reduced. Published evidence also showed that reductions in fishing pressure results in larger sandeel TSB.
- In conclusion, reduction or removal of fishing pressure in SA4 would highly likely result in increases in sandeel TSB. This increase in sandeel TSB would therefore highly likely result in greater adult survival and productivity of kittiwake, guillemot, razorbill and puffin which would in turn result in larger population sizes for these species.
1.7. Evidence that SA4 is the appropriate spatial scale for assessment
- The spatial scale of the response of seabirds to sandeels is key to both assessing the effects of reducing or removing fishing pressure on seabird demographics, but also in determining the appropriate spatial scale of fisheries management actions. Searle et al. (in press) compared the breeding success and diet of kittiwakes, guillemots, razorbills and puffins from the Isle of May with a range of sandeel stock and fisheries data. For all four species breeding success increased when sandeels formed a higher proportion of the diet. Guillemot, puffin and kittiwake breeding success was higher in years with high sandeel availability. The paper demonstrated that current fisheries management, through the application of the closed area (i.e. the sandeel “box”), has been only partially successful in protecting the foraging resources of breeding seabirds in eastern Scotland and north-east England. The paper concluded, based on the results of the analyses undertaken, that limited evidence for ecological net gain from closure of the sandeel fishery in the box in SA4 was demonstrated. While this is a reasonable inference to draw from the analyses undertaken, those analyses were mainly focused on the effects on diet and productivity and the effects of the application of the sandeel box as a fisheries management tool. The sandeel box appears to have had limited benefits to seabirds on the east coast of Scotland, most likely because it has not actually reduced the total harvest of sandeels from SA4, and because recovery of the sandeel stock after depletion in the 1990s took many years and has been further inhibited by high fishing effort in recent years in the open part of SA4.
- It is also apparent from analysis of kittiwake tracking data during the chick phase of the breeding season by Cleasby et al. (2018), that kittiwake colonies adjacent to the sandeel box forage across a much wider area than the box (Figure 1.18).
- To explore the responses of seabird demography to sandeel TSB in SA4, as the appropriate spatial scale for assessing the effects of sandeel abundance on seabird populations, data was sought from additional breeding colonies in SA4. The sandeel box in SA4 was a response to declines in seabird productivity following higher fishing mortality of the SA4 stock in the 1990s. If the sandeel box was effective a different demographic response to sandeel TSB in SA4 would be predicted between those seabird colonies foraging in SA4, both inside and outside the sandeel box. Data to explore these differences were very limited. Sandeel TSB data were only publicly available at the SA4 spatial scale and the only seabird demographic data available in the SA4 area at sites other than the Isle of May was productivity data from the SMP database. Consequently, the difference between productivity of colonies with more than five years of data within a fifteen year period where seabirds were likely to forage either inside the sandeel box or outside the sandeel box were compared.
- The availability of productivity data for seabird colonies within SA4 was reviewed. Suitable data were those where a site had a reasonable time series within the period from 2004 to 2021. It was only kittiwake where there were sufficient productivity data to provide a useful overview. These data were compiled across all sites within SA4 but separately for those colonies adjacent to the sandeel box and those outside the sandeel box. The total productivity was calculated by collating the field “Count” and “Fledged count” to provide the overall number of chicks per pair. For each species the SMP productivity plots used are summarised.
- Eight suitable productivity plots were found in the SMP database with suitable productivity data. Sample sizes varied from 10 to 18 years ( Table 1.1 Open ▸ ).
Table 1.1 Colonies with productivity plots in the SMP database with suitable data to compare with sandeel TSB between 2004 and 2021.
Data from the Isle of May for productivity values only are available from 2015 to 2019 from UKCEH, but these do not provide the number of pairs that productivity was based on so could not be collated with other data.
- The relationship between the combined productivity data from the productivity plots shown in Table 1.1 Open ▸ for sites inside and outside the sandeel box but within SA4 and the sandeel TSB in SA4 is shown in Figure 1.19 Open ▸ .
Figure 1.19 Relationship between kittiwake productivity of colonies on the east coast of SA4 inside and outside the sandeel box. See text for explanation of the sites included.
- The presence of a very similar relationship for colonies within SA4 that border the sandeel box and those within SA4 that do not border the closed box strongly suggests that the relationships derived from the Isle of May between demographic parameters and sandeel TSB in SA4 are sound and do not need to be assessed at a smaller spatial scale. It is important to note that productivity of kittiwakes (and other seabirds) will also be affected by other factors, particularly predation and weather. There is therefore some noise in the productivity data that is not controlled for in this analysis.
- Recent analyses by UKCEH have shown that the current management of the SA4 sandeel fishery through the use of the closed box has only been partially effective at maintaining the breeding success of seabirds that forage within the box (Searle et al. in press). This is in agreement with the analysis above, showing little difference in the change in productivity of kittiwakes to changes in sandeel TSB for colonies located adjacent to the box compared with outside the box.
- This is likely because the sandeel box has not reduced fishing effort on the sandeel population in SA4 but has displaced fishing to areas directly to the east of the box ( Figure 1.20 Open ▸ ). While this may not have affected sandeel stocks in the box itself, the analyses above shows that seabirds located adjacent to the box still have a strong relationship with the TSB of sandeel in the whole of SA4.
Figure 1.20 Sandeel fishing effort in the North Sea (from ICES 2022).
- It is apparent from the relatively crude metric of the mean of the maximum foraging range (Woodward et al. 2019) that it is likely that the species being assessed here do forage beyond the sandeel box, and the analyses by Cleasby et al. (2020) confirms from modelled tracking data that areas to the east of the box are also important to foraging seabirds.
- It is important to note that these foraging range metrics and analyses are based on only part of the breeding season (mostly the early chick phase). Evidence shows that foraging behaviour of seabird changes through the breeding season, with longer foraging trips occurring during both the incubation phase and later in the breeding season, both of which are not well captured by these foraging range metrics (see Section 1.5). In addition, theory suggests (Ashmole’s halo hypothesis) that as the season progresses prey stocks are depleted by foraging seabirds and so individuals have to forage further from the colony. Thus, when in the breeding season tracking data was collected will not necessarily be representative of foraging locations later in the season. This means it is more likely that areas beyond the sandeel box, and the sand banks therein, become less important to seabirds as the breeding season progresses. This effect has been demonstrated in several tropical seabirds, and in Brunnich’s guillemot Uria lomvia (Elliott et al. 2009)
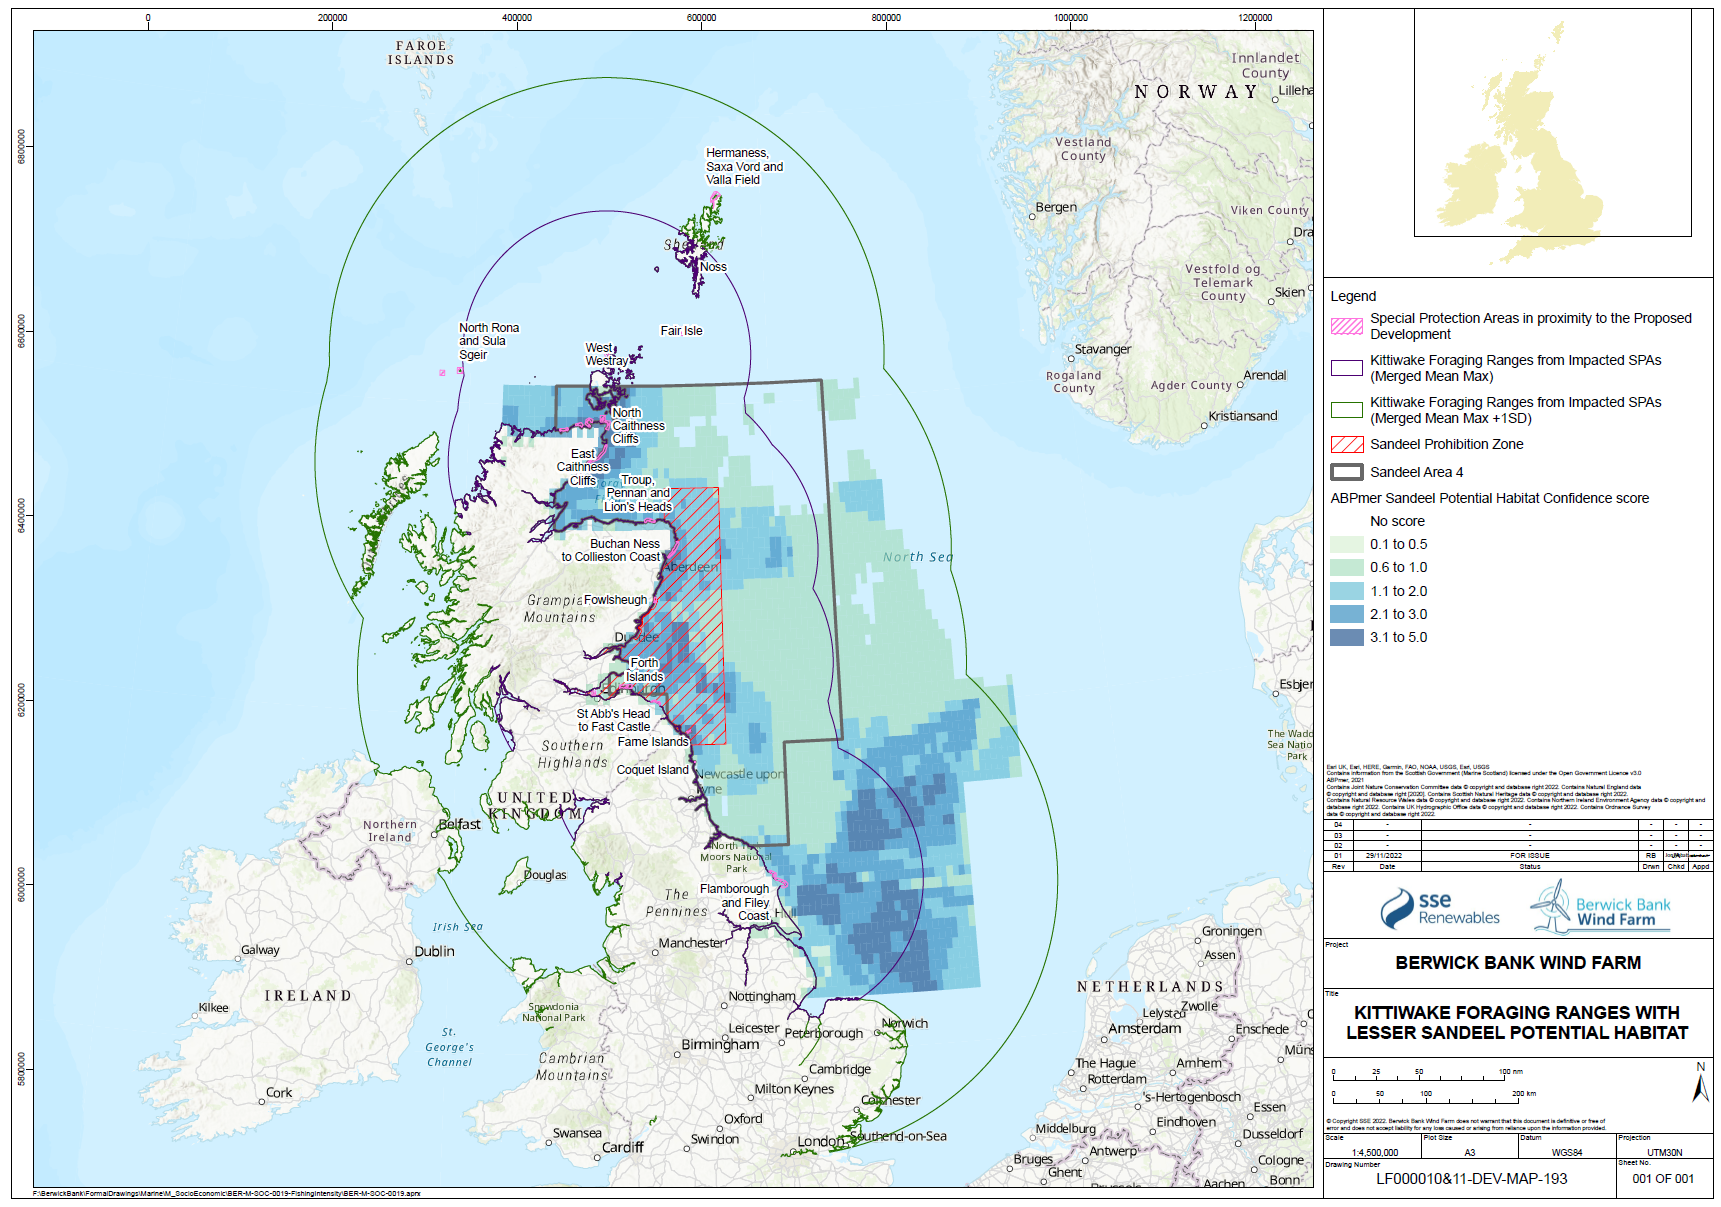
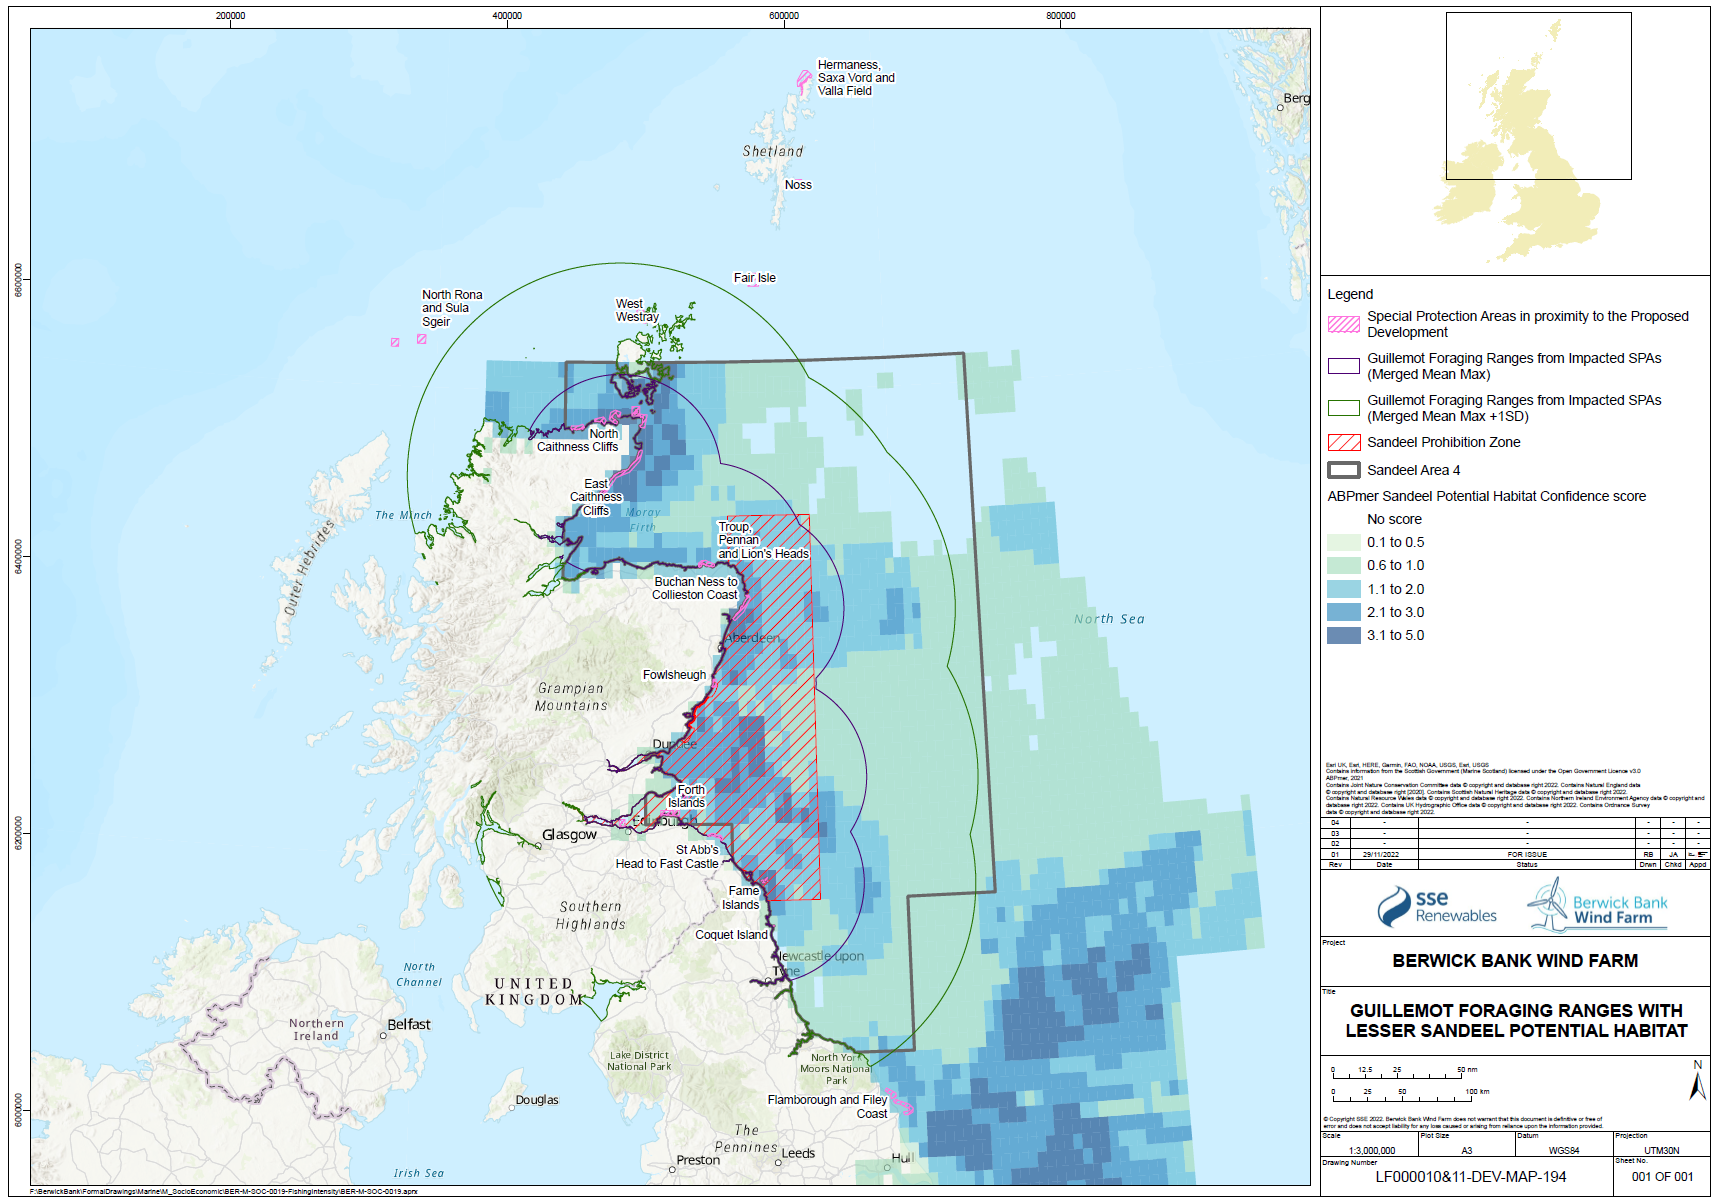
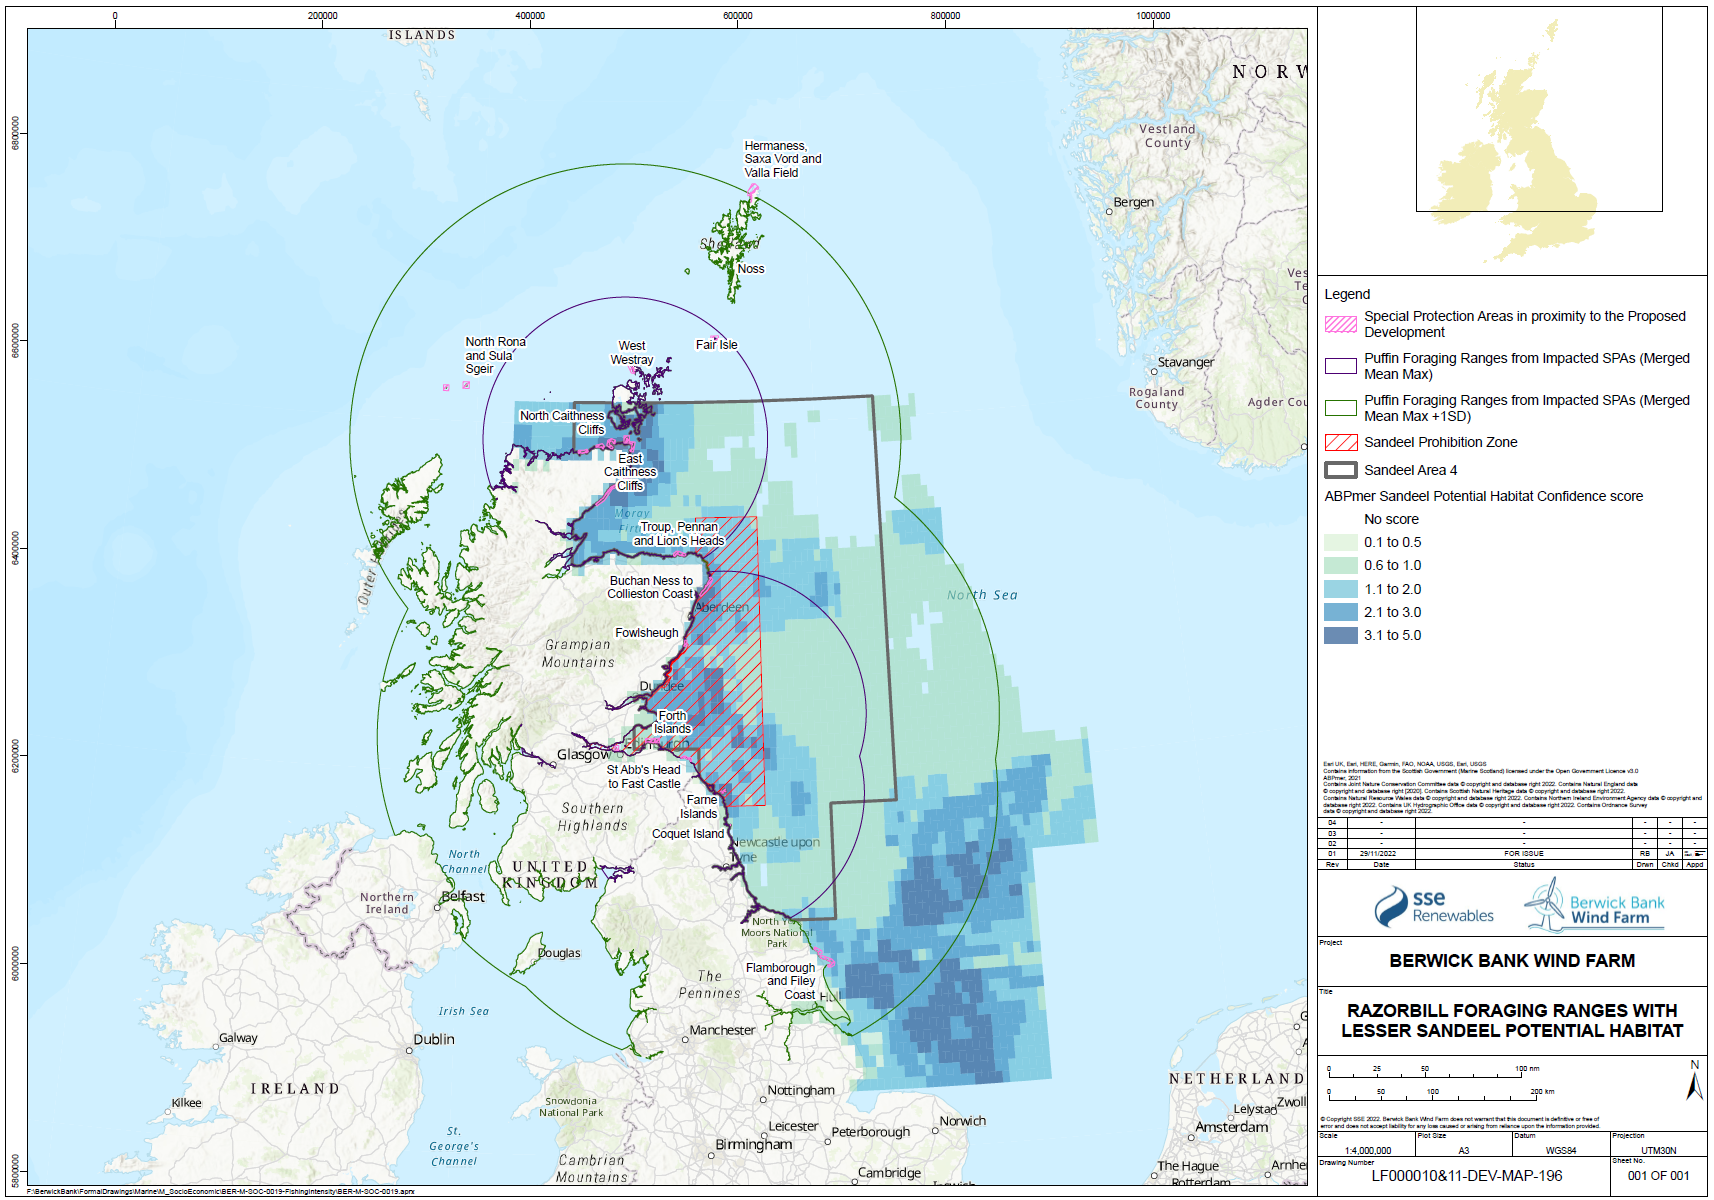
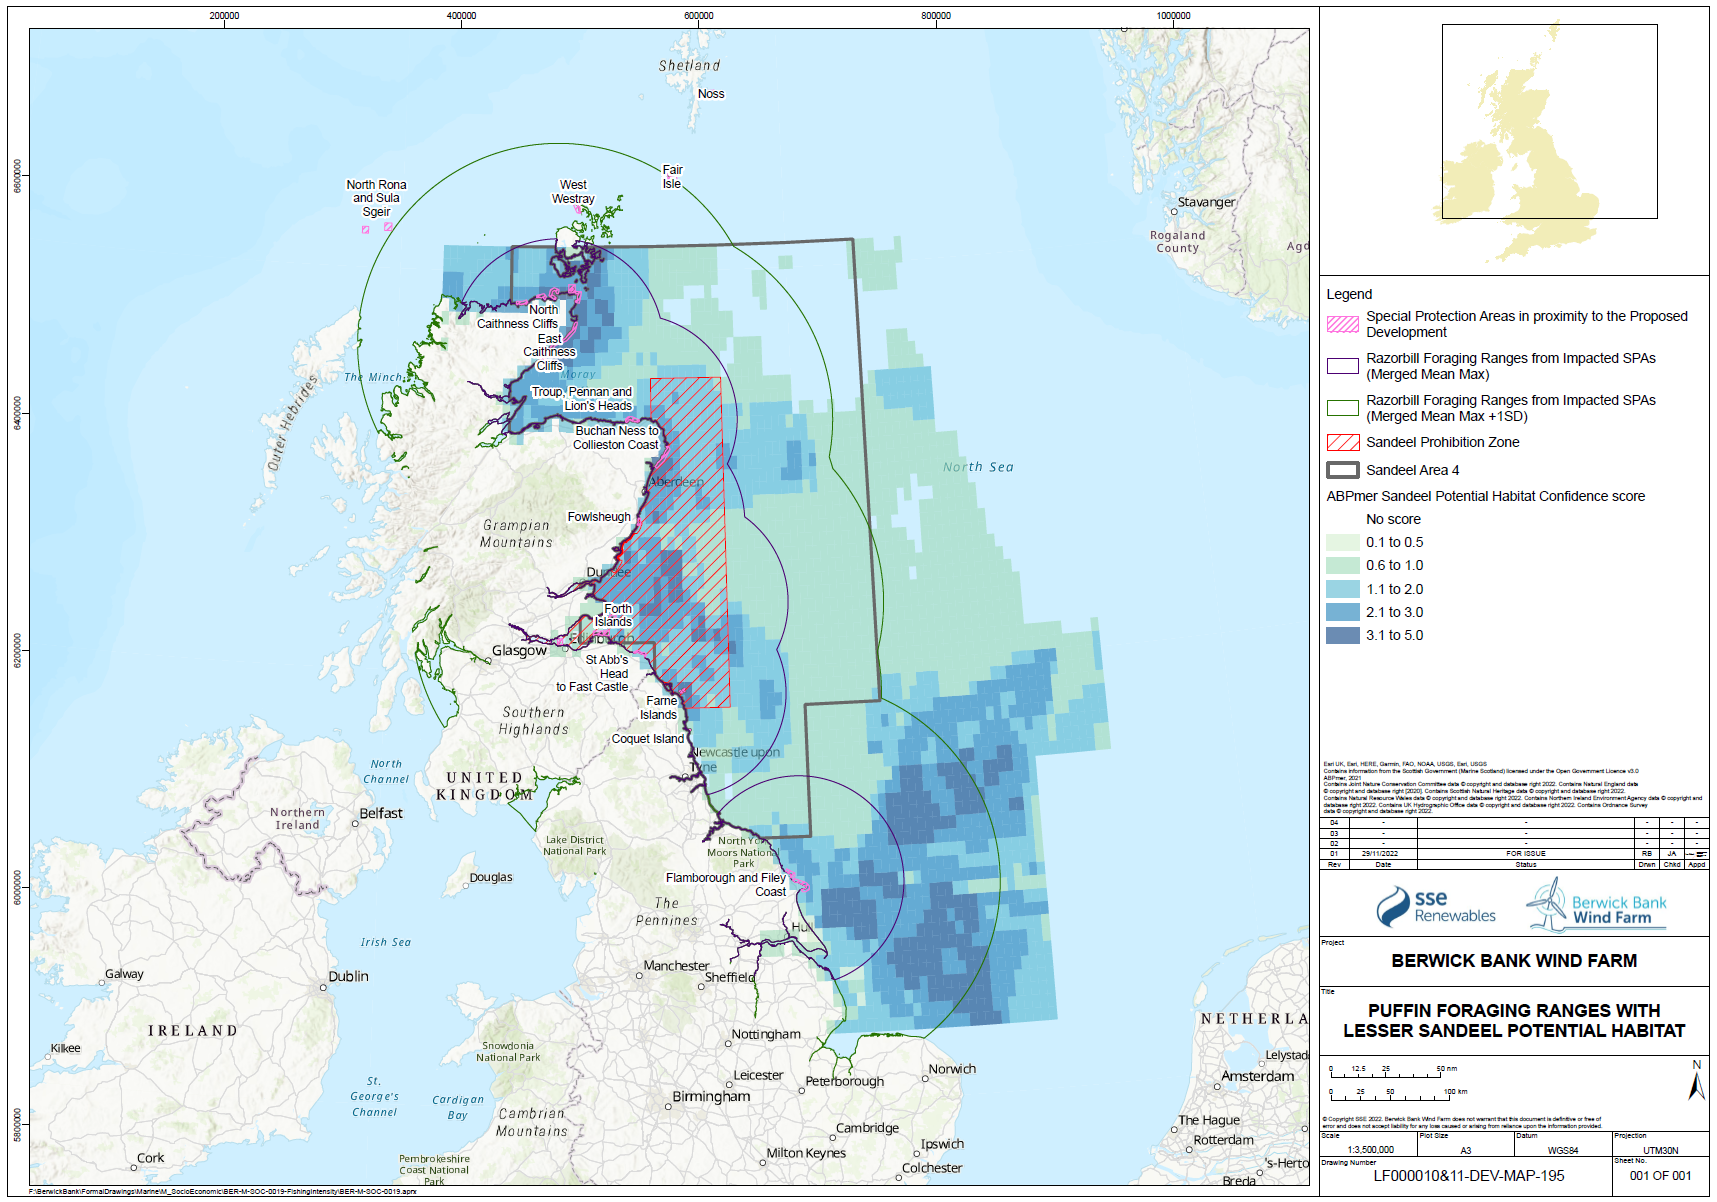
- While individual sandeels are sedentary (Wright et al. 2019, Jensen et al. 2010), seabirds are highly mobile and able to forage overall large areas of sea. The relative spatial distribution of sandeel potential habitat confidence, SPAs with connectivity to the Proposed Development and the sandeel box are shown for each species in Figure 1.21 Open ▸ to Figure 1.24 Open ▸ .
- The sandeels in the habitat outside the closed box may be particularly important to seabirds in the period immediately post-breeding as they disperse from their breeding colonies. This may be a critical energetic bottleneck for some species, particularly auks where parental care continues following fledging, and this can overlap with the moult period. While auks may have reduced energetics costs to diving after moulting their flight feathers, they are also provisioning chicks while growing new feathers. Seabirds will also be trying to regain body mass lost through the breeding season and it is known that body mass at the end of the breeding season is an important factor in predicting over-winter survival rates.
- There is a high degree of inter annual variability in the location and level of recruitment into the sandeel population as demonstrated by the different location and intensity of sandeel fishing across SA4 and the wider North Sea. Given that it is difficult to predict the location and quantity of sandeels that are available it is logical to manage fishing pressure across the whole of SA4 to provide the best opportunity for seabirds to respond to the natural variability in the stock levels. CEH has demonstrated that current sandeel box is not large enough to deliver the benefits that might be expected.
- Managing fishing pressure for the whole of SA4 will lead to a change in the age structure of the SA4 population with a greater number of sandeels reaching older age classes. This will lead to lower variability of recruitment each year which is likely to lead to higher levels of productivity via lower breeding abandonment in poor prey years.
Climate change impacts on sandeels in the North Sea
- Climate change impacts on sandeels in the North Sea relate mainly to climate warming effects on their planktonic food and climate warming effects on sandeels themselves. Causes of ocean warming are now well understood, as are the general effects of ocean warming on ecosystems, plankton and marine fish, and the consequences of these effects for biodiversity, ecosystem stability, wildlife, and ecosystem services to humans (Laffoley and Baxter 2016). Warming ocean and sea temperatures have already caused significant poleward movements of the edges of zooplankton geographical range. Polewards shifts of large copepods that have a strategy of storing lipid for overwinter survival have been especially pronounced, to be replaced by smaller, faster growing copepods that do not store lipid because they are adapted to warmer climates (Edwards 2016). Since sandeels feed on large lipid-rich copepods (Arnott and Ruxton 2002, van Deurs et al. 2009, 2013, 2015, ICES 2017) there is an ecological linkage that predicts an impact of climate warming on food availability to sandeels through bottom-up food web changes (Cheung and Pauly 2016).
- Climate warming may also shift the seasonal timing of processes in a way that could reduce the synchrony between predator and prey, and so reduce the efficiency of energy transfer up marine food chains (Edwards 2016). The spring bloom of phytoplankton in temperate/sub-Arctic regions is controlled by light intensity and photoperiod, so has remained relatively stable in phenology over recent decades despite warming (Edwards 2016). However, some zooplankton and some fish larvae have moved significantly earlier in their seasonal cycles, which can reduce trophic transfer efficiency (Cheung and Pauly 2016, Edwards 2016).
Research on relationships between climate, zooplankton and sandeels
- Arnott and Ruxton (2002) showed that warmer sea temperatures correlated with poorer than average recruitment of sandeels in the southern North Sea. Arnott and Ruxton (2002) also found a positive association between sandeel recruitment and the abundance of Calanus finmarchicus copepod stages V and VI around the time of larval hatching and inferred that the availability of this prey species is important for survival of young sandeels. In the southern North Sea higher sandeel spawning stock biomass in SA1r was significantly associated with lower temperatures and with lower sandeel fishing mortality, the latter effect being statistically the stronger (Carroll et al. 2017). These effects of climate warming and fishing mortality driving sandeel stock biomass are not limited to the North Sea. The same effects have been identified for sandeel stocks elsewhere. For example, the biomass of sandeel stocks off the south coast of Japan is affected by climate warming but especially by the level of fishing mortality (Funakoshi 1998).
- A study by Henriksen et al. (2021a) concluded that during the first year of life in the North Sea, sandeel size has a large influence on survival, indicating a positive relationship between growth rate and survival. There was little or no effect of sea temperature on that relationship. However, Henriksen et al. (2021a) found that during the second year of life, autumn seabed temperature was negatively correlated with sandeel abundance, suggesting higher mortality in warmer years. Whereas winter temperatures tend to be similar between the northern and southern parts of the North Sea, in summer and autumn the temperatures are considerably higher in the southern North Sea. Southern parts of the North Sea were the areas showing the strongest response of sandeels to temperature (Henriksen et al. 2021a), further supporting the suggestion of Arnott and Ruxton (2002) that southern populations of sandeels may be more at risk from climate warming. However, there is a contradiction between these two studies, in that Henriksen et al. (2021a) suggest that temperature effects are on 1-year old sandeels but not on 0-group sandeels and are mediated by autumn temperatures, whereas Arnott and Ruxton (2002) reported effects on 0-group sandeels in relation to late-winter and spring temperatures.
- Survival of larval sandeels in the North Sea is thought to be strongly influenced by abundance of the large copepod Calanus finmarchicus, raising the possibility that climate-generated shifts in the Calanus species composition and timing of the spring bloom of zooplankton abundance may lead to a mismatch between food availability and the early life history of sandeels (van Deurs et al. 2009). Models of foraging by sandeels predict that changing from a situation where large Calanus finmarchicus copepods dominate the zooplankton to a situation where only relatively small and less energy-rich copepods are available (the trend predicted as a result of climate warming) roughly halves the energy intake of sandeels even if prey biomass concentration remained constant, mainly because of visual constraint on foraging rate of sandeels but also due to handling time limitation and prey energy content (van Deurs et al. 2015). Climate warming effects on zooplankton community composition, which are occurring in the North Sea (Bedford et al. 2020), therefore have profound implications for sandeels. However, Olin et al. (2022) questioned whether sandeels are dependent on these large energy-rich copepods or whether they may be able to cope well on a prey field dominated by smaller copepods. That question is in direct contradiction to the conclusion of van Deurs et al. (2009) that Calanus finmarchicus abundance explains around 65% of the inter-annual variation in sandeel recruitment. It is also contrary to evidence from Arnott and Ruxton (2002) and from sandeel stomach content analysis (van Deurs et al. 2013). ICES (2017) also concluded that Calanus finmarchicus abundance strongly influenced growth and recruitment of sandeels in the SA1r region.
- Studying sandeels in the north-west North Sea from 2000 to 2018, MacDonald et al. (2019) found that low sandeel abundance correlated with low growth rate. Growth performance indices were correlated with zooplankton and phytoplankton biomass but were not influenced by variations in sea temperature. They concluded that sandeel abundance in that region was affected by food availability but not by sea temperature.
- Studies of sandeel egg development at different temperatures showed important temperature effects on egg development rate but indicated that these effects are only minor contributors to the observed variations in hatch dates among years (Regnier et al. 2018). Sandeels remain buried in seabed sandy sediment from late summer through winter. In spring, they emerge to feed on zooplankton. The overwintering strategy of sandeels involves a trade-off between energy gain and survival probability (van Deurs et al. 2010). This strategy will be influenced by climate warming effects on phenology and zooplankton abundance and species composition. Since variation in copepod timing at a Scottish coastal monitoring site was mainly influenced by February temperature whereas sandeel phenology was more closely related to rate of seasonal temperature decline in autumn and winter (Regnier et al. 2019) there is some scope for effects of increasing sea temperatures to result in an increased risk of mismatch between sandeels and they prey (Regnier et al. 2017, 2019). However, modelling this relationship indicated that individual fitness “is only marginally reduced in individuals that fail to optimize the foraging window in relation to the level of mortality and prey availability experienced during the zooplankton spring bloom” (van Deurs et al. 2010).
- Using commercial catch data (catch per unit effort) to describe sandeel emergence, Henriksen et al. (2021b) investigated the timing of sandeel emergence into the water column in spring in relation to sea temperature. Variation in emergence behaviour among years was correlated with variation in sea bottom temperature. Warmer years were characterised by earlier emergence by sandeels. However, although significant warming was evident in the North Sea over the last three decades, no net shift in the timing of emergence was detected over that 30-year period, suggesting that this effect of climate warming is rather small.
- The sandeel is an example of a capital breeder, as its gonad development depends entirely on stored energy reserves while the fish remains buried in sandy sediments of the seabed. Laboratory studies of sandeels kept at different temperatures showed that loss of mass was greater in the higher temperature treatment, consistent with fish at higher temperature having higher metabolic costs (Wright et al. 2017). However, somatic energy loss did not differ between temperatures, the net change in mass being related to lower relative gonad size in the fish at higher temperature. The study concluded that warming sea temperatures will lead to a reduced reproductive investment by adult sandeels but will not impact their overwinter survival.
- In inner Danish waters the seabed can become oxygen deficient during warmer summer months (hypoxia). This hypoxia impacts on sandeels by making sediments unsuitable for sandeel survival (Behrens et al. 2009). All else being equal, increased sea temperature will tend to increase risk of hypoxia, so there is a risk of loss of suitable sandeel habitat as a result of increased hypoxia of sediments in the North Sea. However, very few areas of UK North Sea waters are likely to be at risk of sediment hypoxia (this is most likely where water flow is low, and inputs of organic matter are high). The areas favoured by sandeels are areas of coarse sand rather than areas of mud and it is unlikely that hypoxia will affect such sandy sediments (where the sand grain size is maintained by moderate water flows with little input of fine sediment or organic matter).
- It is acknowledged that there are somewhat contradictory results in the published literature regarding sandeel relationships with zooplankton and with climate warming. However, the majority of the literature suggests a dependence of sandeel growth and survival on availability of large Calanus finmarchicus copepods, and some tendency for sandeel recruitment or survival to be reduced in warmer sea temperatures in the southern part of the North Sea, but apparently to be much less influenced by sea temperature in the northern North Sea. This raises specific questions about how the southern and northern parts of the North Sea differ and how that influences sandeel demography and abundance.
Differences between southern and northern North Sea ecosystems
- Analysis of 60 years of continuous plankton recorder data shows that there is considerable spatial variation in the zooplankton prey field available to sandeels in different regions (Olin et al. 2022). The authors of this study caution against inferring ecological consequences based only on large-scale trends in key taxa or mean community traits. However, they found generally higher abundance of large Calanus copepods further north, but also found pronounced decline in the abundance of small copepods in the western North Sea over this survey period.
- Between 1901 and 2020, sea surface temperature increased more in the southern North Sea than in the northern North Sea (NOAA 2021). This is likely to relate to the inflow of Atlantic Ocean water into the northern North Sea (van der Molen and Pätsch 2022) buffering impacts of warming atmospheric conditions that have a stronger influence on the shallower water in the southern North Sea. The southern North Sea has warmed twice as fast as the average for the world’s oceans, consistent with the influence of continental warming and the relatively shallow nature of the southern North Sea[2]. The cooling effect of Atlantic water flowing into the North Sea also results in the UK coastal waters being cooler in summer and autumn than the continental coastal waters, especially at the same latitude in the northern North Sea. The northern and southern North Sea also differ in summer stratification as a result of differences in water depth. In the northern North Sea, the water is seasonally stratified each year, whereas in the southern North Sea stratification only occurs in years with exceptional summer heat, a situation which is occurring more frequently with climate warming (Chen et al. 2022). Whereas most nutrient input into the northern North Sea comes from inflowing Atlantic water (van der Molen and Pätsch 2022), the southern North Sea is strongly influenced by nutrient inputs from major European rivers (Desmit et al. 2019). The nutrient input from rivers had been elevated for many decades by agricultural and industrial inputs (nutrient pollution) but these inputs have been reducing since the mid-1980s due to more effective regulation (Desmit et al. 2019). The de-eutrophication process in the southern North Sea correlates with a slight reduction in phytoplankton production (as indicated by chlorophyll measurements) since the late 1980s (Desmit et al. 2019). This could have bottom-up effects on zooplankton and therefore on sandeels in the southern North Sea but there has been no equivalent de-eutrophication in the northern North Sea because nutrient loads there have never been significantly influenced by river-borne pollution (van der Molen and Pätsch 2022).
- Between 1983 and 1996, sandeel recruitment (after correcting for effects of the biomass of each age class) was significantly higher in years with cooler winter and spring sea temperatures in the southwestern North Sea (Arnott and Ruxton 2002), the area labelled ‘region 1’ by Arnott and Ruxton being approximately congruent with what is now defined as the SA1r sandeel stock distribution. Arnott and Ruxton (2002) concluded that climate warming may result in the northward shift of that southern limit of sandeel stock distribution in the North Sea because recruitment could become compromised by rising temperatures in the southern North Sea. However, in the northern North Sea (specifically an area they labelled ‘region 2’) they found very little evidence of any relationship between sandeel recruitment and sea temperature. In their region 2, there was a slight trend towards higher recruitment in cooler years, but almost all monthly correlations failed to reach statistical significance. Arnott and Ruxton (2002) suggest that in relation to sandeel recruitment “whereas temperature may be a more important proximate cause in region 1, more indirect routes may predominate in region 2”.
- Although abundance of large copepods declined in the southern and eastern North Sea, their abundance shows no significant long-term trend in waters off east Scotland (broadly corresponding to SA4) and in that region there is no significant correlation between sea temperature and abundance of large copepods (Bedford et al. 2020). If sandeel recruitment is affected by large copepod abundance, then this lack of any relationship with sea temperature off east Scotland may contribute to the general observation that sandeels in SA4 appear less sensitive to sea temperature change than in the southern North Sea. This lack of a sea temperature effect on Calanus finmarchicus in SA4 can be explained by the observation that interannual variability of Calanus finmarchicus abundance in the north-western North Sea is mainly determined by the inflow of Calanus finmarchicus in North Atlantic water entering the northern North Sea (Gao et al. 2021). Calanus finmarchicus is considered not to be self-sustaining in the North Sea but is highly dependent on inflow from the Faroe-Shetland Channel bringing large quantities of Calanus finmarchicus into the North Sea (Gao et al. 2021). This further emphasises the independence of Calanus finmarchicus abundance in the northern North Sea from effects of increased warming of North Sea waters by climate change.
- While much emphasis has been put on the ‘bottom-up’ limitation of sandeel stock biomass through climate-mediated changes in zooplankton species composition and biomass, and the ‘top-down’ influence of sandeel fishery mortality, it should also be recognised that other ‘top-down’ influences may be present (Frederiksen et al. 2007). These include impacts of natural mortality (especially predation by adult herring, mackerel, whiting and other predatory fish). Frederiksen et al. (2007) indicated that top-down predation by predatory fish is likely to be more important in the northern North Sea than in the southern North Sea, such that the relative importance of bottom-up and top-down control on sandeels may differ between regions. This regional difference in the strength of natural mortality is also recognised, and incorporated into sandeel stock assessments, by ICES (2017).
- In the southern North Sea SA1r area, there is a correlation between the few years of exceptionally high recruitment of sandeels and an unusual pattern of net direction of water transport in the area (Henriksen et al. 2018). This pattern may be specific to this area but suggests that sandeel recruitment may be influenced by variation in hydrographic pattern. That water flow pattern may in turn be influenced by climate change.
- It is evident there are huge differences in the ecology of the southern and northern parts of the North Sea. These differences are driven in part by hydrographic influences, especially the important inflow of North Atlantic water into the northern North Sea and the flow of major European rivers into the southern North Sea, and in part by sea depth differences affecting stratification and the coupling between atmospheric warming and sea temperature change. This affects zooplankton community composition, seasonal change in sea temperature, and the rate of sea temperature increase caused by climate warming. Sandeel stocks in the southern and in the northern North Sea are therefore exposed to very different environmental pressures. Whereas southern North Sea sandeels appear subject to strong sea temperature effects and appear vulnerable to climate warming, the ecological patterns in the northern North Sea indicate that sandeels in the northern North Sea are probably more strongly influenced by variability in natural mortality pressures and are less vulnerable to climate warming effects because of the buffering influence of North Atlantic water inflow.
- Sandeels may not recover to levels seen in the 1990s, but reduction of fishing pressure is the most important single influence, and valuable to create resilience.
- Lindegren et al. (2017) modelled the sandeel stock dynamics in SA1r and concluded that although the main driver of stock biomass was fishing mortality, the abundance was also influenced by availability of preferred prey (Calanus finmarchicus and Temora longicornis) and by climate. Lindegren et al. concluded that the reduction of fishing mortality would lead to a large increase in sandeel stock biomass but that “a complete recovery of the stock to the highly productive levels of the early 1980s would only be possible through changes in the surrounding ecosystem, involving lower temperatures and improved feeding conditions”. The authors therefore stressed “the need for ecosystem-based management accounting for multiple internal and external factors occurring within the broader context of the ecosystem in which forage fish species, such as sandeel, play an important and integral part”.
- Ecopath/Ecosim modelling also indicated an influence of climate warming on the recovery of sandeel stocks if fishing mortality was reduced (Natural England unpublished report). However, this modelling indicated that despite climate change effects, reducing fishing mortality on sandeels would lead to a large increase in sandeel abundance, and therefore a large increase in seabird abundance.
- In SA4 the effects of climate warming will be less than in the southern part of the North Sea (Henriksen et al. 2021, NOAA 2021), but the principle that complete recovery is improbable because of climate-warming impacts is still likely to apply to some extent. We can conclude that sandeel stock biomass in ICES SA4 will probably not recover to the historical maximum levels present before sandeel fishing began in the region, but that reducing fishing pressure on sandeels in SA4 will be the single most effective means of allowing sandeel stock biomass to increase from the present depleted levels to a higher abundance limited by the availability of zooplankton prey and temperature constraints as now influenced by climate warming.
- There is a consensus that warming of the southern North Sea makes that area less suitable for sandeels, both by reducing the abundance of their preferred prey and by increasing metabolic rates of fish at a time when they depend on stored lipid for survival. However, warming of the southern North Sea makes that environment suitable for other forage fish that prefer warmer waters and their associated plankton communities. Both anchovy (Engraulis encrasicolus) and pilchard (Sardina pilchardus) have increased in abundance in the North Sea in recent decades (Petitgas et al. 2012, Raab 2013, Heessen et al. 2015). Those two species are the most important forage fish for seabirds in southern Europe (Gaspar et al. 2022), which include seabird species that are abundant in the North Sea, so may play an increasing role as an alternative food for seabirds in the North Sea in future.
- it is important to emphasise the consistent conclusion reached by two entirely different modelling approaches; both Natural England’s Ecopath with Ecosim model and the Lindegren et al. (2017) stock assessment hindcast model which both predict that reducing fishing mortality on sandeels would lead to a large recovery in sandeel stock biomass from the present levels that are depleted by fishing. Reduced fishing pressure on sandeels can also be expected to make the population more resilient to impacts of climate warming (Cheung and Pauly 2016). In addition, warming temperatures may allow anchovy and pilchard to become increasingly abundant in the southern North Sea, providing an alternative forage fish food supply for seabirds.
How much recovery of sandeel stock biomass is required?
Depletion of stocks of cod, whiting and haddock during the 20th century, followed by severe depletion of herring and mackerel stocks since the 1960s, will all have influenced sandeel stock biomass, even before sandeel fisheries grew to a scale that was likely to reduce sandeel biomass from the late-1970s onwards. It is important to recognise that it is not necessary for sandeel stock biomass to recover back to the abundance that would have been present in the absence of imposed fishing mortality before climate warming had any effect in order to benefit dependent seabirds. The research presented by Cury et al. (2011) shows that seabird demographic responses to prey abundance are sigmoidal; prey abundance below a critical threshold leads to failure. When prey abundance is above the critical threshold the exact abundance becomes relatively unimportant. That threshold was consistent across 14 seabird species in seven distinct global ecosystems (which included sandeel stocks supporting terns, kittiwakes and auks) and approximated to one-third of the maximum prey biomass observed in long-term studies. Increasing prey abundance from slightly above the one-third threshold to the highest observed abundance has very little further gain to seabird demography. The key influence is to get prey biomass above the one-third threshold and to maintain it above that threshold. There is no need to increase prey biomass to the historical maximum. Therefore, if climate warming reduces the environmental carrying capacity for sandeels, it would only represent a significant constraint if the impact of climate warming was to limit sandeel stock biomass below the ‘one-third for the birds’ threshold biomass identified by Cury et al. (2011). Available evidence based on predicted warming over the coming decades suggests that such a strong effect of climate warming on sandeel carrying capacity of the ecosystem is unlikely even in the southern North Sea where climate warming effects are greatest.
Discussion and Conclusions
- The presence of published evidence that sandeel abundance strongly affected breeding success and abundance across a wide range of breeding seabird species in Shetland led to analyses to examine if similar relationships occurred for kittiwake, guillemot, razorbill and puffin foraging in SA4.
- Strong relationships were found between sandeel abundance and seabird abundance, productivity and return rate (a proxy for adult survival) for all the species assessed, with the exception of razorbill, where there was no relationship with productivity (likely due to the greater influence of weather and predation events negatively affecting the survival of eggs or chick, compared with the effects of these factors on adult survival).
- There was also strong evidence of recovery of sandeel stocks in the North Sea following closure of the fishery, which includes evidence from the sandeel box in SA4. In some case recovery may be slow. However, recovery to previous levels at, or close to ecological capacity is not needed to offset the potential impacts of the Proposed Development. Every modelled recovery scenario, covering a wide range of possible levels of Sandeel TSB, demonstrates that any recovery in the sandeel TSB generates a large compensation surplus.
- Various elements combine to strongly suggest that the management of fisheries at the SA4 scale is likely to be the most effect scale for compensation. It is apparent that the sandeel box will protect only some of the sandeel stocks used by breeding seabirds. Foraging range information, based on tracking data from a relatively limited period of the annual cycle, shows important areas of sandeel habitat outside the box. New analyses of kittiwake productivity from colonies likely to be foraging inside the box and outside the box, but still within SA4, showed no important difference in the relationship between productivity and TSB in SA4. Finally, the presence of strong relationships between each of adult population size, return rates and productivity and TSB in SA4 shows that the population is responding to changes at this spatial scale. It seems likely, therefore, that at least this scale is important to seabirds breeding on the east coast of Scotland. This may be because of the importance of areas beyond typical foraging range in poor sandeel years and in the periods of the annual cycle outside the breeding season.
- The current management of sandeel stocks in SA4 does not account for the presence of the box. So sandeel TAC is based on the TSB in all of SA4, not just the stock outside the box. Given the sedentary nature of individual sandeels, this suggests that impacts on sandeel stocks outside the box could be particularly severe. These areas may be important to seabirds during periods of the annual cycle not assessed through tracking during the early chick phase.
- Thus, management of sandeel fisheries to reduce or remove fishing pressure for the whole of SA4 is very likely the most effective measure to compensate for predicted impacts.
1.8. Likely gains to seabirds from sandeel fisheries change
- The context-dependent effect of sandeel abundance on seabird demography, together with uncertainty about the time-course and extent of recovery of sandeel biomass, and uncertainty about gains in terms of seabird survival rates (which can often drive population trend more strongly than breeding success in long-lived birds such as seabirds) makes predicting the gains to be obtained from reducing or removing sandeel fishing pressure complex, and relatively uncertain at a quantitative level. The evidence for qualitative gain is strong.
- The presence of relationships between changes in sandeel abundance and seabird demographics would be predicted to result in changes to seabird populations sizes. Most seabirds have demographic processes characterised by relatively high annual adult survival and relatively low annual productivity. So positive effects of sandeel abundance on annual adult survival should result in stronger population size change than effects on annual productivity. In addition, direct benefits of sandeel abundance on adult survival has immediate positive effects on protected seabird populations, as it results in more adult birds in the population, than positive effects on productivity, as it takes several years for the fledged chicks that survive to adulthood to be available to recruit into the population. Both the number of additional birds per annum and the number of chicks that survive to adulthood can be estimated from a predicted change in adult survival or in productivity. These parameters can also be used in Leslie matrix population models to project the change in population size or growth rate.
- In SA7r there is no sandeel fishery. If that remains the situation, some further recovery of sandeel stock at Shetland may be anticipated over coming years. No options for compensation by restricting sandeel fishing are likely to be available in SA7r.
- In SA4, the sandeel stock was heavily fished in 1993 to 1999, and in 2003 (ICES 2022). Total stock biomass fell from peaks of 772,000 tonnes in 1995 and 780,000 tonnes in 1997 to 33,000 tonnes in 2008 (ICES 2022). The sandeel box has somewhat limited fishing impact on this stock since 2000 and the stock biomass has increased from a low of 33,000 tonnes in 2008 to 480,000 tonnes in 2020 (ICES 2022). The Cury et al (2011) “one-third for the birds” threshold for this stock is approximately 300,000 tonnes. The stock was below that threshold from 2002 to 2009 but has been slightly above the Cury et al. (2011) threshold since 2015 and as a consequence good breeding success of kittiwakes would be expected now. Consistent with that, Isle of May kittiwake monitoring reported 1.07 chicks per pair in 2015, 0.78 in 2016 and 0.94 in 2017. Breeding success of kittiwakes can be 1.3 to 1.4 chicks per pair in ideal conditions, so there is some scope for improvement even now. However, catches taken from SA4 have increased recently ( Figure 1.25 Open ▸ ), and present management does not prevent stock depletion below the Cury et al. (2011) threshold from taking place if the fishing effort increases in future.
Figure 1.25 Sandeel TSB compared with catches in SA4 over time (data from ICES 2022).
- For immature birds, there is no evidence as to the relationship between survival rate and sandeel stock biomass, but theory would suggest that effects would be greater for immature birds than for adults because they are less experienced and have higher mortality. Improving food resources should therefore have even stronger effects on immature survival than seen for adult survival for those immature birds that are in the SA4 area.
- A series of plausible scenarios were created to describe the potential effects of sandeel fisheries compensation on adult survival rates for each species. However, a precautionary scenario was developed that assumed no influence on survival of immatures or on age of first breeding.
- With a Cury threshold of approximately 300,000 tonnes, five potential scenarios were considered that span the likely range of sandeel TSB from historic data ( Figure 1.26 Open ▸ ). Increases in sandeel stock biomass from below 300,000 tonnes were considered useful as there have been TSB values of this scale during the population recovery and the non-linear relationships between TSB and species adult survival and productivity showed the largest change in demographic values across these TSB values. Changes from 100,000 to 200,000 tonnes and 200,000 tonnes to 300,000 tonnes were therefore estimated. Both the historic TSB values from the 1990’s and a few of the more recent TSB values since stocks began to recover have been between 300,000 tonnes and 800,000 tonnes. So, in addition, increases in stock biomass from 300,000 tonnes to 400,000, 600,000 and 800,000 tonnes provided information on plausible future sandeel stock biomass levels being maintained above the Cury threshold but below the historic maximum stock biomass.
Figure 1.26 Sandeel TSB in SA4 compared with modelled scenarios.
- The Sandeel TSB for each individual North Sea stock is estimated using the best available stock assessment models and following ICES best practice. The assessment is carried out each year by an international team of fisheries experts, including experts from Marine Scotland and Cefas, and is published in detail in the Herring Assessment Working Group (HAWG) annual reports which are available online on at the ICES web page[3]. The details of the assessment methods are also reviewed in ICES benchmark reports that update the assessment methodology every few years and these are also available online at the ICES web page.
- The stock assessment presents estimates of stock biomass on 1st January in each year. Biomass will increase as fish grow in spring and will increase as larvae recruit into the stock in summer. Biomass will decrease as a result of predation, which occurs throughout the year but especially in summer. The biomass available to seabirds during the breeding season of any year will be closely similar to the estimate of stock biomass on 1st January of that year.
Kittiwake
- Adult kittiwake return rates correlated with sandeel stock biomass ( Figure 1.6 Open ▸ ). This non-linear relationship indicated that adult survival could increase rapidly when sandeel total stock biomass was increased from below 300,000 tonnes. Further increasing sandeel abundance would improve kittiwake survival much less when the stock biomass was above 300,000 tonnes.
- From the equation in Figure 1.6 Open ▸ (y = 0.0909ln–x) - 0.2944), the predicted change in adult return rate was calculated for each scenario ( Table 1.2 Open ▸ ).
Table 1.2 Predicted change in adult return rate of kittiwakes on the Isle of May with potential changes in sandeel stock.
- From the difference in adult survival predicted due to sandeel stock biomass it is possible to predict the number of additional adult birds that could survive as a result. For each SPA in SA4 between the East Caithness Cliffs SPA in the north of SA4 and the Farne Islands SPA in the south of SA4 the additional adult birds predicted to survive per annum is shown in Table 1.3 Open ▸ .
Table 1.3 Open ▸ Additional adult kittiwakes predicted to survive per annum for SPAs in SA4.
- Adult kittiwake productivity also correlated with sandeel stock biomass ( Figure 1.7 Open ▸ ). This non-linear relationship indicated that productivity could increase rapidly when sandeel total stock biomass was increased from below 300,000 tonnes. Further increasing sandeel abundance would improve kittiwake productivity less when the stock biomass was above 300,000 tonnes.
- From the equation in Figure 1.7 Open ▸ , the predicted change in productivity was calculated for each scenario ( Table 1.4 Open ▸ ).
Table 1.4 Predicted change in productivity of kittiwakes (chicks per pair) on the Isle of May with potential changes in sandeel stock.
- From the difference in productivity predicted due to sandeel stock biomass it is possible to predict the number of additional adult birds that could be produced as a result. For each SPA in SA4 between the East Caithness Cliffs SPA in the north of SA4 and the Farne Islands SPA in the south of SA4 the additional adult birds predicted to be produced per annum is shown in Table 1.5 Open ▸ . This was calculated from the predicted increase in fledged birds per annum combined with the predicted survival rate from fledging to age at first breeding (calculated from the age specific survival rates to age at first breeding = 0.4938).
Table 1.5 Additional adult kittiwakes predicted to be produced per annum for SPAs in SA4 as a consequence of improved breeding success.