

Appendix C Consequences Assessment
This appendix presents an assessment of the consequences of collision and allision incidents, in terms of people and the environment, due to the presence of the Proposed Development wind farm structures.
The significance of risk of the hazards due to the presence of the Proposed Development array area are also assessed based upon risk evaluation criteria and comparison with historical accident data in UK waters[15].
C.1 Risk Evaluation Criteria
C.1.1 Risk to People
With regard to the assessment of risk to people two measures are considered, namely:
- Individual risk; and
- Societal risk.
Individual risk considers whether the risk from an incident to a particular individual changes significantly due to the presence of the Proposed Development. Individual risk considers not only the frequency of the accident and the consequences (e.g., likelihood of death), but also the individual’s fractional exposure to that risk, i.e., the probability of the individual being in the given location at the time of the incident.
The purpose of estimating the individual risk is to ensure that individuals who may be affected by the presence of the Proposed Development are not exposed to excessive risks. This is achieved by considering the significance of the change in individual risk resulting from the presence of the Proposed Development relative to the background individual risk levels.
Annual risk levels to crew (the annual risk to an average crew member) for different vessel types are presented in Figure C.1, which also includes the upper and lower bounds for risk acceptance criteria as suggested in IMO Maritime Safety Committee 72/16 (IMO, 2001). The annual individual risk to crew falls within the ALARP region for each of the vessel types presented.
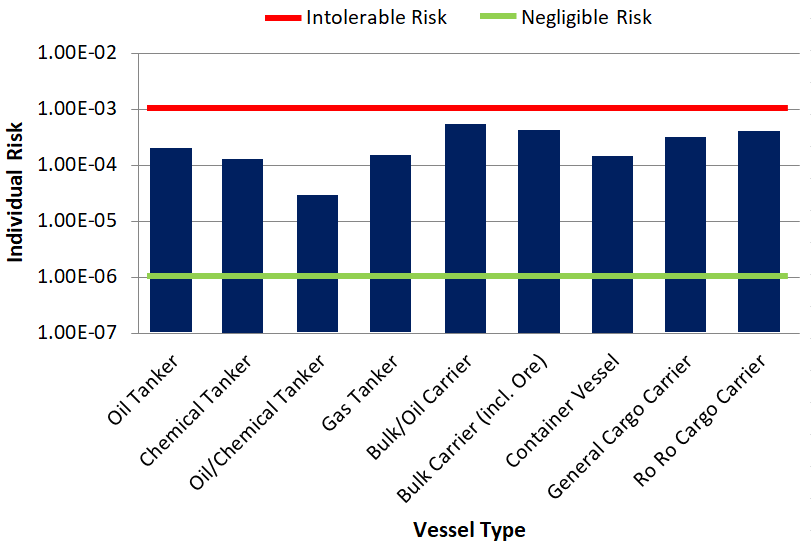
Figure C.1 Individual Risk Levels and Acceptance Criteria per Vessel Type
Typical bounds defining the ALARP regions for decision making within shipping are presented in Table C.1. It can be seen that for a new vessel the target upper bound for ALARP is set lower since new vessels are expected to be safer.
Table C.1 Individual Risk ALARP Criteria
Individual | Lower Bound for ALARP | Upper Bound for ALARP |
|---|---|---|
To crew member | 10-6 | 10-3 |
To passenger | 10-6 | 10-4 |
Third party | 10-6 | 10-4 |
New vessel target | 10-6 | Above values reduced by one order of magnitude |
On a UK basis, the MCA website presents individual risks for various UK industries based upon HSE data from 1987 to 1991. The risks for different industries are presented in Figure C.2.

Figure C.2 Individual Risk per Year for Various UK Industries
The individual risk for sea transport of 2.9×10⁻⁴ per year is consistent with the worldwide data presented in Figure C.1, whilst the individual risk for sea fishing of 1.2×10⁻³ per year is the highest across all of the industries included.
C.1.1.2 Societal Risk
Societal risk is used to estimate risks of accidents affecting many persons (catastrophes) and acknowledging risk adverse or neutral attitudes. Societal risk includes the risk to every person, even if a person is only exposed to risk on one brief occasion. For assessing the risk to a large number of affected people societal risk is desirable because individual risk is insufficient in evaluating risks imposed on large numbers of people.
Within this assessment, societal (navigation-based) risk can be assessed within the Proposed Development array area, giving account to the change in risk associated with each accident scenario caused by the introduction of the wind farm structures. Societal risk may be expressed as:
- Annual fatality rate where frequency and fatality are combined into a convenient one-dimensional measure of societal risk (also known as Potential Loss of Life (PLL)); and
- F-N diagrams showing explicitly the relationship between the cumulative frequency of an accident and the number of fatalities in a multi-dimensional diagram.
When assessing societal risk this study focuses on PLL, which takes into account the number of people likely to be involved in an incident (which is higher for certain vessel types) and assesses the significance of the change in risk compared to the background risk levels.
C.1.2 Risk to Environment
For risk to the environment the key criteria considered in terms of the risk due to the Proposed Development is the potential quantity of oil spilled from a vessel involved in an incident.
It is recognised that there will be other potential pollution, e.g., hazardous containerised cargoes; however, oil is considered the most likely pollutant and the extent of predicted oil spills will provide an indication of the significance of pollution risk due to the Proposed Development compared to background pollution risk levels for the UK.
C.2 Marine Accident Investigation Branch Incident Analysis
C.2.1 All UK Waters Incidents
All British flagged commercial vessels are required to report accidents to the MAIB. Non-UK flagged vessels do not have to report unless they are at a UK port or within 12 nm territorial waters and carrying passengers to a UK port. There are no requirements for non-commercial recreational craft to report accidents to the MAIB; however, a significant proportion of these incidents are reported to and investigated by the MAIB.
Only incidents occurring in UK waters have been considered within this assessment for which the MAIB data is most comprehensive. It is also noted that incidents occurring in ports/harbours and rivers/canals have been excluded since the causes and consequences may differ considerably from an accident occurring offshore, which is the location of most relevance to the Proposed Development.
Taking into account these criteria, a total of 12,093 accidents, injuries and hazardous incidents were reported to the MAIB between 2000 and 2019 involving 13,965 vessels (some incidents, such as collisions, involved more than one vessel).
The locations of all incidents reported in proximity to the UK are presented in Figure C.3, colour-coded by incident type. It is noted that the MAIB aim for 97% accuracy in reporting the location of incidents.
The distribution of unique incidents by year in UK waters is presented in Figure C.4.
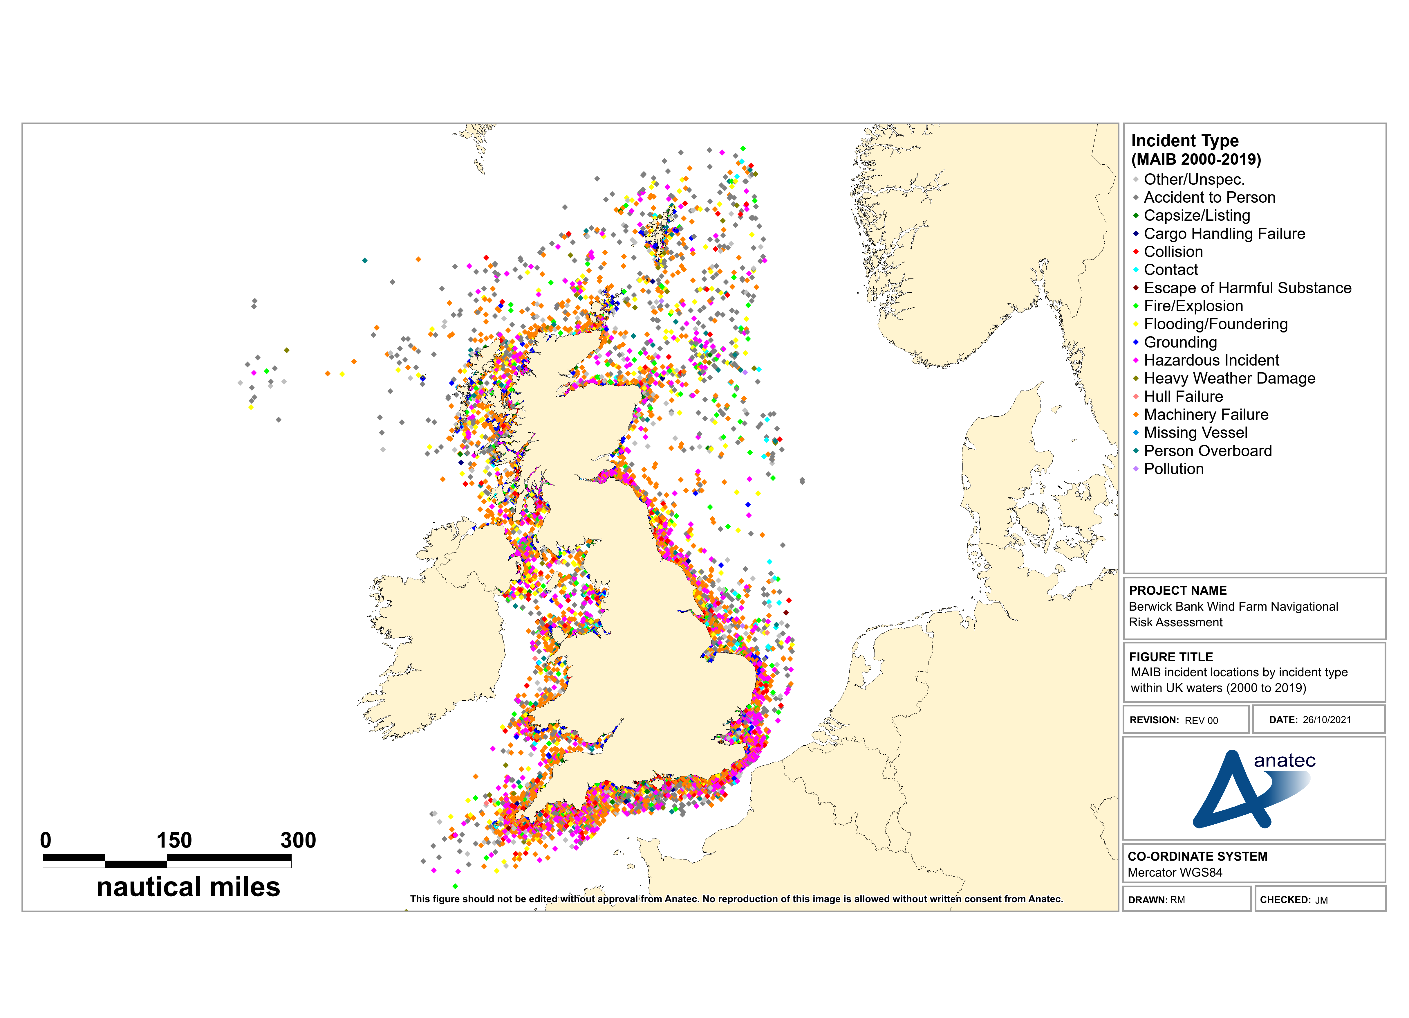
Figure C.3 MAIB Incident Locations by Incident Type within UK Waters (2000 to 2019)
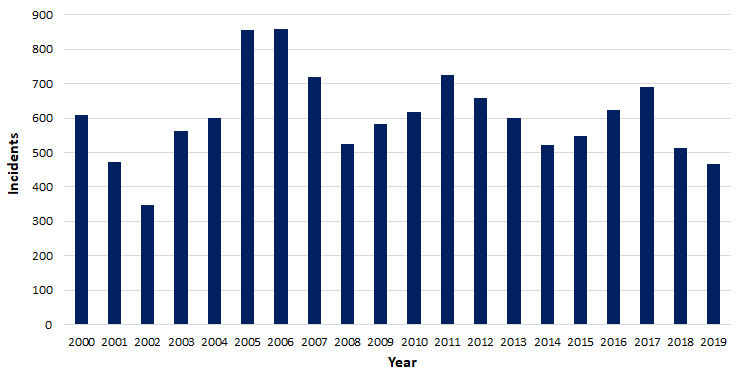
Figure C.4 MAIB Unique Incidents per Year within UK Waters (2000 to 2019)
The average number of unique incidents per year was 605. There has generally been a fluctuating trend in incidents over the 20-year period.
The distribution of incidents in UK waters by incident type is presented in Figure C.5.
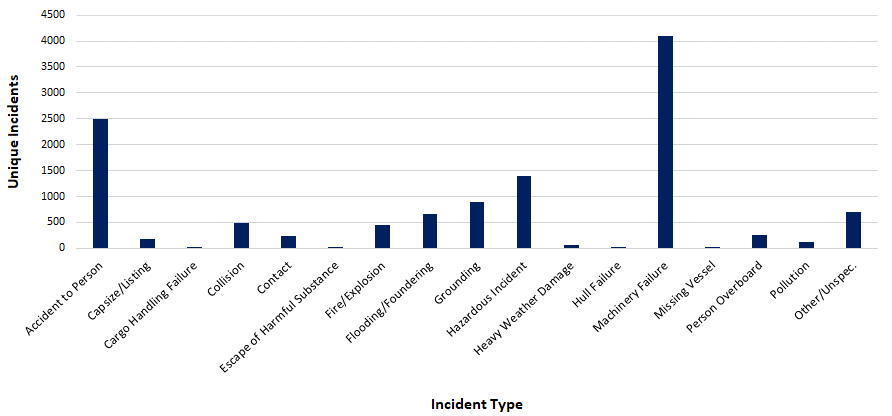
Figure C.5 MAIB Incident Types Breakdown within UK Waters (2000 to 2019)
The most frequent incident types were “machinery failure” (34%), “accident to person” (21%) and “hazardous incident” (12%). “Collision” and “contact” incidents represented 4% and 2% of total incidents, respectively.
The distribution of incidents in UK waters by vessel type is presented in Figure C.6.
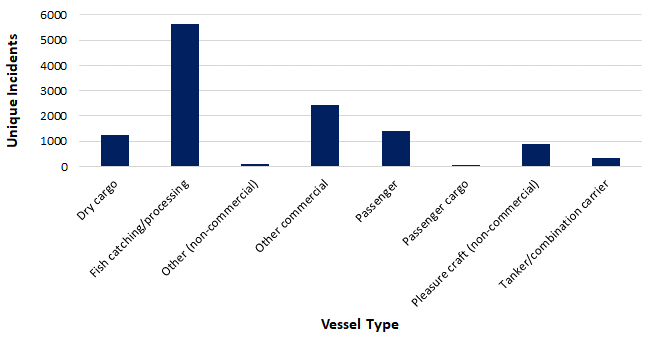
Figure C.6 MAIB Incident Vessel Type Breakdown within UK Waters (2000 to 2019)
The vessel types most frequently involved in incidents were fishing vessels (46%), other commercial vessels (20%) (including offshore industry vessels, tugs, workboats and pilot vessels) and dry cargo vessels (10%).
The total of 373 fatalities were reported in the MAIB incidents within UK waters from 2000 to 2019, averaging 19 fatalities per year.
The distribution of fatalities in UK waters by vessel type and person category (namely crew, passenger and other) is presented in Figure C.7.
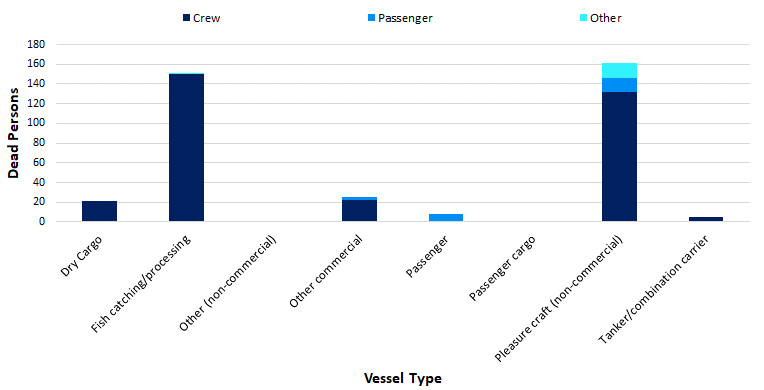
Figure C.7 MAIB Fatalities by Vessel Type within UK Waters (2000 to 2019)
The majority of fatalities occurred to pleasure craft (43%) and fishing vessels (40%), with crew members the main people involved (89%).
C.2.2 Collision Incidents
The MAIB define a collision incident as “ships striking or being struck by another ship, regardless of whether the ships are underway, anchored or moored” (MAIB, 2013).
A total of 481 collision incidents were reported to the MAIB in UK waters between 2000 and 2019 involving 1,090 vessels (in a small number of cases the other vessel involved was not logged).
The locations of collision incidents reported in proximity to the UK are presented in Figure C.8, followed by the distribution of collision incidents per year presented in Figure C.9.
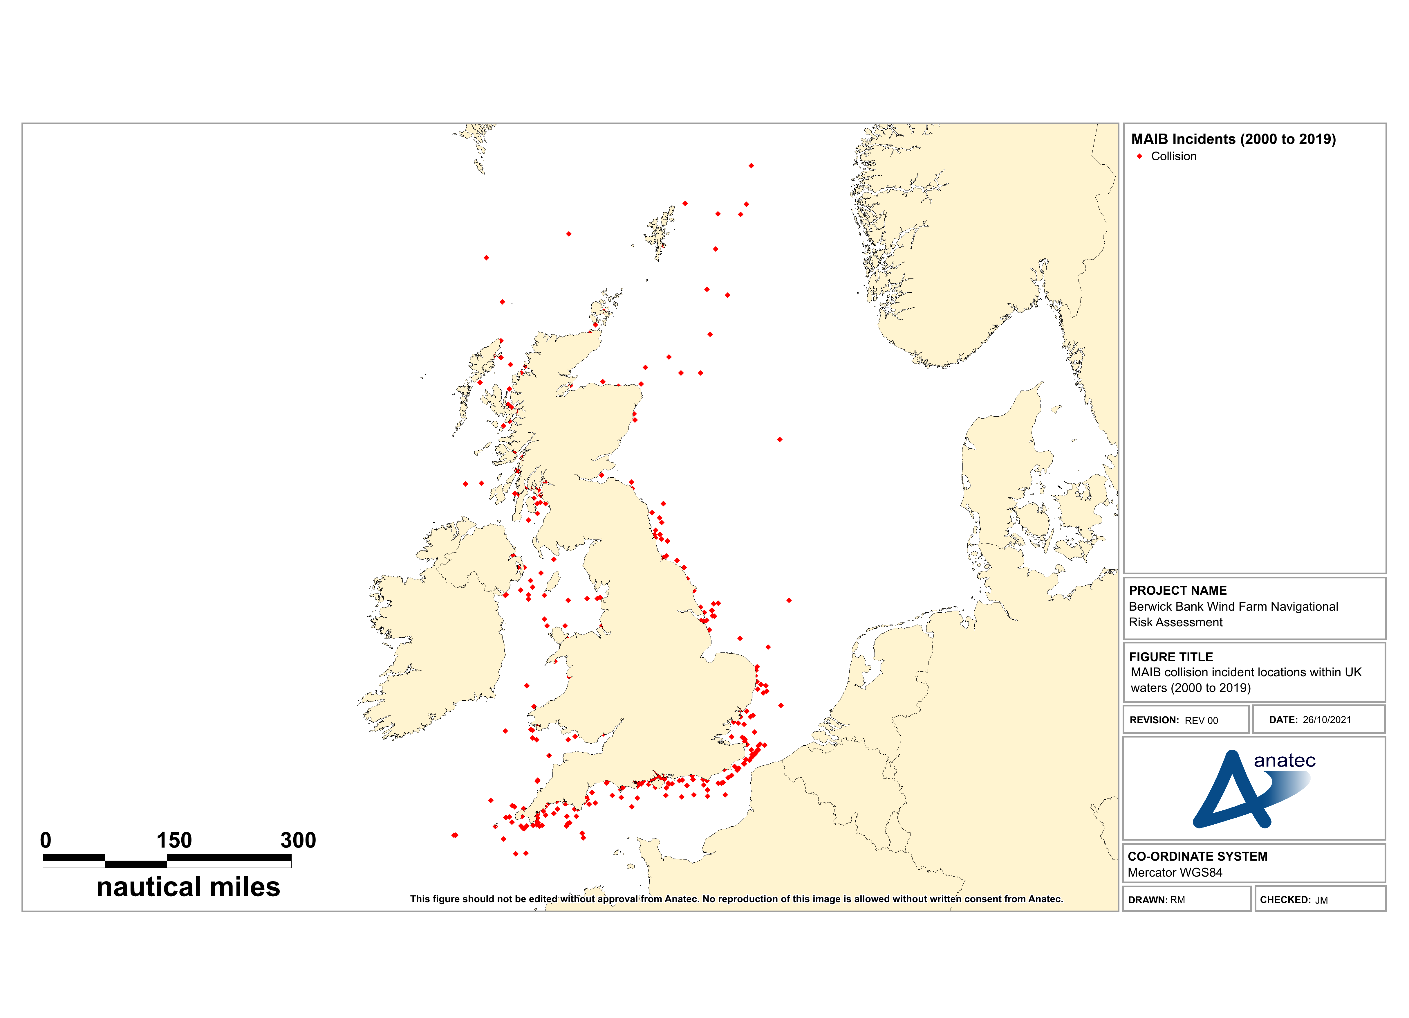
Figure C.8 MAIB Collision Incident Locations within UK Waters (2000 to 2019)
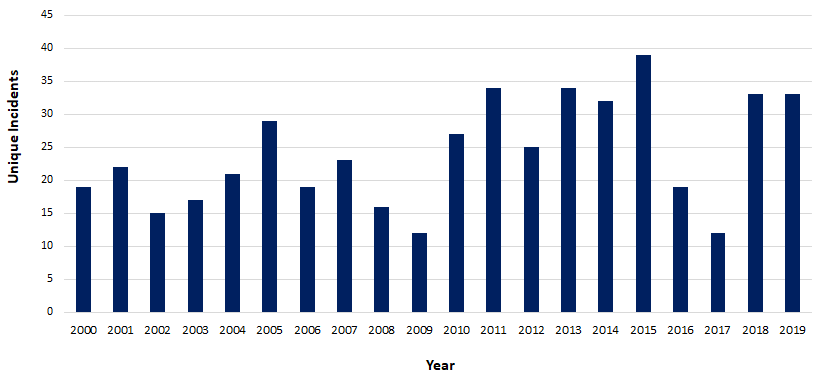
Figure C.9 MAIB Annual Collision Incidents within UK Waters (2000 to 2019)
The average number of unique collision incidents per year was 14. There has been an overall slight increasing trend in collision incidents over the 20-year period, which may be due to better reporting of less serious incidents in recent years.
The most common vessel types involved in collision incidents were other commercial vessels (29%), fishing vessels (24%), non-commercial pleasure craft (23%), and dry cargo vessels (12%).
The total of six fatalities were reported in MAIB collision incidents within UK waters between 2000 and 2019. Details of each of these fatal incidents reported by the MAIB are presented in Table C.2.
Table C.2 Description of Fatal MAIB Collision Incidents (2000 to 2019)
Date | Description | Fatalities |
|---|---|---|
October 2001 | Collision between dry cargo vessel and chemical tanker following lateness by watchkeepers in taking effective action. Dry cargo vessel sank with five of the six crew members rescued. | 1 |
July 2005 | Collision between two powerboats at night. Both vessels were unlit and both helmsmen had consumed alcohol. One of the helmsmen died. | 1 |
October 2007 | Collision between fishing vessel and coastal general cargo vessel following failure to keep an effective lookout. Fishing vessel sank with three of the four crew members abandoning ship into a life raft but the fourth crew member was not recovered. | 1 |
August 2010 | Collision between passenger ferry and fishing vessel. Fishing vessel sank with one of the two crew members recovered from the sea but the other member was not recovered despite an extensive search. | 1 |
June 2015 | Collision between Rigid-hulled Inflatable Boat (RIB) and yacht. Believed that around a dozen persons were onboard the motorboat with the majority taken ashore by lifeboat. One person seriously injured and airlifted to hospital before being pronounced dead later. | 1 |
June 2018 | Collision between power boats during a race. One of the vessels overturned with the pilot pronounced dead at the scene. | 1 |
C.2.3 Contact Incidents
The MAIB define a contact incident as “ships striking or being struck by an external object. The objects can be: floating object (cargo, ice, other or unknown); fixed object, but not the sea bottom; or flying object” (MAIB, 2013).
A total of 235 contact incidents were reported to the MAIB within UK waters between 2000 and 2019 involving 270 vessels (in a small number of cases the contact involved a moving vessel and a stationary vessel).
The locations of contact incidents reported in proximity to the UK are presented in Figure C.10. The distribution of contact incidents is presented in Figure C.11.

Figure C.10 MAIB Contact Incident Locations within UK Waters (2000 to 2019)
Figure C.11 MAIB Contact Incidents per Year within UK Waters (2000 to 2019)
The average number of contact incidents per year was 12. As with collision incidents, there has been an overall slight increasing trend over the 20-year period, which may be due to better reporting of less serious incidents in recent years.
The distribution of vessel types involved in contact incidents is presented in Figure C.12.
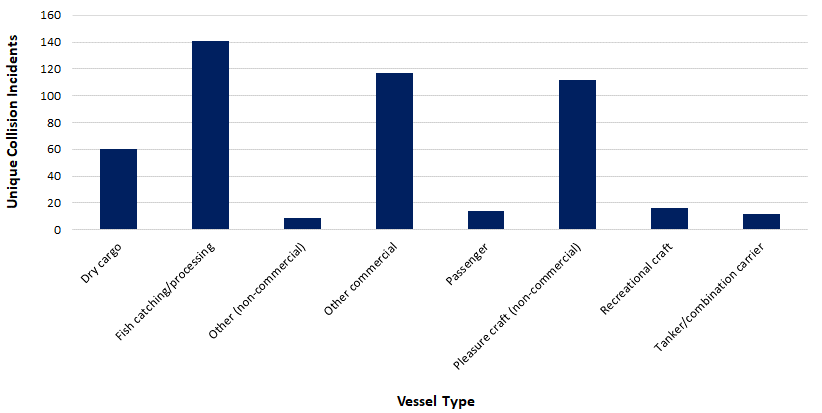
Figure C.12 MAIB Contact Incidents by Vessel Type within UK Waters (2000 to 2019)
The most commonly involved vessel types in contact incidents were other commercial vessels (43%), fishing vessels (15%), and non-commercial pleasure craft (13%).
One fatality was reported in MAIB contact incidents within UK waters between 2000 and 2019. Details of this fatal incident reported by the MAIB are presented in Table C.3.
Table C.3 Description of Fatal MAIB Collision Incidents (2000 to 2019)
Date | Description | Fatalities |
|---|---|---|
June 2012 | Contact between RIB and jetty. RIB badly damaged around the bow and fenders on the jetty also damaged. The RIB owner had consumed alcohol and suffered fatal injuries following the impact. | 1 |
C.3 Fatality Risk
C.3.1 Incident Data
This section uses the MAIB incident data along with information on average manning levels per vessel type to estimate the probability of a fatality in a marine incident associated with the Proposed Development.
The wind farm structures are assessed to have the potential to affect the following incidents:
- Vessel to vessel collision;
- Powered vessel to structure allision;
- Drifting vessel to structure allision; and
- Fishing vessel to structure allision.
Of these incident types, only vessel to vessel collisions match the MAIB definition of collisions and hence the fatality analysis presented in section C.2.2 is considered to be directly applicable to these types of incidents.
The other scenarios of powered vessel to structure allision, drifting vessel to structure allision and fishing vessel to structure allision are technically contacts since they would involve a vessel striking an immobile object in the form of a wind turbine or offshore substation platform. From section C.2.3, it can be seen that only one of the 235 contact incidents reported by the MAIB between 2000 and 2019 resulted in a fatality, with the contact occurring with a jetty in the approaches to a harbour.
As the mechanics involved in a vessel contacting a wind turbine may differ in severity from hitting, for example, a buoy, quayside, or moored vessel, the MAIB collision fatality risk rate has also been conservatively applied for the allision incident types.
C.3.2 Fatality Probability
Six of the 481 collision incidents reported by the MAIB within UK waters between 2000 and 2019 resulted in one or more fatalities. This gives a 1.2% probability that a collision incident will lead to a fatal accident.
To assess the fatality risk for personnel on-board a vessel (crew, passenger or other) the number of persons involved in the incidents needs to be estimated. From analysis of the long-term AIS data, the average commercial passenger vessel had approximately 223 people on board (POB) (total of crew and passengers). For commercial cargo/freight vessels there was an average of 13 POB. For fishing vessels and recreational vessels, the average POB was 3.1 and 2.8, respectively, based on analysis of the MAIB incident data.
Table C.4 Estimated Average POB by Vessel Category
Vessel Category | Sub Categories | Source of Estimated Average POB | Estimated Average POB |
|---|---|---|---|
Cargo/freight | Dry cargo, other commercial, service ship, etc. | MAIB incident data | 15 |
Tanker | Tanker/combination carrier | MAIB incident data | 22 |
Passenger | Roll-on/roll-off (Ro-Ro) passenger, cruise liner, etc. | Vessel traffic survey data/online information | 1,530 |
Fishing | Trawler, potter, dredger, etc. | MAIB incident data | 3.3 |
Recreational | Yacht, small commercial motor yacht, etc. | MAIB incident data | 3.3 |
It is recognised that these numbers can be substantially higher or lower on an individual vessel basis depending upon the size, subtype, etc. but applying reasonable averages is considered sufficient for this analysis.
Using the average number of POB, along with the vessel type information involved in collision incidents reported by the MAIB (see Figure C.8), there were an estimated 10,533 POB the vessels involved in the collision incidents.
Based upon six fatalities, the overall fatality probability in a collision for any individual on board is approximately 5.7×10⁻⁴ (0.057%) per collision.
It is considered inappropriate to apply this rate uniformly as the statistics indicate that the fatality probability associated with smaller craft, such as fishing vessels and recreational vessels, is higher. Therefore, the fatality probability has been subdivided into five categories of vessel as presented in Table C.5.
Table C.5 Collision Incident Fatality Probability by Vessel Category (2000 to 2019)
Vessel Category | Sub Categories | Fatalities | People Involved | Fatality Probability |
|---|---|---|---|---|
Commercial | Dry cargo, passenger, tanker, etc. | 1 | 16,256 | 6.2×10⁻⁵ |
Fishing | Trawler, potter, dredger, etc. | 2 | 880 | 2.3×10⁻³ |
Recreational | Yacht, small commercial motor yacht, etc. | 3 | 713 | 4.2×10⁻³ |
The risk is higher by up to two orders of magnitude for POB small craft compared to larger commercial vessels.
C.3.3 Fatality Risk due to the Proposed Development
The base case and future case annual collision and allision frequency levels pre and post wind farm for the Proposed Development array area are summarised in Table C.6, where change refers to the increase in collision and allision frequency due to the presence of the Proposed Development (overall 1.95×10⁻¹, equating to an additional collision or allision every 5.1 years) for the base case).
Table C.6 Summary of Annual Collision and Allision Risk Results
Risk | Scenario | Annual Frequency (Return Period) | ||
|---|---|---|---|---|
Pre Wind Farm | Post Wind Farm | Change | ||
Vessel to vessel collision | Base case | 8.49×10⁻⁴ | 9.69×10⁻⁴ | 1.20×10⁻⁴ |
Future case (10%) | 1.06×10⁻³ | 1.21x10⁻³ | 1.50×10⁻⁴ | |
Future case (20%) | 8.49×10⁻⁴ | 9.69×10⁻⁴ | 1.20×10⁻⁴ | |
Powered vessel to structure allision | Base case | 1.06×10⁻³ | 1.21x10⁻³ | 1.50×10⁻⁴ |
Future case (10%) | 1.26×10⁻³ | 1.44×10⁻³ | 1.75×10⁻⁴ | |
Future case (20%) | N/A | 1.52×10⁻⁴ | 1.52×10⁻⁴ | |
Drifting vessel to structure allision | Base case | N/A | 1.69×10⁻⁴ | 1.69×10⁻⁴ |
Future case (10%) | N/A | 1.85×10⁻⁴ | 1.85×10⁻⁴ | |
Future case (20%) | N/A | 7.69×10⁻⁵ | 7.69×10⁻⁵ | |
Fishing vessel to structure allision | Base case | N/A | 8.58×10⁻⁵ | 8.58×10⁻⁵ |
Future case (10%) | N/A | 9.36×10⁻⁵ | 9.36×10⁻⁵ | |
Future case (20%) | N/A | 2.29×10⁻¹ | 2.29×10⁻¹ | |
Total | Base case | N/A | 2.52×10⁻¹ | 2.52×10⁻¹ |
Future case (10%) | N/A | 2.75×10⁻¹ | 2.75×10⁻¹ | |
Future case (20%) | 8.49×10⁻⁴ | 2.30×10⁻¹ | 2.29×10⁻¹ | |
From the detailed results of the collision and allision risk modelling, the distribution of the predicted change in annual collision and allision frequency by vessel type due to the Proposed Development for the base case and future cases are presented in Figure C.13.

Figure C.13 Change in Annual Collision and Allision Frequency by Vessel Type
It can be seen that the change in collision and allision frequency is dominated by fishing vessels, owing to the greater duration spent in proximity to Proposed Development array area by fishing vessels engaged in fishing activities and the possibility of fishing occurring internally within the array itself. The second greatest change in collision and allision frequency was associated with cargo vessels, with the other categories significantly lower.
Combining the annual collision and allision frequency, estimated number of POB for each vessel type, and estimated fatality probability for each vessel category, the annual increase in PLL due to the presence of the Proposed Development for the base case is estimated to be 1.31×10⁻³, equating to one additional fatality every 764 years.
The estimated incremental increases in PLL due to the Proposed Development, distributed by vessel type for the base and future cases, are presented in Figure C.14.

Figure C.14 Estimated Change in Annual PLL by Vessel Type
As with the change in annual collision and allision frequency, it can be seen that the change in annual PLL is dominated by fishing vessels, which historically have a higher fatality probability than commercial vessels.
Converting the PLL to individual risk based upon the average number of people exposed by vessel type, the results are presented in Figure C.15.

Figure C.15 Estimated Change in Individual Risk by Vessel Type
It can be seen that the individual risk is highest for people on fishing vessels, which reflects the higher probability of a fatality occurring in the event of an incident involving a fishing vessel.
C.3.4 Significance of Increase in Fatality Risk
In comparison to MAIB statistics, which indicate an average of 20 fatalities per year in UK territorial waters, the overall increase for the base case in PLL of one additional fatality per 764 years represents a small change.
In terms of individual risk to people, the change for commercial vessels attributed to the Proposed Development (approximately 2.89×10⁻⁹ for the base case) is very low compared to the background risk level for the UK sea transport industry of 2.9×10⁻⁴ per year.
For fishing vessels, the change in individual risk attributed to the Proposed Development (approximately 3.98×10⁻⁵ for the base case) is low compared to the background risk level for the UK sea fishing industry of 1.2×10⁻³ per year.