

C.4 Pollution Risk
C.4.1 Historical Analysis
The pollution consequences of a collision in terms of oil spill depend upon the following criteria:
- Spill probability (i.e., the likelihood of outflow following an incident); and
- Spill size (quantity of oil).
Two types of oil spill are considered within this assessment:
- Fuel oil spills from bunkers (all vessel types); and
- Cargo oil spills (laden tankers).
Research undertaken as part of the UK’s DfT MEHRAs project (DfT, 2001) has been used as it was comprehensive and based upon worldwide marine oil spill data analysis. From this research, the overall probability of a spill incident per accident was calculated based upon historical accident data for each accident type as presented in Figure C.16.
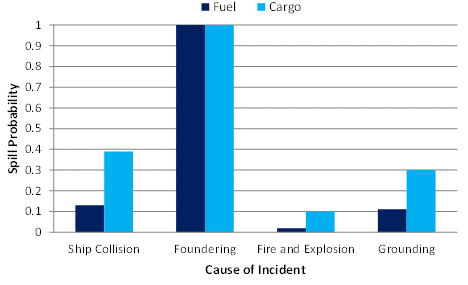
Figure C.16 Probability of an Oil Spill resulting from an Incident
Therefore, it was estimated that 13% of vessel collisions result in a fuel oil spill and 39% of collisions involving a laden tanker result in a cargo oil spill.
In the event of a bunker spill, the potential outflow of oil depends upon the bunker capacity of the vessel. Historical bunker spills from vessels have generally been limited to a size below 50% of bunker capacity, and in most incidents much lower.
For the types and sizes of vessels exposed to the Proposed Development, an average spill size of 100 tonnes of fuel oil is considered to be a conservative assumption.
For oil spills from laden tankers, the spill size can vary significantly. The International Tanker Owners Pollution Federation (ITOPF) reported the following spill size distribution for tanker collisions between 1974 and 2004:
- 31% of spills below seven tonnes;
- 52% of spills between seven and 700 tonnes; and
- 17% of spills greater than 700 tonnes.
Based upon this data and the tankers transiting in proximity to the Proposed Development array area, an average spill size of 400 tonnes is considered conservative.
For fishing vessel collisions comprehensive statistical data is not available. Consequently, it is conservatively assumed that 50% of all collisions involving fishing vessels will lead to oil spill with the quantity spilled being on average five tonnes. Similarly, for recreational vessels, owing to a lack of data 50% of collisions are assumed to lead to a spill with an average size of one tonne.
C.4.2 Pollution Risk due to the Proposed Development
Applying the above probabilities to the annual collision and allision frequency by vessel type and the average spill size per vessel, the estimated amount of oil spilled per year due to the presence of the Proposed Development would equate to 0.51 tonnes of oil per year for the base case. For the future case scenarios, this estimate increases to 0.56 tonnes and 0.61 tonnes for traffic increases of 10% and 20%, respectively.
The estimated increase in tonnes of oil spilled, distributed by vessel type, for the base and future cases are presented in Figure C.17.

Figure C.17 Estimated Change in Pollution by Vessel Type
The annual oil spill results are dominated by fishing vessels due to the high annual collision frequency associated with fishing vessels. Tankers also contribute significantly to the annual oil spill estimate, which reflects the greater spillage size anticipated in incidents involving tankers.
C.4.3 Significance of Increase in Pollution Risk
To assess the significance of the increased pollution risk from vessels caused by the Proposed Development, historical oil spill data for the UK has been used as a benchmark.
From the MEHRAs research, the annual average tonnes of oil spilled in UK waters due to maritime incidents in the 10-year period from 1989 to 1998 was 16,111 tonnes. This is based upon a total of 146 reported oil pollution incidents of greater than one tonne (smaller spills are excluded as are incidents which occurred within port or harbour areas or as a result of operational errors or equipment failure). Commercial vessel spills accounted for approximately 99% of the total while fishing vessel incidents accounted for less than 1%.
The overall increase in pollution estimated due to the Proposed Development of 0.51 tonnes for the base case represents a 0.003% increase compared to the historical average pollution quantities from marine incidents in UK waters.
C.5 Conclusion
This appendix has quantitatively assessed the fatality and pollution risk associated with the Proposed Development in the case of a collision or allision incident occurring. It is concluded, based upon the results, that the collision and allision risk of the Proposed Development on people and the environments is very low compared to the existing background risk levels.
Appendix D Regular Operator Consultation
Appendix D Regular Operator Consultation
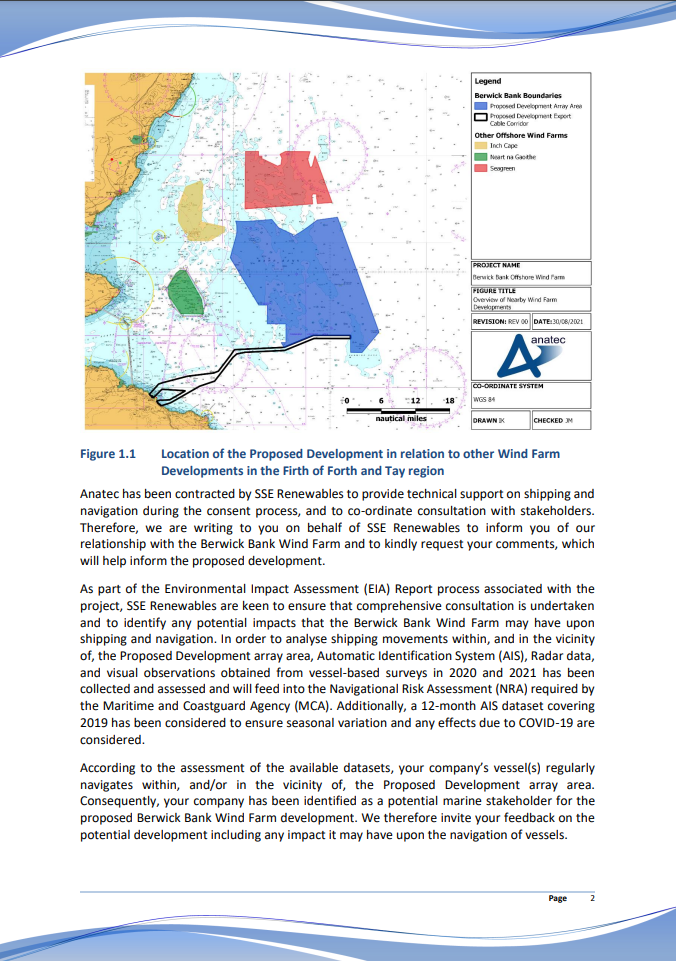
As part of the consultation process for the Project, Regular Operators identified (from the vessel traffic surveys and long-term vessel traffic data) that would be required to deviate their routes due to the presence of the Proposed Development array area were consulted via email. An example of the correspondence sent to the Regular Operators (which shows the extent of the Proposed Development array area and export cable corridor at that time) is presented below.
Appendix E Long-Term Vessel Traffic Movements
E.1 Introduction
This annex assesses additional long-term vessel traffic data for the Proposed Development. As required under MGN 654 (MCA, 2021), the NRA and volume 2, chapter 13 consider 28 days of AIS, radar and visual observation data as the primary vessel traffic data source. However, it should be considered that studying a 28-day period in isolation may exclude certain activities or periods of pertinence to shipping and navigation. Therefore, in line with good practice assessment procedures, this NRA has also considered a longer-term dataset covering all of 2019 to ensure a comprehensive characterisation of vessel traffic movements can be established, including the capture of any season variation.
This approach (i.e., the use of both short- and long-term data) has been agreed with the MCA, NLB and Forth Ports.
E.1.1 Aims and Objectives
The key aims and objectives of this appendix are as follows:
- Identify seasonal variations in vessel traffic via assessment of the long-term vessel traffic data;
- Determine which variations are not reflected within the short-term vessel traffic survey data (and therefore should be fed into the NRA baseline);
- Assess which dataset (long-term, survey, or a combination of both) should be utilised for each key NRA element that requires vessel traffic data input; and
- Identify and account for any potential effects of the COVID-19 pandemic situation on the winter 2021 vessel traffic survey data (acknowledging the data limitation outlined in section 5.2.
- COVID-19 Pandemic Situation
It is noted that while the primary purpose of the long-term dataset is to ensure a comprehensive baseline can be established by ensuring seasonal variations are captured, in the case of the Proposed Development, the consideration of long-term vessel traffic data also ensures that any tangible effects of the COVID-19 pandemic situation on the short-term vessel traffic survey data can be identified, noting that the winter and summer surveys were undertaken in January 2021 and August 2022, respectively, and as such some associated impact upon shipping levels or patterns may be present within the 2021 data (but is not considered relevant for the 2022 data).
As per section 5.2 the MCA, NLB and Forth Ports were content with the vessel traffic surveys on the assumption that additional long-term vessel traffic data prior to the COVID-19 pandemic was considered in tandem with appropriate consultation with the relevant stakeholders. The summer 2022 vessel traffic data has been collected since this consultation and ensures that the effects of COVID-19 pandemic on the baseline characterisation are further negated.
E.2 Methodology
E.2.1 Study Area
This appendix has assessed the long-term vessel traffic data within the Proposed Development array area shipping and navigation study area introduced in section 5 (i.e. a 10 nm buffer around the Proposed Development array area).
E.2.2 Data Period and Temporary Vessel Traffic
Notable levels of wind farm and survey traffic were recorded associated with the Proposed Development and Seagreen to the north, as well as at the nearby NnG and Inch Cape offshore wind farms nearer shore. As these offshore wind farms are not yet operational, this traffic has been excluded as temporary on the basis that 2019 movements may not accurately reflect that of future traffic. Vessels transiting to other offshore wind farms outside the Proposed Development array area shipping and navigation study area were retained. Temporary traffic that has been filtered out of the rest of the analysis is presented below in Figure E.1.
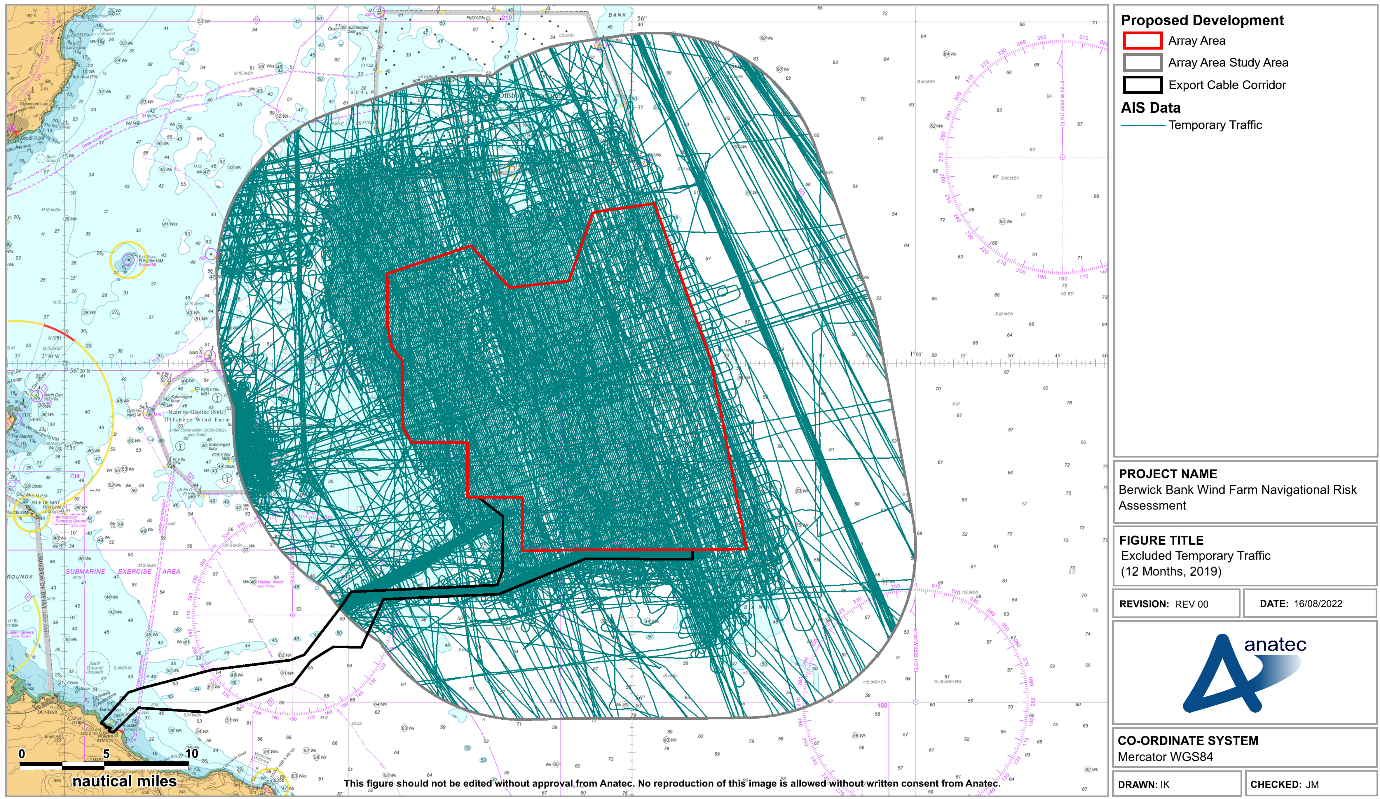
Figure E.1 Long-Term AIS Data – Excluded Temporary Traffic (12 Months, 2019)
Data coverage was observed to be good, however it should be considered that approximately 7% of downtime was observed throughout the entirety of 2019.
E.2.3 AIS Carriage
General limitations associated with the use of AIS data (for example, carriage requirements) are discussed within section 13.8.2.
E.3 Long-Term Vessel Traffic Movements
A plot of the vessel tracks recorded within the Proposed Development array area shipping and navigation study area during the data period, colour-coded by vessel type and excluding temporary traffic, is presented in Figure E.2. The vessel density within the Proposed Development array area shipping and navigation study area is then presented in Figure E.3.
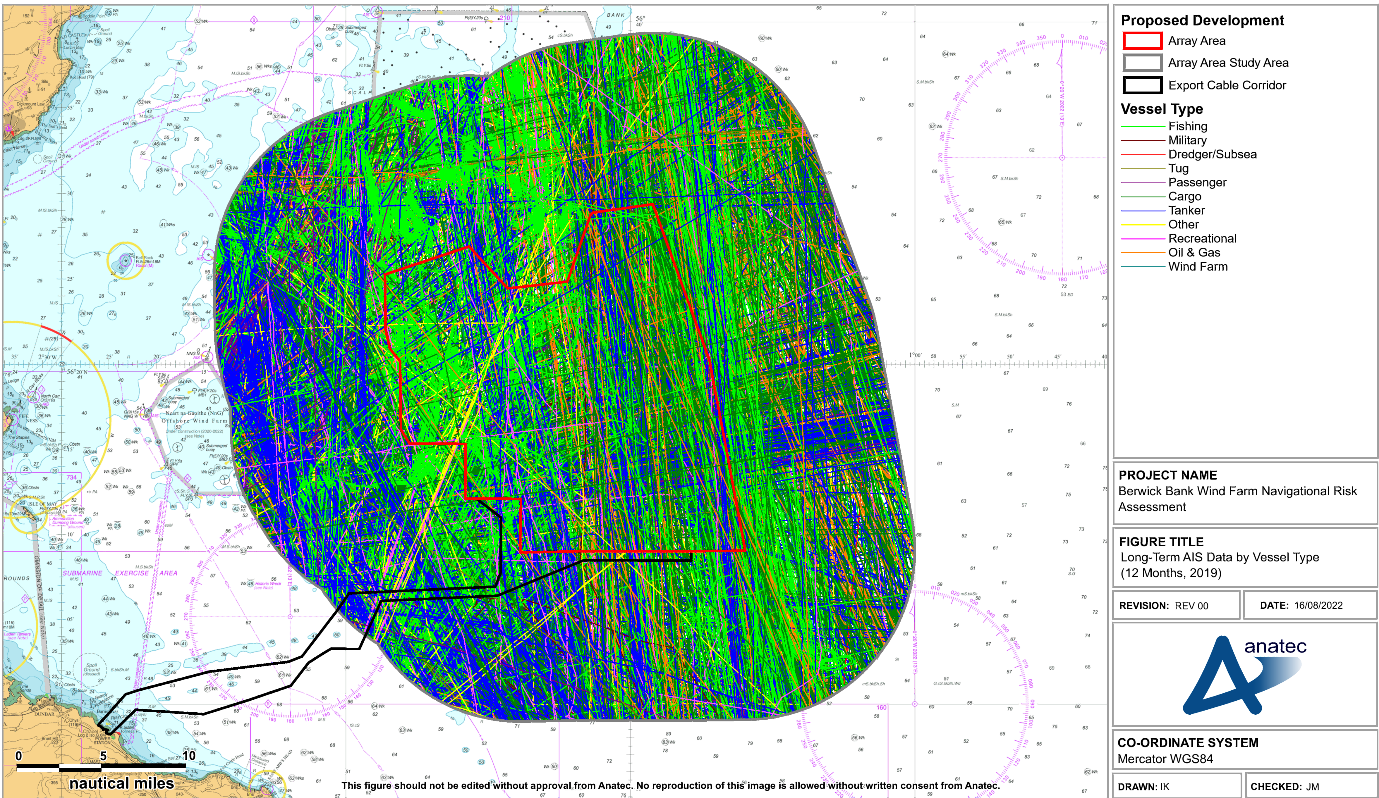
Figure E.2 Long-Term AIS Data by Vessel Type (12 Months, 2019)
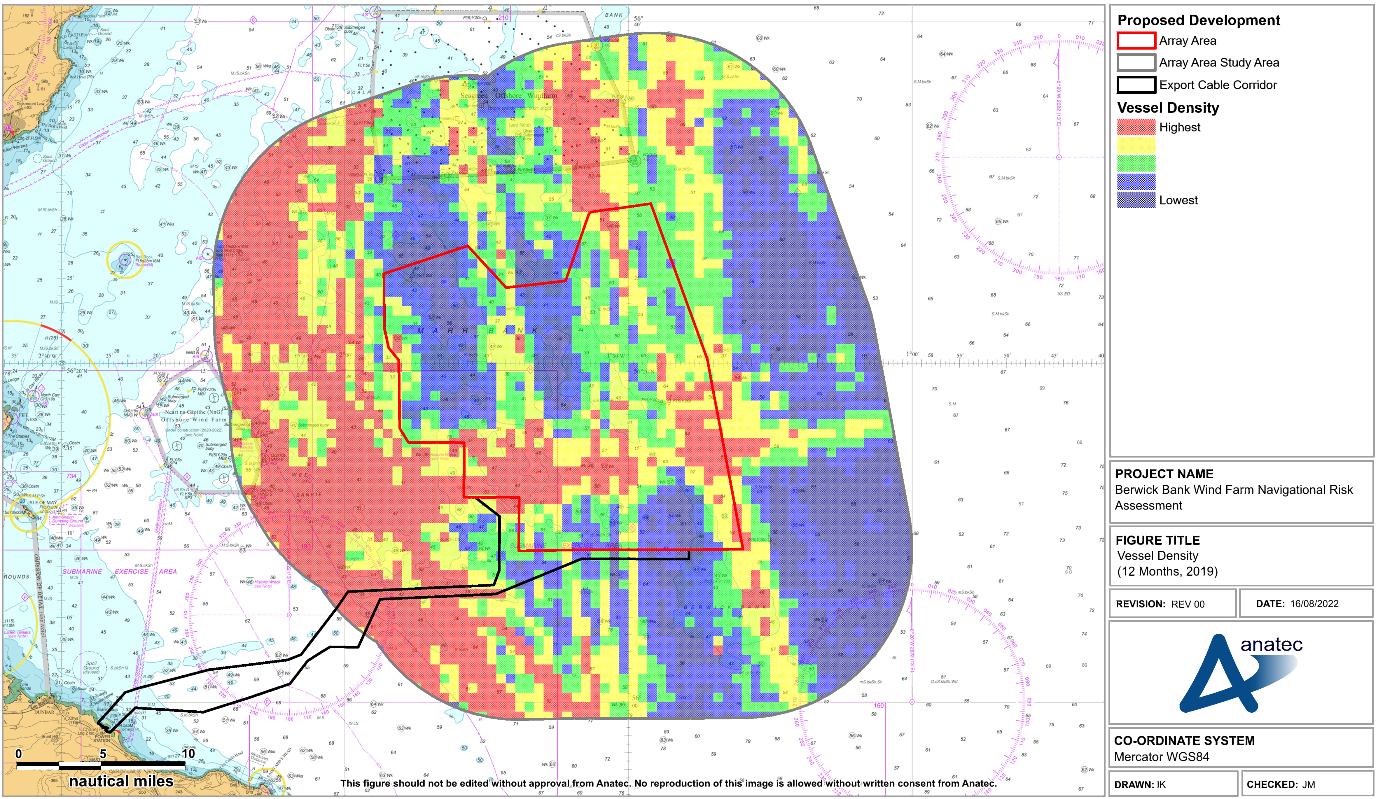
Figure E.3 Vessel Density Heat Map (12 Months, 2019)
E.3.1 Vessel Count
The average daily number of vessels within the Proposed Development array area and the shipping and navigation study area are presented in Figure E.4. The downtime in each given month was accounted for when calculating the average daily vessels.

The busiest month recorded within the Proposed Development array area shipping and navigation study area was June with 20 unique vessels recorded per day, while the quietest month was January with approximately 13 vessels per day (factored for downtime).
E.3.2 Vessel Type
The distribution of the main vessel types recorded during the data period are presented in Figure E.5.

Figure E.5 Main Vessel Type Distribution (12 Months, 2019)
The most common vessel type recorded was tankers, accounting for approximately 33% of all traffic recorded. Other common vessel types included cargo vessels (26%) and commercial fishing vessels (22%).
E.3.3 Commercial Vessels
Figure E.6 presents the commercial vessels recorded within the Proposed Development array area study area during the study period, colour-coded by vessel type.
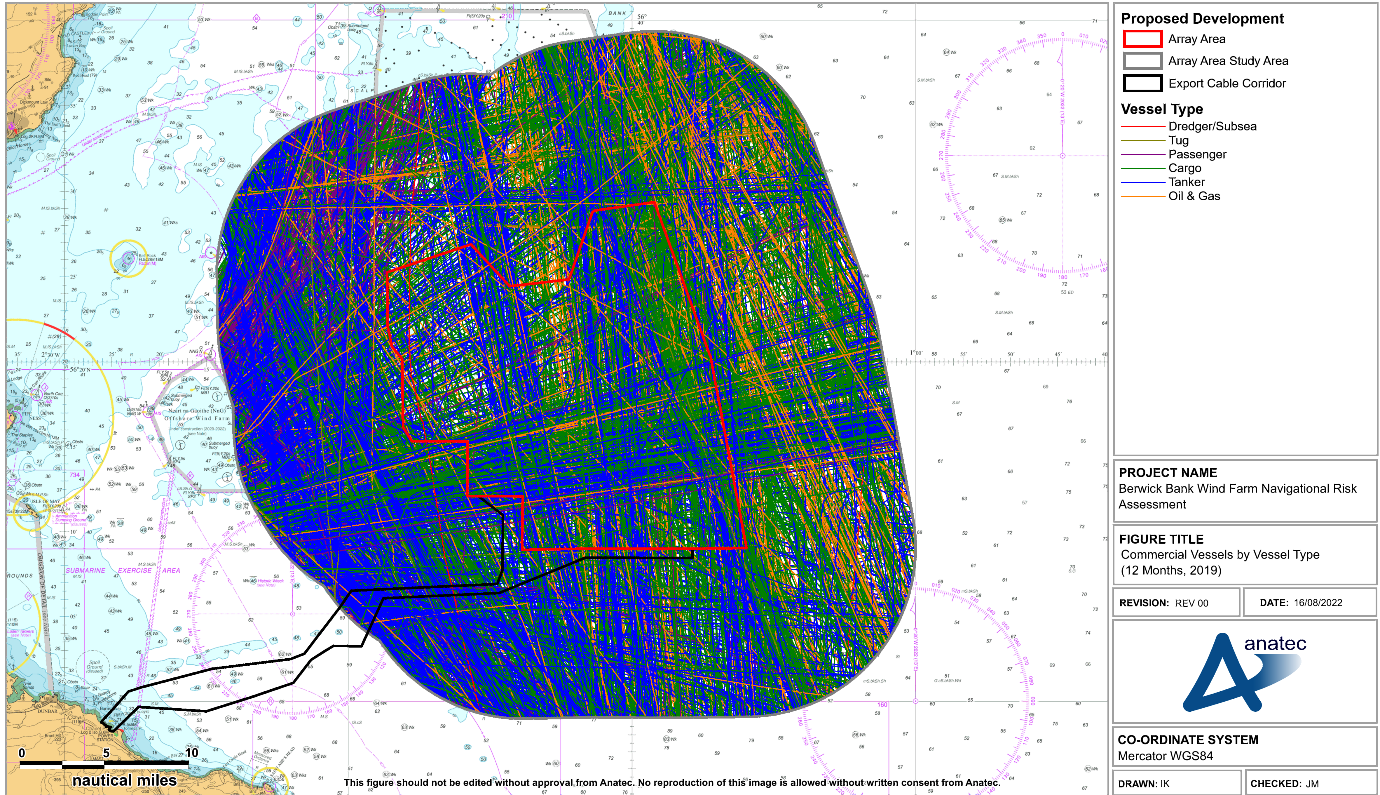
Figure E.6 Commercial Vessels by Type (12 Months, 2019)
A high density of commercial traffic was noted, as it accounts for over half of the total vessel activity within the Proposed Development array area shipping and navigation study area. The majority of the commercial traffic is on well-defined routes. Routeing was predominantly in a north-south direction or out of the Firth of Forth.
Figure E.7 presents the average number of unique commercial vessels for each vessel type detected per month within the Proposed Development array area shipping and navigation study area during the study period factored to account for downtime.

Passenger vessels highlighted the seasonal variation within the Proposed Development array area shipping and navigation study area, as higher counts were recorded between May and September.
Cargo vessels showed minimal seasonal variation. The busiest month for cargo vessels was March with 181 recorded, while the quietest was January with approximately 92 cargo vessels recorded (factored for downtime).
Tankers similarly showed minimal seasonal variation. The busiest months for tankers were, factoring for downtime, March and May, with 166 vessels recorded during March (in which there was no downtime recorded) and a projected vessel count of 178 vessels was estimated for May based on downtime.
Table E.1 presents a summary of the average number of vessels within the Proposed Development array area shipping and navigation study area during the busiest month, quietest month, and the average throughout the full data period.
Table E.1 Quietest, Busiest and Average Daily Unique Vessel Counts for Commercial Vessels (2019)
Vessel Type | Quietest Month | Busiest Month | Average |
|---|---|---|---|
Tankers | 4-5 | 5-6 | 5 |
Cargo vessels | 3 | 5-6 | 4 |
Oil and gas vessels | 0-1 | 1-2 | 1 |
Passenger vessels | 0 | 1-2 | 0-1 |
Marine aggregate dredgers | 0 | 0 | 0-1 |
Tugs | 0 | 0 | 0 |
In summary, the most common type of commercial vessel recorded within the Proposed Development array area study area was tankers. Cargo vessels and tankers showed little seasonal variation while passenger vessel activity was greater in the summer months.
E.3.4 Passenger Vessels
Figure E.8 presents in isolation the passenger vessels recorded within the Proposed Development array area shipping and navigation study area during the study period.
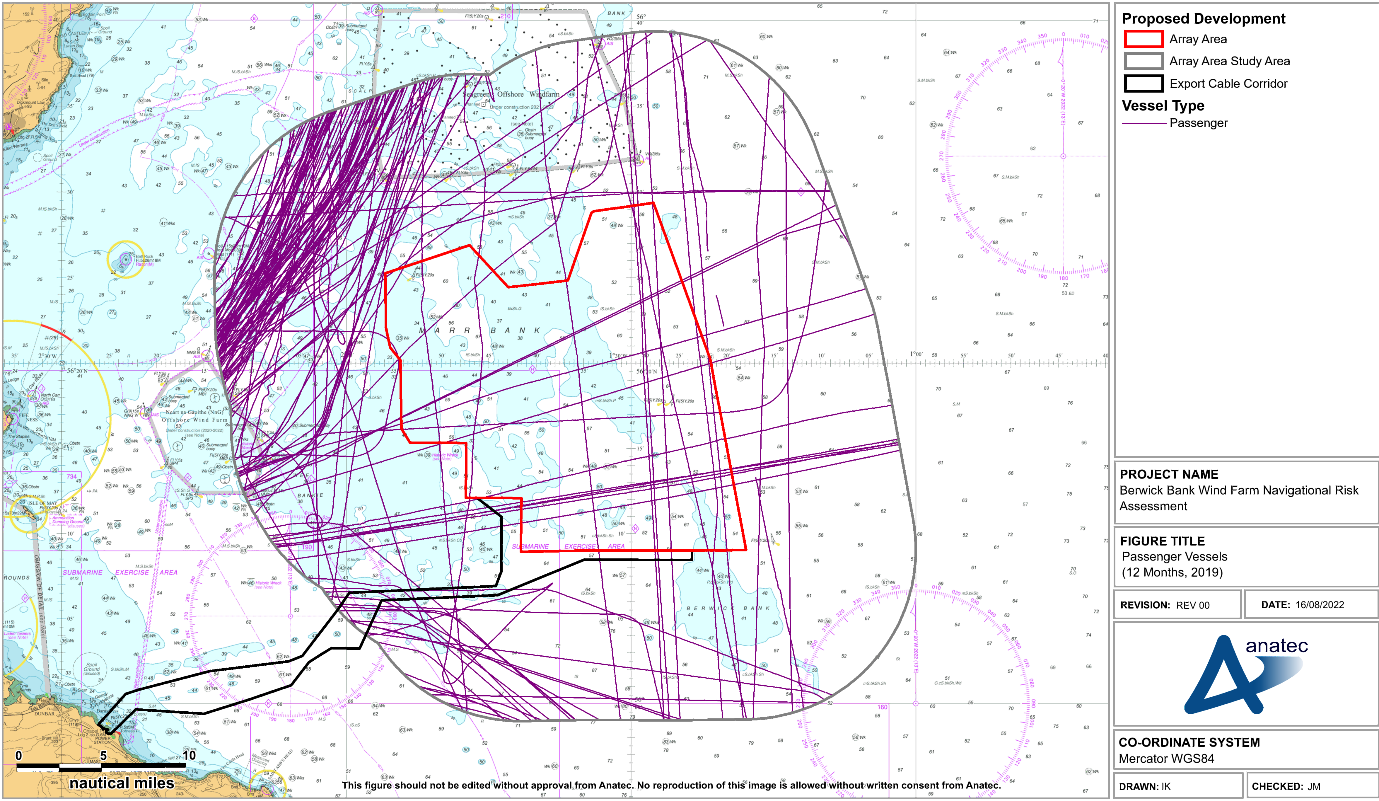
Figure E.8 Passenger Vessels (12 Months, 2019)
Passenger vessel traffic was not captured during the winter 2021 survey period (but was during the summer 2022 survey period). This may be attributed to the seasonal variation of traffic (see Figure E.7), or the effects of the COVID-19 pandemic.
E.3.5 Oil and Gas Vessels
Figure E.9 presents the oil and gas vessels recorded on AIS within the Proposed Development array area shipping and navigation study area during the study period.
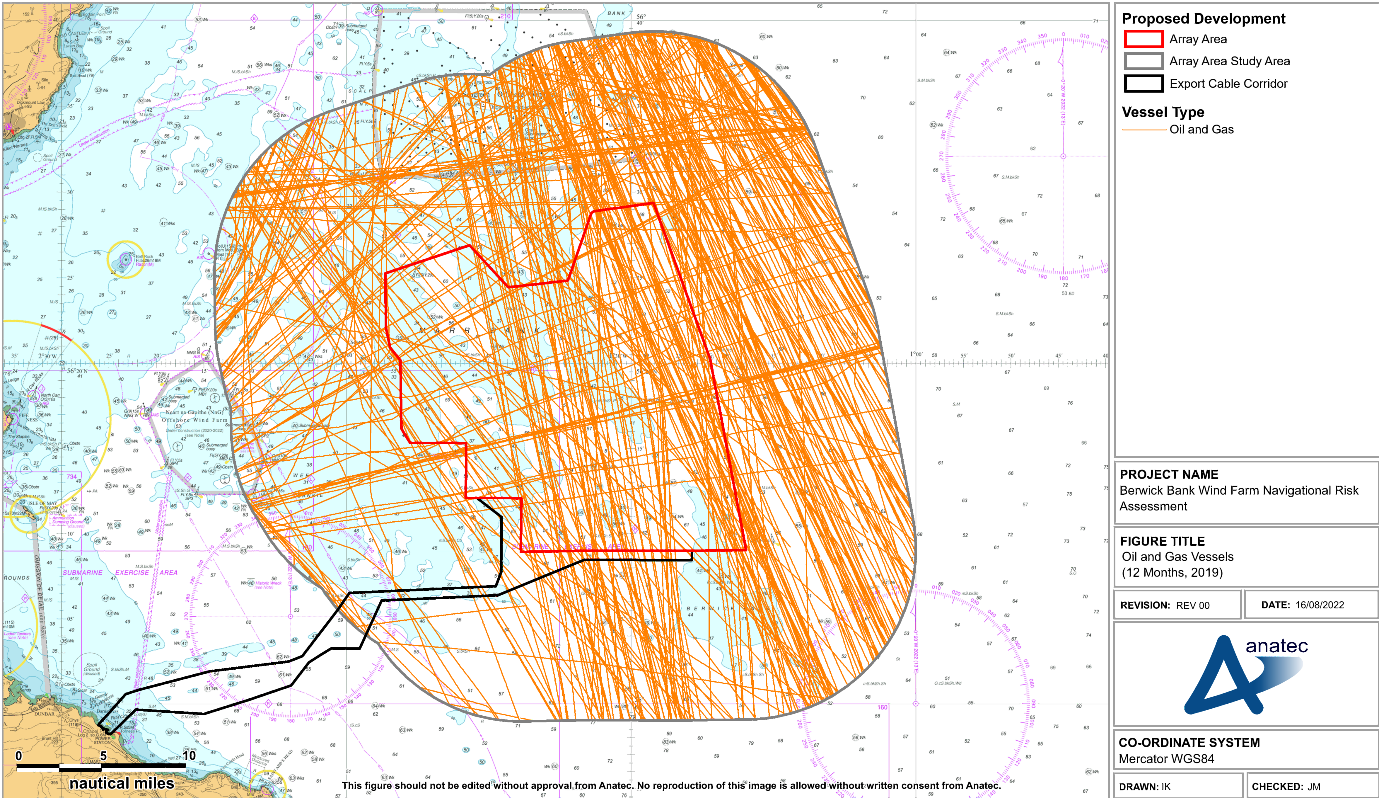
Figure E.9 Oil and Gas Support Vessels (12 Months, 2019)
Oil and gas support vessels were typically observed on transit, utilising a number of routes similar to that of commercial vessels (see Figure E.6). No oil and gas infrastructure is situated within the Proposed Development array area shipping and navigation study area.
A breakdown of the average number of daily unique oil and gas support vessels within the Proposed Development array area shipping and navigation study area per month is presented in Figure E.10.

Within the Proposed Development array area shipping and navigation study area, an average of approximately one unique oil and gas vessel was recorded per day.
The busiest month for oil and gas vessels throughout the study period within the Proposed Development array area shipping and navigation study area were March and May with 55 vessels recorded each, while the quietest month was November with 22 recorded. On average, 38 oil and gas vessels were recorded each month (factoring for downtime).
During the long-term study period, one instance of an offshore installation passing in proximity to the Proposed Development array area was recorded. An FPSO was recorded being towed by two tugs (supported by two other vessels) east-west into Dundee, passing the Proposed Development array area at a minimum distance of approximately 1.8 nm. This activity is presented in Figure E.11.
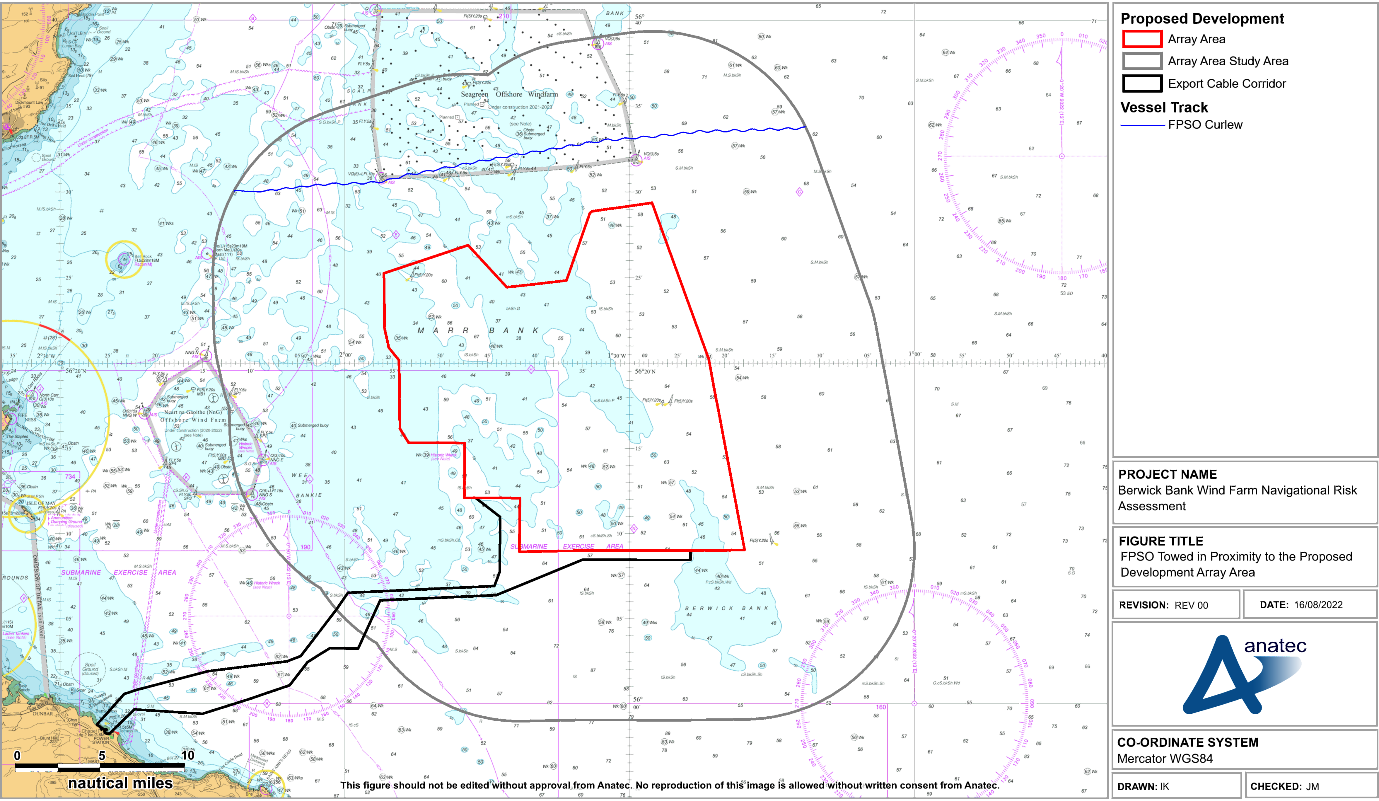
Figure E.11 FPSO Towed in proximity to the Proposed Development Array Area
E.3.6 Commercial Fishing Vessels
Figure E.12 presents the commercial fishing vessels recorded via AIS within the Proposed Development array area shipping and navigation study area during the study period colour-coded by activity. Based on the vessel speed, destination and navigational status broadcast, commercial fishing vessels were categorised as either on transit or actively fishing. It is noted that a proportion of commercial fishing vessels were recorded on transit before and after being identified as actively fishing.
Commercial fishing vessels were typically in transit to the eastern portion of the Proposed Development array area shipping and navigation study area while vessels were recorded actively fishing to the western portion of the Proposed Development array area shipping and navigation study area. It should be considered that as this assessment is AIS only; it is likely that commercial fishing vessel activity is underrepresented (see section 10.1.2.3).
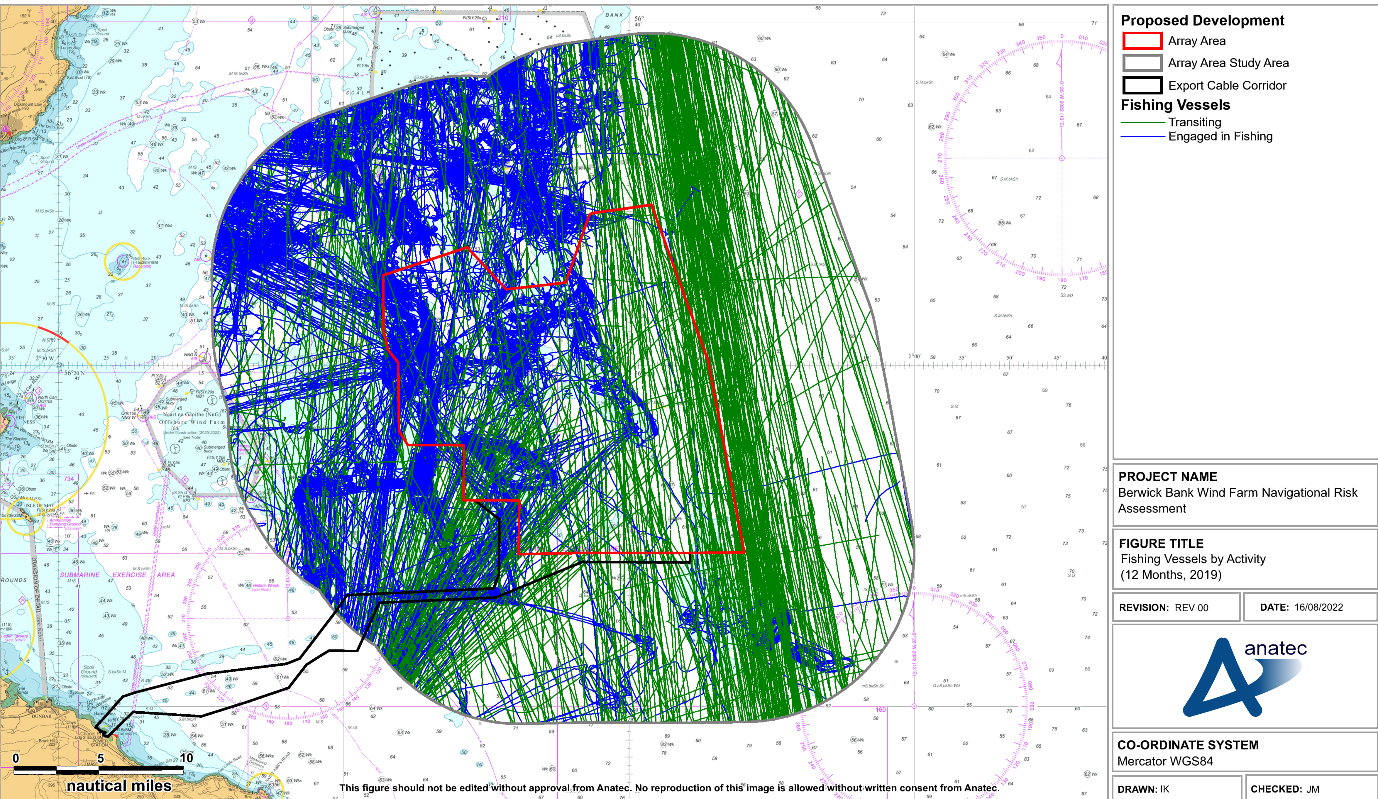
Figure E.12 Commercial Fishing Vessels by Activity (2019)
During the study period, 47% of commercial fishing vessels were estimated to be actively engaged in fishing activities within the Proposed Development array area shipping and navigation study area. The majority of these vessels were observed to be in the western half of the Proposed Development array area shipping and navigation study area. The average daily number of commercial fishing vessels recorded per day per month is summarised in Figure E.13.

The busiest month for fishing vessels within the Proposed Development array area shipping and navigation study area was June, with approximately 156 commercial fishing vessels recorded. The quietest month for commercial fishing vessels (factoring for downtime) was August, with 60 recorded. On average, 105 commercial fishing vessels per month were recorded within the Proposed Development array area shipping and navigation study area.
E.3.7 Recreational Vessels
Figure E.14 presents the recreational vessels recorded within the Proposed Development array area shipping and navigation study area during the study period.
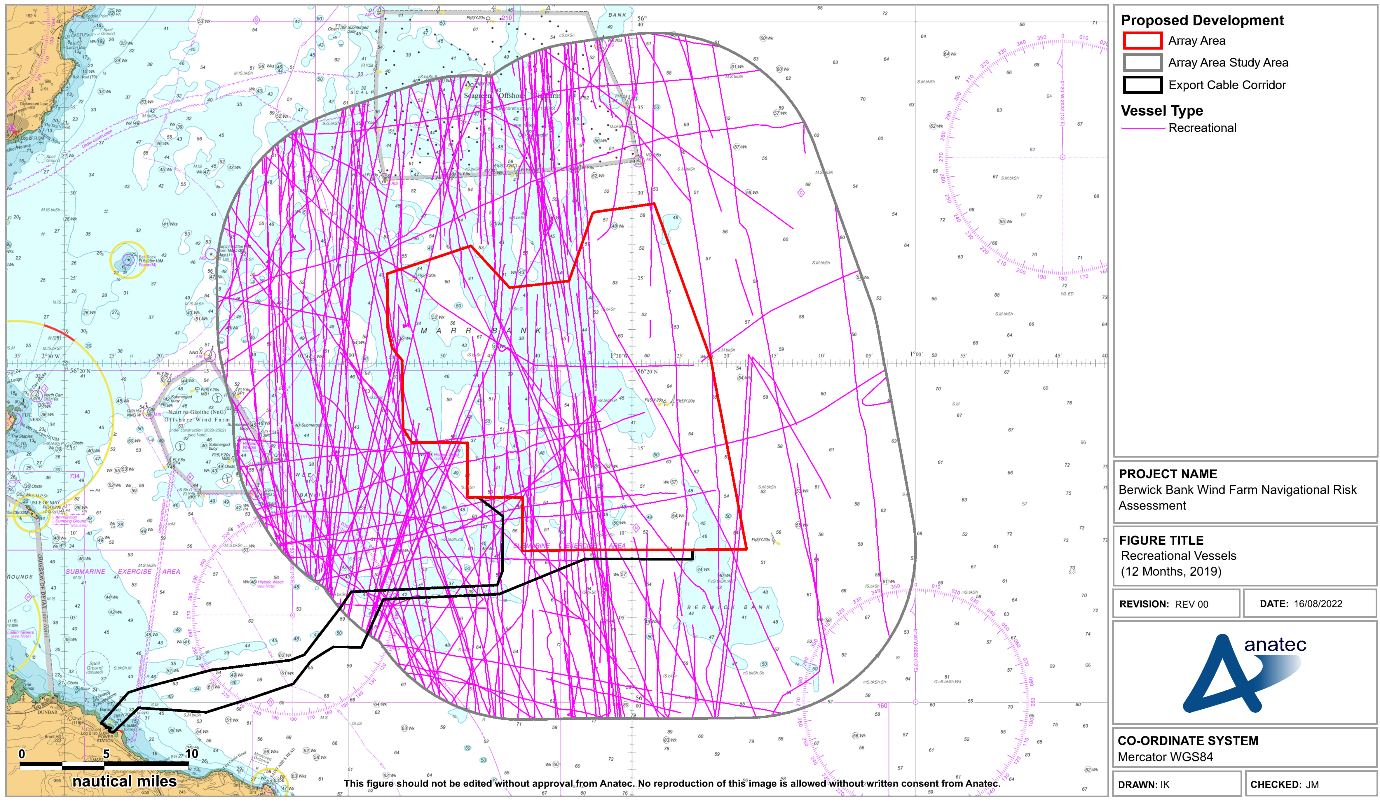
Figure E.14 Recreational Vessels (12 Months, 2019)
Recreational vessel activity was typically observed within the western portion of the Proposed Development array area shipping and navigation study area (i.e., closer to shore), with the majority of recreational activity recorded transiting in a north-south direction.
The distribution of daily unique recreational vessels recorded per month within the Proposed Development array area study area is presented in Figure E.15.

An average of approximately one recreational vessel every two days was recorded within the Proposed Development array area shipping and navigation study area. The seasonal variation in vessel numbers can be clearly seen, with limited numbers of recreational vessels recorded in the winter months and the vast majority of activity recorded during the summer months.
The busiest month for recreational vessels within the Proposed Development array area shipping and navigation study area was June, with 47 vessels recorded, while the quietest months were January, February, March, and December in which no vessels were recorded (although it is noted that significant downtime occurred during January 2019).
E.4 Site Specific Analysis
The vessel tracks intersecting the Proposed Development array area during the study period are presented in Figure E.16.
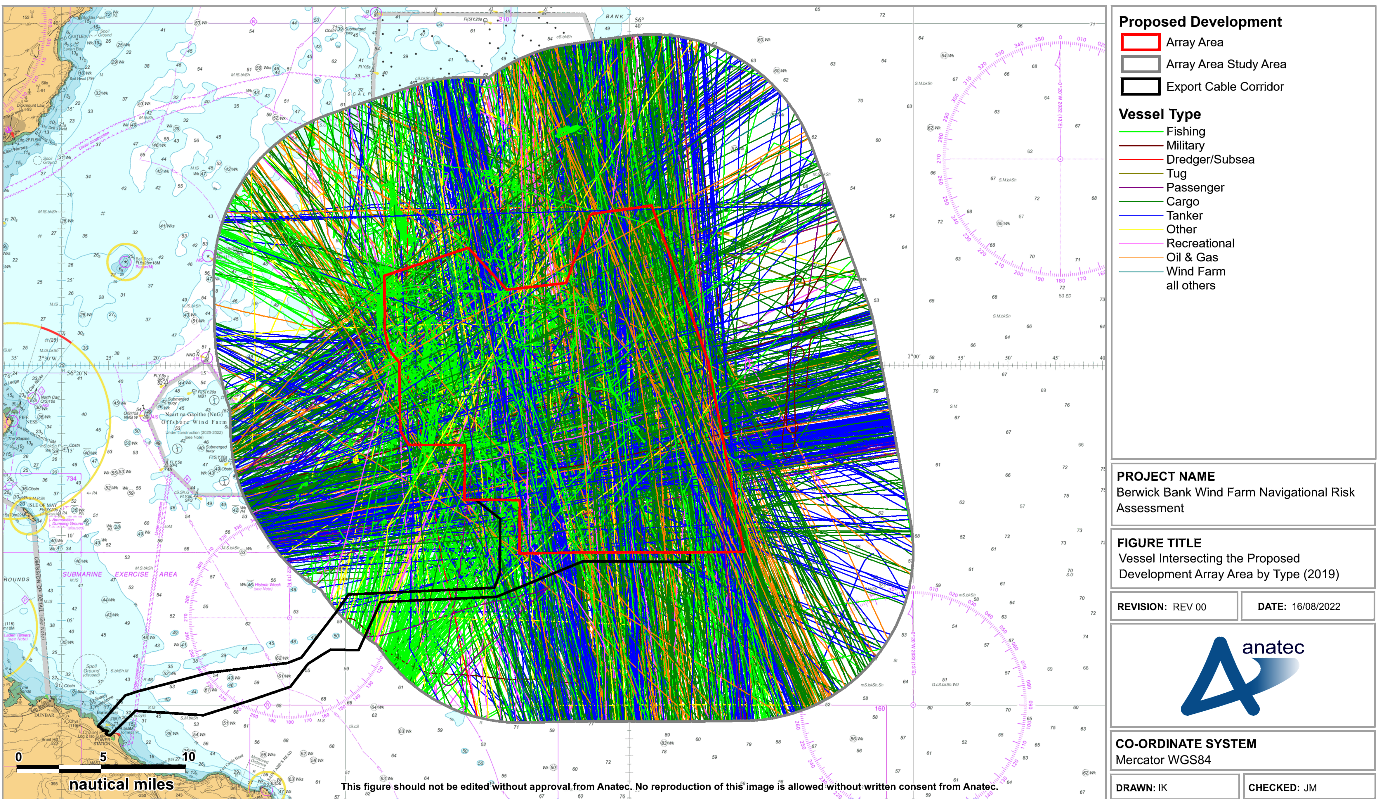
Figure E.16 Vessels intersecting the Proposed Development Array Area by Vessel Type (12 Months, 2019)
On average, five to six unique vessels per day were recorded intersecting the Proposed Development array area during 2019. The busiest day was the 30th of April, on which 14 unique vessels were recorded intersecting the Proposed Development array area.
A breakdown of the daily unique vessel count intersecting the Proposed Development array area is presented in Figure E.17 by vessel type.

Figure E.17 Distribution of Vessels intersecting the Proposed Development array area by Vessel Type
The most common vessel types recorded within the Proposed Development array area were cargo vessels (comprising 33% of all vessels), followed by tankers (29%), and commercial fishing vessels (23%).
It can be seen from Figure E.17 that significant levels of commercial activity were observed within the Proposed Development array area. On average, two cargo vessels and one to two tankers per day passed through the Proposed Development array area, while an average of one passenger vessel every two weeks was also recorded.