

E.5 Survey Data Comparison
Survey data recorded during 14-day periods in August 2022 and January 2021 were collected using a combination of AIS, radar, and visual observations. This subsection provides comparison of the 28-day survey period (summer and winter combined) against the long-term 2019 AIS data.
A comparison of the average number of each main vessel type recorded during the long-term 2019 data period and the 14-day survey periods is presented in Table E.2.
Table E.2 Average Daily Vessel Counts by Type for Survey Data and Long-Term Data
Vessel Type | Long-term 2019 AIS Data (Vessels per Day) | Winter Survey (January 2021) | Summer Survey (August 2022) | ||
|---|---|---|---|---|---|
Quietest Month | Busiest Month | Average Vessels per Day | Average Vessels per Day | Average Vessels per Day | |
Tankers | 4-5 | 5-6 | 2 | 5 | 4 |
Cargo vessels | 3 | 6 | 2 | 4 | 3 |
Commercial fishing vessels | 2 | 4 | 1 | 3 | 1-2 |
Oil and gas vessels | 0-1 | 1-2 | 1 | 1 | 0-1 |
Recreational vessels | 0 | 1-2 | 0 | 0 | 1 |
Passenger vessels | 0 | 1 | 0 | 0 | 1-2 |
The average daily vessel count within the long-term data was consistently slightly higher than for the survey periods; this may be attributed to the effects of the COVID-19 pandemic during the winter survey period, with traffic numbers in the process of recovering in the summer survey period. The absence of regularly scheduled passenger vessels in the vessel traffic surveys is also noted.
E.6 Conclusion
A year of AIS data during 2019 has been analysed to validate the winter 2021 and summer 2022 vessel traffic survey data recorded within the Proposed Development array area shipping and navigation study area.
The main type of vessels detected within the Proposed Development array area shipping and navigation study area during 2019 were tankers (33%), followed by cargo vessels (26%) and fishing vessels (22%). Similarly, main vessel types detected during the winter 2021 period were cargo vessels (36%), tankers (32%), and fishing vessels (16%). During summer 2022, the most common vessel types were tanker (30%) and tanker (23%), with increased passenger vessel numbers seen (12%) – fishing vessel numbers remained relatively high however (11%). Overall, the vessel types detected within the Proposed Development array area study area were similar between the vessel traffic survey data and long-term data, with differences in volumes of passenger vessel and recreational vessel traffic noted.
Appendix F Summer 2020 Vessel Traffic Data
Appendix F Summer 2020 Vessel Traffic Data
Vessel traffic survey data covering a seasonal summer 2020 survey period comprising AIS, Radar, and visual observation data has been collected in addition to the main dataset assessed within the NRA. This appendix provides full assessment of the additional data and compares it to the findings of the NRA assessment.
On this basis the aims of this appendix are:
- Assess the summer 2020 survey data; and
- Compare the findings against the 2019 data used to inform the NRA.
It should be considered when viewing the analysis that COVID-19 pandemic may have impacted the 2020 data.
The AIS and Radar tracks from the summer 2020 survey period are presented in Figure F.1.
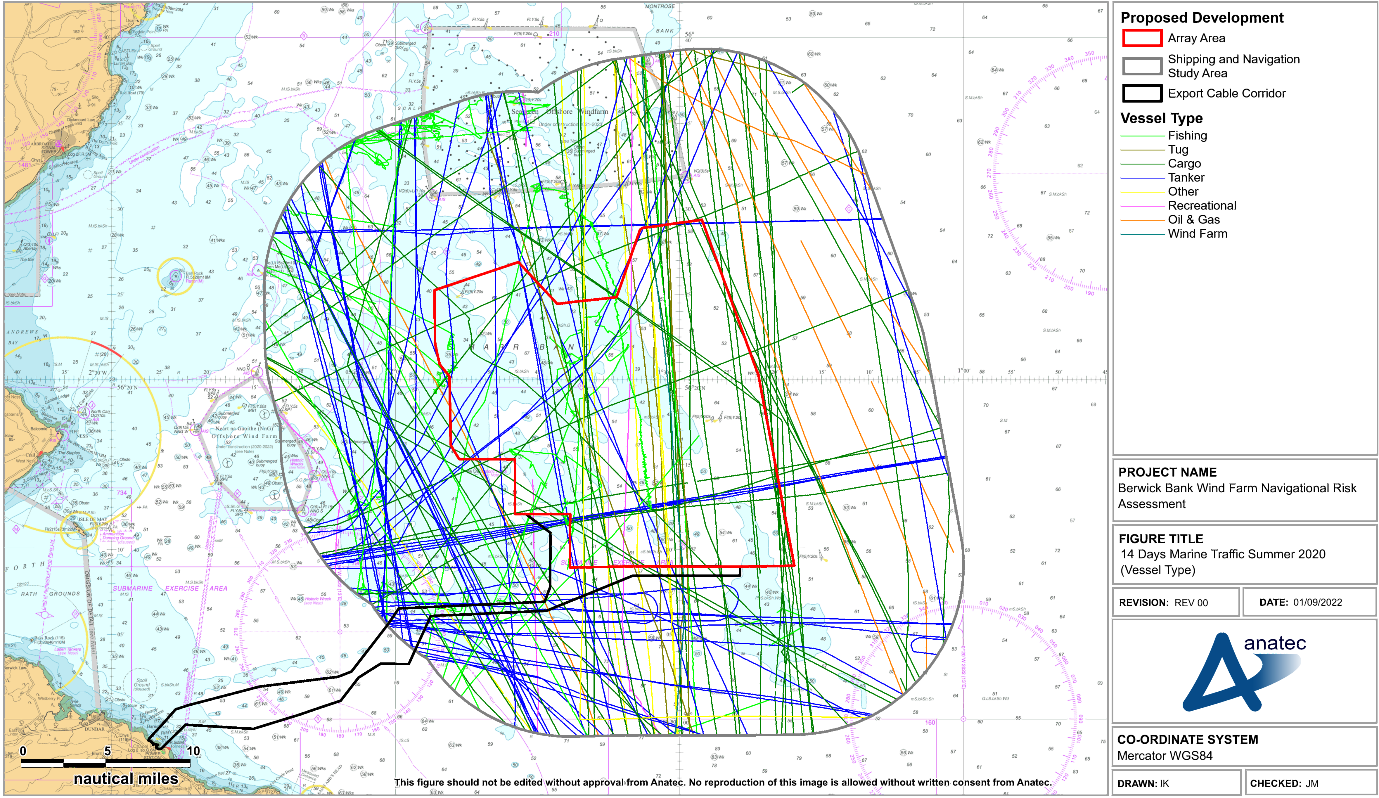
Figure F.1 14 Days Vessel Traffic Summer 2020 by Vessel Type
F.1 Vessel Count
For the 14 days analysed in the summer 2020 survey period, there was an average of 12 unique vessels per day recorded within the Proposed Development array area shipping and navigation study area. In terms of vessels intersecting the Proposed Development array area itself, there was an average of five unique vessels per day.
The daily number of unique vessels recorded within the Proposed Development array area shipping and navigation study area and the Proposed Development array area itself during the summer 2020 survey period are presented in Figure F.2. Since the survey commenced and concluded midway through the first and last days of the summer survey period, the first and last days are partial.

Throughout the summer survey period, approximately 43% of unique vessel tracks recorded within the Proposed Development array area shipping and navigation study area intersected the Proposed Development array area itself.
The busiest day recorded within the Proposed Development array area shipping and navigation study area throughout the summer 2020 survey period was 24 July when 18 unique vessels were recorded. The busiest day recorded within the Proposed Development array area itself throughout the summer survey period was 23 July when nine unique vessels were recorded.
The quietest full day recorded within the Proposed Development array area shipping and navigation study area throughout the summer 2020 survey period was 28 July when seven unique vessels were recorded. The quietest full day recorded within the Proposed Development array area itself throughout the summer 2020 survey period was 19 July when one unique vessel was recorded.
F.2 Vessel Type
The percentage distribution of the main vessel types recorded within the Proposed Development array area shipping and navigation study area during the summer 2020 survey period is presented in Figure F.3.

Throughout the summer period, the most common vessel types in the Proposed Development array area shipping and navigation study area were tankers (33%), cargo vessels (32%), and commercial fishing vessels (15%).
It is noted that no commercial ferries were identified in the summer 2020 vessel traffic survey data, which aligns with feedback provided by Forth Ports during consultation (see 10 June 2020 entry in Table 4.1 Open ▸ ).
F.2.1 Cargo Vessels
The tracks of cargo vessels recorded within the Proposed Development array area shipping and navigation study area throughout the summer 2020 survey period are presented in Figure F.4.
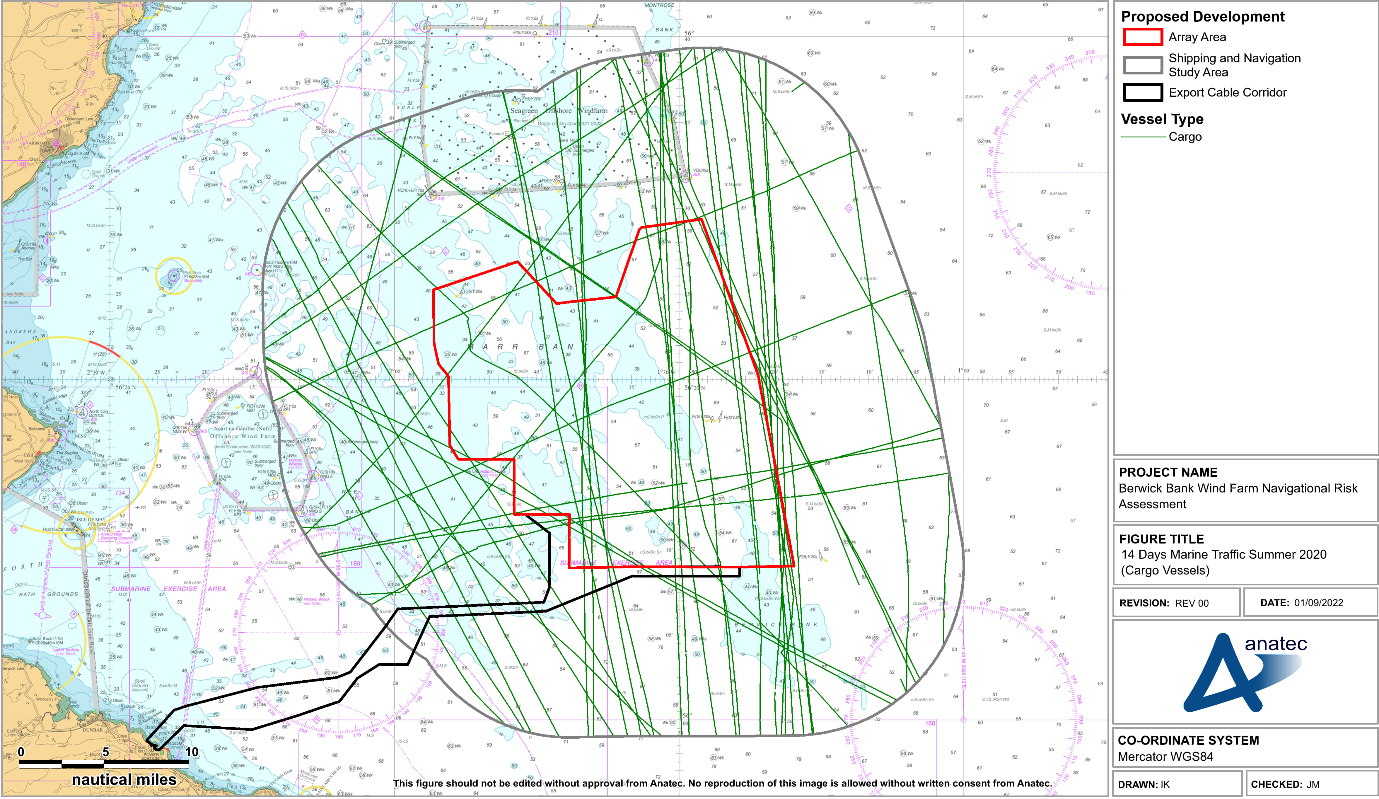
Figure F.4 14 Days Vessel Traffic Summer 2020 (Cargo Vessels)
Throughout the summer 2020 survey period an average of four unique cargo vessels per day were recorded within the Proposed Development array area shipping and navigation study area.
F.2.2 Tankers
The tracks of tankers recorded within the Proposed Development array area shipping and navigation study area throughout the summer 2020 survey period are presented in Figure F.5
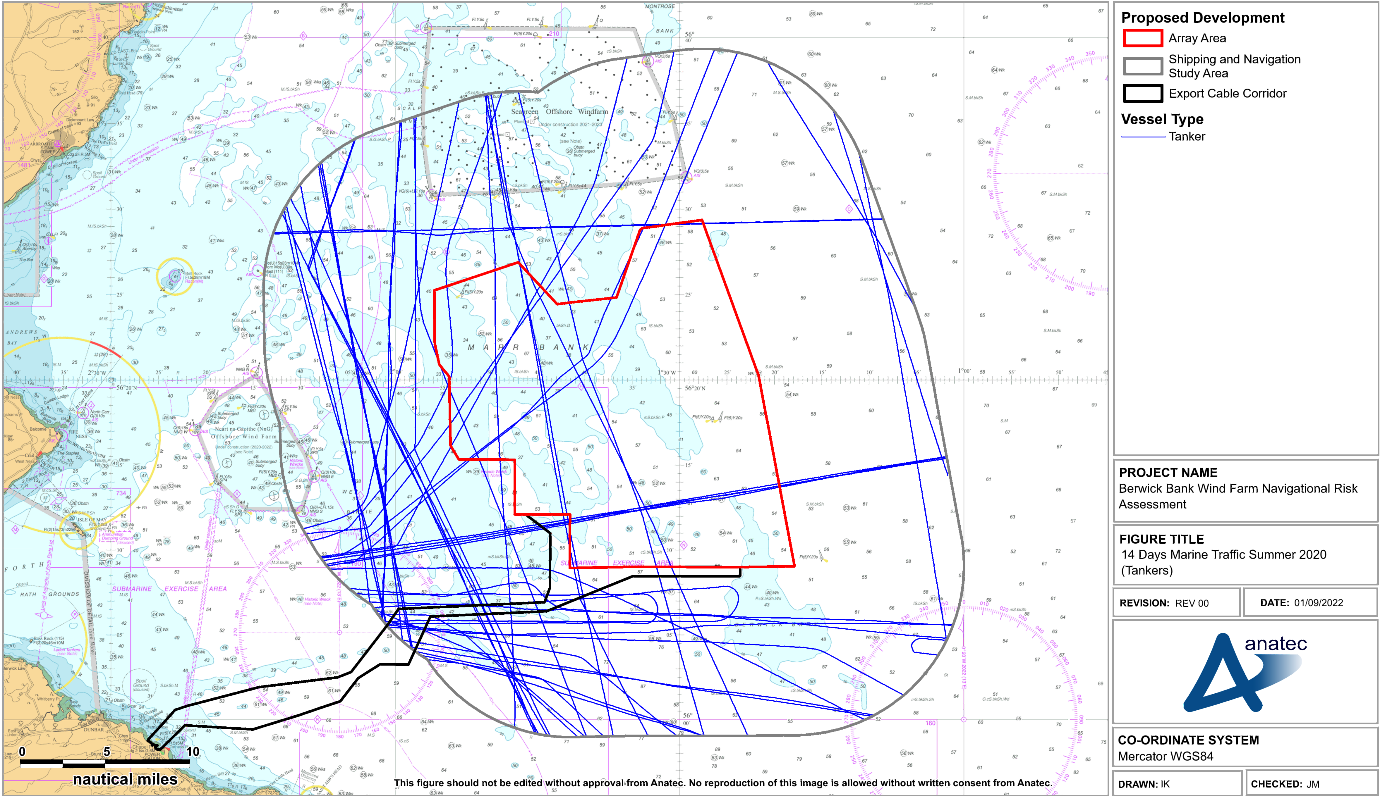
Figure F.5 14 Days Vessel Traffic Summer 2020 (Tankers)
Throughout the summer 2022 survey period an average of four unique tankers per day were recorded within the Proposed Development array area shipping and navigation study area.
F.2.3 Commercial Fishing Vessels
The tracks of commercial fishing vessels recorded within the Proposed Development array area shipping and navigation study area throughout the summer 2020 survey period are presented in Figure F.6.
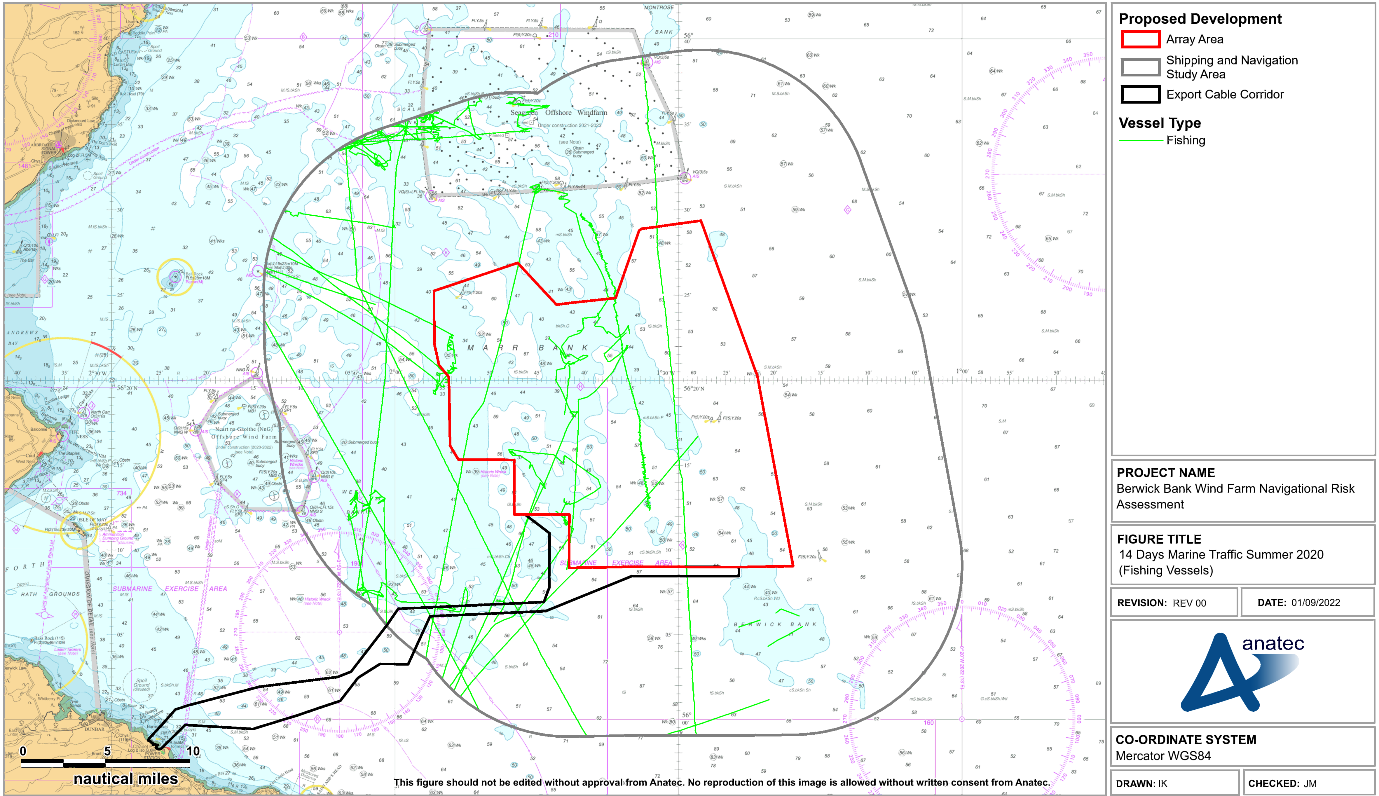
Figure F.6 14 Days Vessel Traffic Summer 2020 (Commercial Fishing Vessels)
Throughout the summer 2020 survey period an average of four unique commercial fishing vessels per day were recorded within the Proposed Development array area shipping and navigation study area.
F.2.4 Oil and Gas Vessels
The tracks of oil and gas vessels recorded within the Proposed Development array area shipping and navigation study area throughout the summer 2020 survey period are presented in Figure F.7.
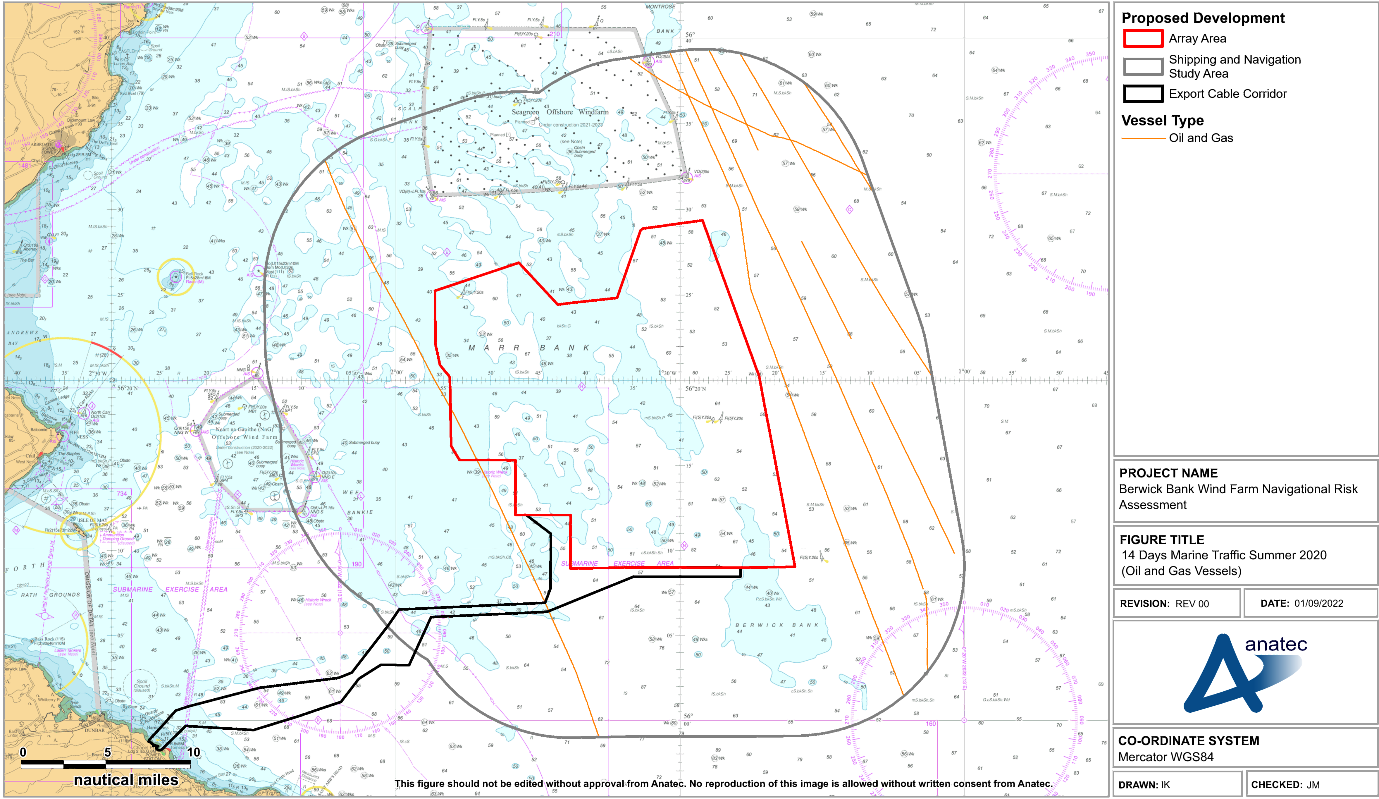
Figure F.7 14 Days Vessel Traffic Summer 2020 (Oil and Gas Vessels)
Throughout the summer 2020 survey period an average of four unique oil and gas vessels per day were recorded within the Proposed Development array area shipping and navigation study area.
F.2.5 Recreational Vessels
The tracks of recreational vessels recorded within the Proposed Development array area shipping and navigation study area throughout the summer 2020 survey period are presented in Figure F.8
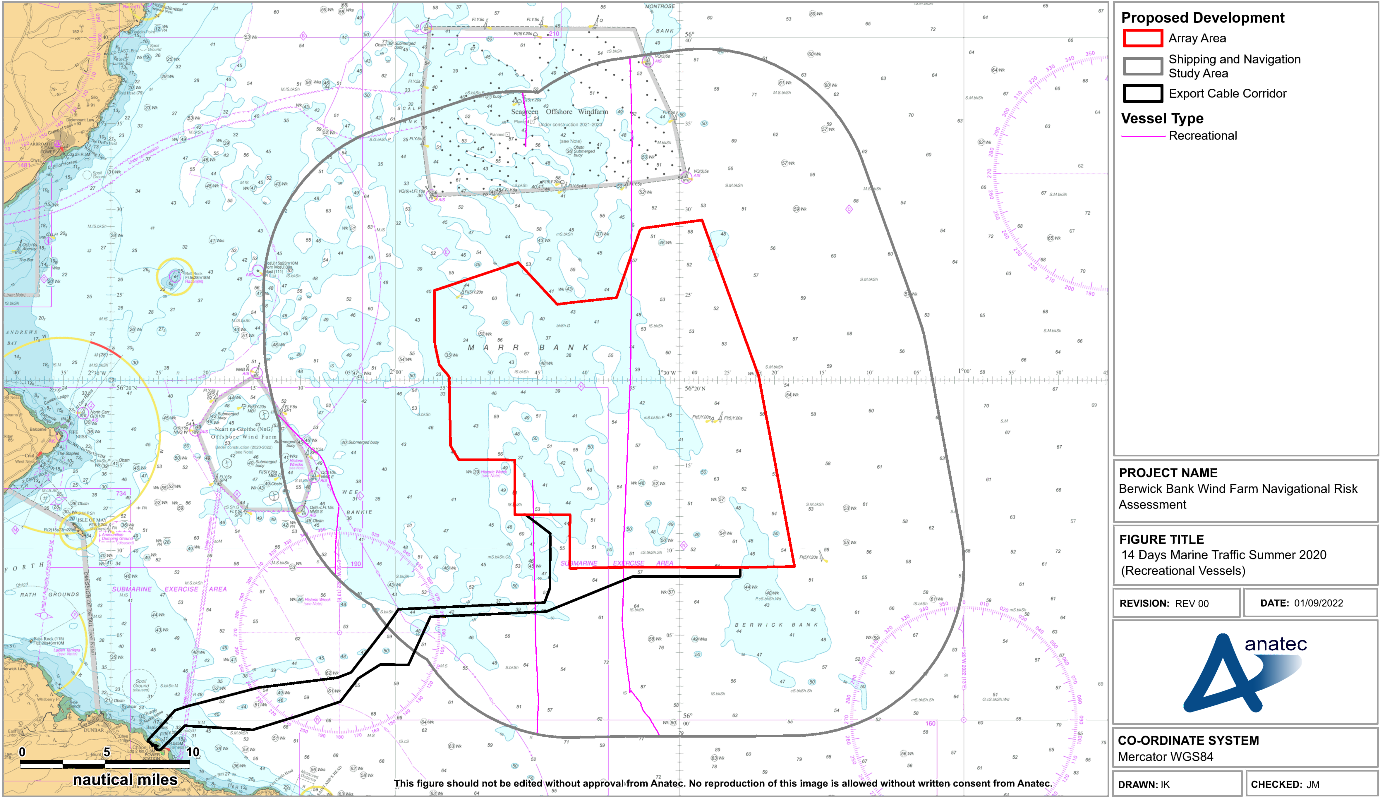
Figure F.8 14 Days Vessel Traffic Summer 2020 (Recreational Vessels)
Throughout the summer 2020 survey period an average of four unique recreational vessels per day were recorded within the Proposed Development array area shipping and navigation study area.
The following section details vessel traffic within the Proposed Development array area itself. The distribution of vessel types within the Proposed Development array area is presented in Figure F.9.

Figure F.9 Vessel Type Distribution within Proposed Development Array Area (14 Days Summer 2020)
The most common vessel types recorded within the Proposed Development array area were cargo vessels (42%), followed by tankers (23%), and commercial fishing vessels (12%).
It can be seen from Figure F.9 that significant levels of commercial activity were observed within the Proposed Development array area. On average, two cargo vessels and one tanker per day passed through the Proposed Development array area.
Survey data recorded during 14-day periods in August 2022 and January 2021 were collected using a combination of AIS, radar, and visual observations. This subsection provides comparison of the 28-day survey period (summer and winter combined) against the summer 2020 survey data.
A comparison of the average number of each main vessel type recorded during the summer 2020 survey data period and the 14-day survey periods is presented in Table F.1.
Table F.1 Average Daily Vessel Counts by Type for the 14-Day Survey Periods
Vessel Type | Summer 2020 | Winter 2021 | Summer 2022 |
|---|---|---|---|
Tankers | 4 | 5 | 4 |
Cargo vessels | 4 | 4 | 3 |
Commercial fishing vessels | 2 | 3 | 1-2 |
Oil and gas vessels | 0-1 | 1 | 0-1 |
Recreational vessels | 0-1 | 0 | 1 |
Passenger vessels | 0 | 0 | 1-2 |
The average daily vessel count within the summer 2020 survey data was broadly similar to the summer 2022 survey data, and slightly lower than for the winter survey periods. As with the winter 2021 dataset there were no passenger vessels recorded in the summer 2020 data, which is likely related to the COVID-19 pandemic.
F.5 Conclusion
14 days of AIS, Radar, and visual observation data during summer 2020 has been analysed to validate the winter 2021 and summer 2022 vessel traffic survey data recorded within the Proposed Development array area shipping and navigation study area.
The main type of vessels detected within the Proposed Development array area shipping and navigation study area during summer 2020 were tankers (33%), followed by cargo vessels (32%) and fishing vessels (15%). Similarly, main vessel types detected during the winter 2021 period were cargo vessels (36%), tankers (32%), and fishing vessels (16%). During summer 2022, the most common vessel types were cargo vessels (30%) and tanker (23%), with increased passenger vessel numbers seen (12%) – fishing vessel numbers remained relatively high however (11%). Overall, the vessel types detected within the Proposed Development array area study area were similar between the vessel traffic survey data and summer 2020 data.
[1] It is noted that contact was also sought for Princess Cruises and Viking Ocean Cruises but neither was able to be reached.
[2] The Project is an amalgamation of two previously proposed and separate offshore wind farms – Berwick Bank Wind Farm and Marr Bank Wind Farm, which were initially to be located next to each other in the Firth of Forth Zone. An Offshore EIA Scoping Report for the 2020 Berwick Bank was shared with stakeholders in August 2020 and a corresponding Scoping Opinion was received in March 2021. The amalgamated Berwick Bank Wind Farm is assessed in this NRA. A new Scoping Report was issued to MS-LOT in October 2021, but a Scoping Opinion has not been published by MS-LOT at the time of writing. The content of the Scoping Opinion for the 2020 Berwick Bank is considered relevant, but not directly applicable for the Proposed Development.
[3] In the event that the Project brings forward a single line of orientation layout post-consent, it is acknowledged that additional assessment will be required in line with MGN 654 requirements. This includes the undertaking of a safety justification to demonstrate that risk to navigation and SAR is ALARP, in consultation with the MCA.
[4] Assuming that a cable repair vessel or excavator/backhoe dredger are not required more than once per year.
[5] The closest distance to the final array layout for Seagreen is approximately 2.3 nm measured from the centre of the closest structure location. A final array layout for Inch Cape has not yet been published.
[6] Reported to an accident investigation branch or an anonymous reporting service. Unconfirmed incidents have not been considered noting that to date only one further alleged incident has been rumoured but there is no evidence to confirm.
[7] Hamburg is identified as the leading destination for the route, noting that there are alternative destinations in the North Sea.
[8] The summer period has been given priority over the winter period where there are differences in vessel traffic movements resulting from the construction of Seagreen given that these changes are reflective of the baseline to be expected post construction of Seagreen.
[9] The cumulative screening of the Cambois connection is based on information presented in the Scoping Report submitted in October 2022.
[10] The minimum blade clearance will be 37 m above LAT as outlined as part of the maximum design scenario in Section 6.2.2.
[11] NLB are currently minimising use of Intermediate Peripheral Structures (IPS) which have typically been used for nearshore developments in the past.
[12] The hazard log is the outputs of the Hazard Workshop and feeds into the final assessment of risk contained within Table 18.1 Open ▸ .
[13] Four vessels side by side equates to three gaps between vessels, so two times 131 m three times totalling 786 m.
[14] As per SI 2007 No 1948 “The Electricity (Offshore Generating Stations) (Safety Zones) (Application Procedures and Control of Access) Regulations 2007.
[15] For the purposes of this assessment, UK waters is defined as the UK Exclusive Economic Zone (EEZ) and UK territorial waters refers to the 12 nm limit from the British Isles, excluding the Republic of Ireland.